218
International Journal of Pharmaceutical Sciences and Drug Research
2016; 8(4): 218-222
Research Article
CODEN (USA): IJPSPP
ISSN: 0975-248X
Development and Validation of Stability-Indicating HPTLC Method for
Determination of Solifenacin Succinate as bulk Drug and in Tablet Dosage
Form
M. C. Damle
*, P. C. Rokade
AISSMS College of Pharmacy, Kennedy road, Near R.T.O, Pune-411 001, Maharashtra, India
ABSTRACT
A new simple, stability- indicating high performance thin layer chromatographic (HPTLC) method has been developed and validated for estimation of Solifenacin succinate in bulk and in tablet dosage form. The optimized mobile phase was Methanol: Water: Glacial acetic acid (9:1:0.1v/v/v) with UV detection at 216 nm. The retention factor for Solifenacin succinate was found to be 0.49 ± 0.03. The drug was subjected to stress conditions of hydrolysis under different pH conditions, oxidation, photolysis and thermal degradation as per ICH guidelines. Results were found to be linear in the concentration range of 2000-10000ng band-1.
Keywords: Solifenacin succinate, HPTLC, Forced degradation, Validation.
INTRODUCTION
Solifenacin succinate, a muscarinic receptor antagonist, chemically is (3R)-1-Azabicyclo [2.2.2] oct-3-yl (1S)-1-phenyl-3, 4-dihydroisoquinoline-2(1H)-carboxylate compound with butanedioic acid (1:1). [1] Muscarinic
receptors play an important role in several major cholinergically mediated functions, including contractions of urinary bladder smooth muscle. Solifenacin succinate is used in the treatment of overactive bladder with symptoms of urge urinary incontinence, urgency, and urinary frequency. [2]
Literature survey indicates a bioanalytical method [3],
some HPTLC methods [4-5] reported for estimation of
Solifenacin succinate. There were few stability indicating HPLC methods [6-9] and stability indicating
HPTLC methods [10-11] reported for Solifenacin succinate
*Corresponding author: Dr. M. C. Damle,
AISSMS College of Pharmacy, Kennedy road, Near R.T.O, Pune-411 001, Maharashtra, India; Tel.: +91-20- 26058208; E-mail: [email protected]
Received: 16 May, 2016; Accepted: 03 June, 2016
but stress degradation conditions and results did not match. The aim of the work was to confirm behavior of Solifenacin succinate under stress conditions.
Fig. 1: Chemical structure of Solifenacin succinate
MATERIALS AND METHODS
Instrumentation and chromatographic conditions
Chromatographic separation of drug was performed on TLC plate precoated with silica gel 60 F254 (10 × 10) with
250µm thickness (E. MERCK, Darmstadt, Germany) using a CAMAG Linomat 5 sample applicator (Switzerland). Samples were applied on the plate as a band with 6 mm width using Camag 100μL sample syringe (Hamilton, Switzerland).
Switzerland) by using Methanol: Water: Glacial Acetic Acid (9:1: 0.1v/v/v)as mobile phase. The optimized chamber saturation time for mobile phase was 15 min. The length of chromatogram run was 9 cm and development time was approximately 20 min. TLC plates were dried in a current of air with the help of a drier. Densitometric scanning was performed on CAMAG thin layer chromatography scanner at 216 nm for all developments operated by WINCATS software version 1.4.2. The source of radiation utilized was deuterium lamp emitting a continuous UV spectrum between 200 to 400 nm.
Preparation of Standard Solution
Working standard solution of Solifenacin succinate was prepared by dissolving 10 mg of drug in 10 mL of methanol to get concentration of 1000 mcg mL-1.
Selection of Detection Wavelength
Standard solution of Solifenacin succinate was diluted to concentration of 100 mcg mL-1 and scanned in UV
range of 200-400 nm. The UV spectrum is as shown in the Fig. 2. For HPTLC method 216 nm was selected as the wavelength for detection.
Stress degradation studies of bulk drug [12-16]
The forced degradation studies were carried out on bulk drug substance in order to confirm the stability-indicating property and selectivity of the developed method. The degradation was carried out under acid/base/ neutral hydrolytic, oxidative, thermolytic, and photolytic stress conditions.
Acid treatment
5 mL working standard solution of Solifenacin succinate (10000 mcg mL-1) was mixed with 5 mL of 1 N
HCl and volume was made up to 50 mL by using methanol. Solution was refluxed for 2 hours then solution was cooled and volume was adjusted to 50 mL. Then 6µL of resulting solution was applied on TLC plate and developed under optimized chromatographic conditions.
Alkali treatment
5 mL working standard solution of Solifenacin succinate (10000 mcg mL-1) was mixed with 5 ml of 1 N
NaOH and volume was made up to 50 mL by using methanol. The solution was refluxed for 18 hours then solution was cooled and volume was adjusted to 50 mL. Then 6µL of resulting solution was applied on TLC plate and developed under optimized chromatographic conditions.
Oxidative degradation
1 mL working standard solution of Solifenacin succintae (10000 mcg mL-1) was mixed with 1 mL of 3%
v/v H2O2 and volume was made up to 10 mL by using
methanol. The solution was kept at room temperature for 4 hours. Then 6µL of resulting solution was applied on TLC plate and developed under optimized chromatographic condition.
Photo-degradation [15]
Photolytic studies were carried out by exposure of drug to UV light up to 200 watt hours square meter-1 and
subsequently to fluorescence light to achieve
illumination not less than 1.2 million lux hours. Sample was weighed, dissolved in methanol to get concentration of (1000 mcg mL-1).6µL of the resulting
solution was applied to HPTLC.
Neutral Degradation
1 mL working standard solution of Solifenacin succinate (10000 mcg mL-1) was mixed with 1 mL
distilled H2O and volume was made up to 10 mL by
using methanol. The solution was kept at room temperature for 24 hrs. Then 6µL of resulting solution was applied on TLC plate and developed under optimized chromatographic condition.
Degradation under dry heat
Dry heat study was performed by keeping drug in oven at 80ºC for period of 6 hours then sample was withdrawn, weighed and dissolved in methanol to get solution of (1000 mcg mL-1). 6µL of the resulting
solution was applied to HPTLC.
RESULTS AND DISCUSSION
Optimization of chromatographic conditions
The primary objective in developing this stability indicating HPTLC method is to achieve the response of Solifenacin succinate free from interference by degradation products, if any. The chromatographic separation was achieved by linear ascending development in 10 cm × 10 cm twin trough glass chamber using Methanol: Water: Glacial acetic acid (9:1:0.1v/v/v) mobile phase and detection was carried out at 216 nm. The retention factor for Solifenacin succinate was found to be 0.49 ± 0.03.
Result of forced degradation studies Acid treatment
Solifenacin succinate on treatment with 1N HCl for 2 hours reflux showed broadened peak with peak purity within limits, thus it is not possible to calculate % degradation.
Alkali treatment
Solifenacin succinate on treatment with 1N NaOH and kept for 18 hours reflux showed 14.20% degradation with no degradation product observed.
Peroxide treatment
Solifenacin succinate on treatment with 3%v/v H2O2
and kept for 4 hours at room temperature showed 10.30% degradation with no degradation product observed.
Neutral treatment
Solifenacin succinate on treatment with H2O for 24
hours at room temperature it showed 1.99% degradation with no degradation product observed.
Photo degradation Studies
Solifenacin succinate when exposed to ultraviolet light (200 Watt hours/Square meter) and when exposed to fluorescence light (1.2 million lux hours) it showed 3.18 %degradation.
Dry Degradation Studies
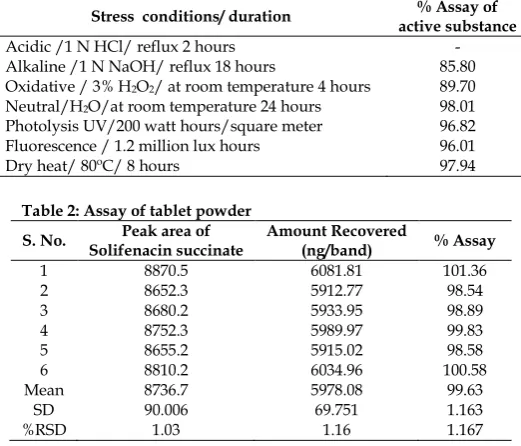
Int. J. Pharm. Sci. Drug Res. July-August, 2016, Vol 8, Issue 4 (218-222) The forced degradation studies data are summarized in
Table 1.
Table 1: Data of forced degradation studies of Solifenacin succinate Stress conditions/ duration active substance % Assay of
Acidic /1 N HCl/ reflux 2 hours -
Alkaline /1 N NaOH/ reflux 18 hours 85.80
Oxidative / 3% H2O2/ at room temperature 4 hours 89.70
Neutral/H2O/at room temperature 24 hours 98.01
Photolysis UV/200 watt hours/square meter 96.82
Fluorescence / 1.2 million lux hours 96.01
Dry heat/ 80ºC/ 8 hours 97.94
Table 2: Assay of tablet powder
S. No. Solifenacin succinate Peak area of Amount Recovered (ng/band) % Assay
1 8870.5 6081.81 101.36
2 8652.3 5912.77 98.54
3 8680.2 5933.95 98.89
4 8752.3 5989.97 99.83
5 8655.2 5915.02 98.58
6 8810.2 6034.96 100.58
Mean 8736.7 5978.08 99.63
SD 90.006 69.751 1.163
%RSD 1.03 1.16 1.167
Method Validation [17]
The method was validated for specificity, linearity, range, accuracy, precision, detection limit, quantitation limit and robustness, in accordance with ICH guidelines.
Specificity
The specificity of the method was ascertained by peak purity profiling studies. The peak purity values were found to be more than 0.9997, indicating the no interference of any other peak of degradation product, impurity or matrix.
Assay
Tablets were procured from local market. Five tablets, each containing 5 mg of Solifenacin Succinate were weighed and powdered. Powder equivalent to 10 mg of drug was transferred to 10 mL volumetric flask and was diluted with methanol, sonicated for 10 min, volume made to 10 mL by using methanol (1000µg/mL). Solution was filtered through whatman filter paper, 6µL volumes of filtrate was applied on plate. Analysis was repeated for six times. % assay was determined from linearity equation.
Linearity and range
The standard stock solutions of Solifenacin succinate(1000 mcg mL-1) were applied on TLC plate in
range of 2, 4, 6, 8 and10 µL Straight-line calibration graphs were obtained in the concentration range 2000-10000 ng band-1 with high correlation coefficient >
0.999.
Accuracy
To check accuracy of the method, recovery studies were carried out by adding standard drug to sample at three different levels 80, 100 and 120 %. Basic concentration of sample chosen was 4000 ng band-1 from tablet
solution. The drug concentrations were calculated from respective linearity equation. The results of the recovery studies indicated that the method is accurate for estimation of drug in tablet dosage form. The results obtained are shown in Table 3.
Precision
Set of three different concentrations in three replicates of standard solutions of were prepared. All the solutions were analyzed on the same day in order to record any intraday variations in the results.
Table 3: linearity of Solifenacin succinate 2000- 10000 ngband-1
Concentration (ngband-1) Area Mean Area ± SD
2000 3486.1 3352 3412.2 3470.5 3472.6 3438.68 ± 56.18351
4000 6025.2 6531.8 6390 6328.6 6470.3 6349.18 ± 196.8965
6000 8115.3 9374.2 8944.7 8869.8 9125.8 8885.96 ± 472.6336
8000 10454.6 11690.9 12226.5 11014.2 11298.2 11336.88 ± 670.9677
10000 13340.9 14344.4 14125.2 13719.8 13543.2 13814.7 ± 413.581
Table 4: Recovery Studies of Solifenacin succinate
Drug Amount taken (ng band-1) Amount added (ng band-1) Total amount found (ng band-1) % Recovery* % RSD
Solifenacin succinate
4000 3200 7235.36 100.48 0.92
4000 4000 7941.72 99.26 0.63
4000 4800 8876.99 100.87 1.79
*Average of three determinations
Intra-day variation, as RSD (%), was found to be in the range of 0.38 to 1.15. For Inter day variation study, three different concentrations of the standard solutions in linearity range were analyzed on three consecutive days. Interday variation, as RSD (%) was found to be in the range of0.69 to 1.63. The lower values of % R.S.D. obtained indicated that method is precise.
Limit of detection (LOD) and Limit of quantitation (LOQ)
LOD and LOQ were calculated as 3.3*σ/S and 10*σ/S, respectively; where σ is the standard deviation of the
response at lowest concentration in range and S is the slope of the calibration plot. The LOD and LOQ were found to be 144.05 and 436.51 ng band-1, respectively.
Robustness Studies
operational parameters (% R.S.D. < 2). The results are given in Table 7.
Fig. 2: UV Spectra of standard solution of Solifenacin succinate 100 mcg mL-1
Fig. 3: Representative densitogram of standard solution of Solifenacin succinate (6000 ng band-1, RF = 0.51)
Fig. 4: Calibration curve of Solifenacin succinate of range 2000-10000 ng band-1
DISCUSSION
Some research papers reported that Solifenacin succinate degrades under acid and alkali catalyzed hydrolytic conditions using 0.1N HCl and 0.1N NaOH where as some research papers reported stringent conditions of 5N HCL and 5N NaOH for forced degradation study of Solifenacin succinate. Current study confirmed that Solifenacin succinate does not degrade at mild conditions and by using 1N HCl and 1N NaOH the drug showed degradation but no degradation product was observed. Solifenacin succinate was found to be stable at thermal, neutral and photo degradation study which resembled previous research work.
Table 5: Intra-day precision of Solifenacin succinate Concentration
(ng/band) Area Mean Area SD % RSD
2000 3600.30 3590.70 3600.53 0.38 0.38
3610.60
4000 6212.60 6302.40 6234.70 1.16 1.15
6189.10
6000
8852.30
8865.30 0.41 0.40
8901.20 8842.40
Table 6: Inter-day precision of Solifenacin succinate Concentration
(ng/band) Area Mean Area SD % RSD
2000 3600.25 3550.20 3645.18 1.653 1.63
3685.10
4000 6219.30 6123.20 6210.70 1.626 1.62
6289.60
6000 8860.50 8752.30 8808.73 0.701 0.69
8813.40
Table 7: Robustness Data in Terms of Peak Area (% RSD)
S. No. Parameter (% RSD)
1 Mobile phase saturation time (± 10 %) 1.39
2. Mobile phase variation 1.40
*Average of three determinations
The developed HPTLC method is precise, specific, accurate, reproducible, and stability-indicating, without interference from the excipients or from degradation products resulting from treatment with acid, alkali, oxidizing agent, or from UV irradiation and can be used for quantitative analysis of Solifenacin succinate in pharmaceutical dosage form. This method is used to monitor stability of solifenacin succinate.
ACKNOWLEDGEMENT
The authors are thankful to the Principal and management of AISSMS college of Pharmacy, Pune for providing necessary facilities and also to Unichem laboratories, Goa for providing us Solifenacin succinate bulk drug as gift sample.
REFERENCES
1. The Merck Index. An Encyclopedia of Chemicals, Drugs and
Biologicals, 14th edition, 2006, pp 1494.
2. http://en.wikipedia.org/wiki/Solifenacin (Jan 2016)
3. Shaik R, Puttagunta S. Bioanalytical method for
quantification of Solifenacin in rat plasma by LC-MS/MS and its application to pharmacokinetic study. Journal of Analytical Science and Technology. 2014; 5(35): 1-8.
4. Kumar A, Mohan T. A Rapid RP-HPLC Method
Development and Validation for the Quantitative Estimation of Solifenacin Succinate in Tablets. International Journal of Pharmacy and Pharmaceutical Sciences. 2014; 6(10): 201-204.
5. Kumar D, Vijayasree V. Validated RP-HPLC Method For The
Estimation of Solifenacin Succinate In Tablet Dosage Forms. Pharmanest. 2013; 4(2): 206-212.
Int. J. Pharm. Sci. Drug Res. July-August, 2016, Vol 8, Issue 4 (218-222)
7. Desai N, Syed S. Development & Validation of Stability Indicating HPLC Method for Determination of Solifenacin in Bulk Formulations. International Journal of Pharmacy and Pharmaceutical Sciences. 2011; 3(1): 70-74.
8. Desai D, Patel G. Development and Validation of Stability-Indicating HPLC Method for Solifenacin Succinate: Isolation and Identification of Major Base Degradation Product’, Acta Chromatographica. 2012; 24(3): 399–418.
9. Rao BM, Radhakrishna S. A Validated Rapid Stability-Indicating Method for the Determination of Related Substances in Solifenacin Succinate by Ultra-Fast Liquid Chromatography. Journal of Chromatographic Science. 2010; 48: 806-810.
10. Wankhede SB, Somani K. Stability Indicating Normal Phase HPTLC Method for Estimation of Alfuzosin and Solifenacin in Pharmaceutical Dosage Form. International Journal of ChemTech Research. 2011: 3(4): 2003-2010.
11. Desai D, Mehta G. Development and validation of Stability Indicating HPTLC Method of Solifenacin Succinate. Asian Journal of Pharmaceutical and Biological Research. 2011; 1(3): 310-316.
12. Biradar SP, Kalyankar TM. Stability Indicating HPLC Method Development: Review. Asian Journal of Medicinal and Analytical Chemistry.2014; 1(1): 21-26.
13. Blessy M, Patel R. Development of forced degradation and stability indicating studies of drugs—A review. Journal of Pharmaceutical Analysis. 2014; 4(3): 159–165.
14. Damle M, Kardile K. Stability Indicating UV
Spectrophotometric Method for Determination of
Dronedarone Hydrochloride. International Journal of Pharmaceutical Sciences and Drug Research 2015; 7(1): 116-119
15. International Conference on Harmonization (ICH), Stability Testing: Photostability Testing of New Drug Substances and Products, Q1B, Nov. 1996.
16. International Conference on Harmonization (ICH), Stability testing of new drug substances and products, Q1A (R2), (2003).
17. International Conference on Harmonization (2005) ICH harmonized tripartite guideline Validation of analytical procedures: text and methodology Q2 (R1) ICH, Geneva, Nov (2005).