e-ISSN: 2278-7461, p-ISSN: 2319-6491
Volume 5, Issue 5 [May. 2016] PP: 60-68
Derivative of Stress Strain,Deviatoric Undrainedcohesion Stress
And Models Based on Stress
Dr.jyothi murgan
1Mr.M.leelaramesh
2Mr.T.Naveen kumar
3 Professor, Department of Mechanical, Faculty of HITS ,Hyderabad ,India.ABSTRACT:- The deviatoric stress-strain, derivative of deviatoric stress-strain, and derivative of ratio of deviator stress to undrained cohesion behaviour of soils on three areas within Port Harcourt were carried out and their deformation trends established. The soils exhibited a nonlinear stress-strain deformation behaviour and the predicted soil modulus for the areas are generally in the range of E applicable for routine work in London clay; soils within Agip and Iriebe are identified as medium clay, except for UST soils that are within the range of medium to stiff clays. Stability magnitude of the soils increased in the order of Iriebe, Agip and UST soils, while deformation of soils response to loading were in decreasing order of Iriebe, Agip and UST soils. Soil modulus E, generally had a decreasing trend, with maximum values obtained at zero strain, but at 1.5 % strain, E values of the soils converged to about 22 MPa. For strains exceeding 1.5 %, E of soils within UST and Agip attained negative values for cell pressure of 100 kN/m2, while soils within Iriebe have positive values. Under soil pressure of 300 kN/m2, soil modulus generally reduced with increase in strain up to about 3 % strain, beyond which, E exhibited increase in value on the soils. Hence, input parameter of soil modulus, can easily be obtained from the predictive models, and can be adopted in preliminary analysis of shallow foundation deformation on cohesive soils.
Key words: Deformation, Shallow Foundation, Stability and Young’s Modulus
I.
INTRODUCTION
of evaluating incremental movement due to incremental load from additional storey in a high–rise building. Also, the unloading modulus is useful in calculating heave at bottom of excavation or rebound on pavement on removal of truck tyre load, while reload modulus is used in calculating bottom excavation movement on replacement of excavated soil or equivalent overburden. Typical values of Young’s modulus of cohesive soils are presented in Table 1.
Table 1 Young’s modulus of cohesive soils [9]
Under axi-symmetric loading, the classical elasticity model assumes elastic soil behaviour, being described by the following stress-strain matrix equation [10];
σ , , (1)
, =, , , , , ,
σ
, , , , , −μ, 1, −μ, , σ, ,
, , , −μ, −μ, 1, , , ,
Where ,
and are three dimensional stresses, and ∈ ,
∈
, ∈ are three-dimensional strains, µ is poison ratio and E is soil modulus. Under uniaxial loading,
= = 0, ∈
=∈= 0. Consequently, equation (1) becomes;
(2)
Assuming that represents the stress-strain curve, then the derivative of the stress-strain curve can be expressed as;
, , , 1, −μ, −μ, ,
-- = ∈ = E
Given that the deviator stress is − , then the slope of ( strain, can be represented as follows;
- ! − ⁄"#% &
-∈ =
Type of Soil Es (MPa)
Very Soft clay 0.5 - 5
Soft clay 5 - 21
Medium clay 21 - 53
In evaluating immediate settlement of shallow foundations placed on cohesive soils, the undrained modulus, Eu, of the supporting soil is an input parameter, but its determination is faced with constrains. Jamiolkowski et al. [11] proposed ratio of undrained modulus to undrained cohesion (Eu/cu) depending on over consolidation ratio and plasticity index. An Eu/cu ratio of 400 that is frequently used for intact blue over consolidated London clay has been proposed [12], while Padfield and Sharrock [13] proposed Eu/cu ratio of 140 for routine work in London clay. In many literatures, Eu for various soils is presented in a wide range of values with little emphasis as to whether they are secant modulus, tangent modulus, unload modulus or reload modulus [14]. However, the initial tangent modulus is mostly used to represent the stress-strain modulus of a soil because of the elastic response of soils generally observed near the origin. However, the re-load modulus has been emphasised as a better choice.Based on the difficulty of evaluating soil modulus needed in the analysis and design of foundation, an attempt is made in this paper to develop predictive models for evaluation of tangent modulus on the studied areas.
II.
2. MATERIALS AND METHODS
2.1. Acquisition and Analysis of Data
A total of eighty (80) unconsolidated undrained triaxial test results were analysed from each of the four areas studied in Port Harcourt: Agip, Iriebe and UST. The deviator stresses, induced strains, cross-sectional area, major ( and minor principal stresses were evaluated. For instance, the deviator stress ( * , is evaluated noting that the average cross-sectional area (A) of the specimen does not remain constant throughout the test. When the original cross-sectional area of the specimen is Ao and the original volume is Vo, then, for a decrease in volume of the specimen during the test, the average cross-sectional area (A) is expressed as;
A = Ao
1 − εv
(5) 1 − εa
If the volume of specimen increases during the test, then Equation (5) becomes;
A = Ao
1 + εv
(6) 1 − εa
Where εv is the volumetric strain ( v/vo), and εa is the axial strain ( l/lo). Deviator
stresses were evaluated by dividing the load with corresponding cross-sectional area of the sample.
III.
3. RESULTS AND DISCUSSION
3.1. Deviator stress - strain curve
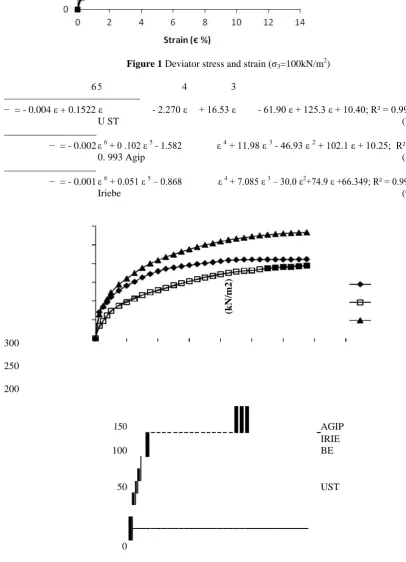
Figure 1 Deviator stress and strain (σ3=100kN/m2)
6 5 4 3 2
− = - 0.004 ε + 0.1522 ε - 2.270 ε + 16.53 ε - 61.90 ε + 125.3 ε + 10.40; R² = 0.994
− = - 0.002
U ST (7)
ε 6 + 0 .102 ε 5 - 1.582 ε 4 + 11.98 ε 3 - 46.93 ε 2 + 102.1 ε + 10.25; R² =
− = - 0.001
0. 993 Agip (8)
ε 6 + 0.051 ε 5 – 0.868 ε 4 + 7.085 ε 3 – 30.0 ε2+74.9 ε +66.349; R² = 0.996
Iriebe (9)
1
3
σ
-σ
(kN/m
2
)
300
250
200
150 AGIP
0 2 4 6 8 10 12 14 16
Strain ( σ %)
Figure 2 Deviator Stress and Strain (σ3 = 300 kN/m2) σ
σ = - 0.001 ε 6 + 0.084 ε 5 - 1.492 ε 4 + 13.00 ε 3 - 59.52 ε 2 + 153.2 ε + 15.60; R² =
0.995 UST (10)
σ
σ = - 0.001 ε 6 + 0.075 ε 5 - 1.322 ε 4 + 11.52 ε 3 - 52.85 ε 2 + 132.8 ε + 20.28;R² =
0.986 Agip (11)
σ
σ = - 0.001 ε 6 + 0.05 ε 5 - 0.891 ε 4 + 7.834 ε 3 - 35.87 ε 2 + 93.88 ε + 6.213;R² = 0.998
Iriebe (12)
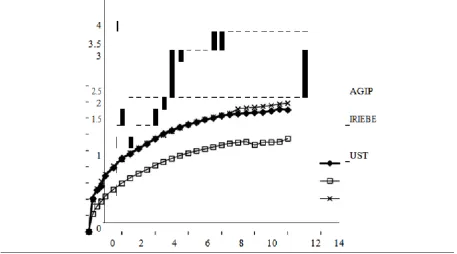
3.2. Deviator stress to Undrained cohesion, ( σ1- σ3)/cu, and Strain
Soils response in terms of the ratio of deviator stress to undrained cohesion, (σ1-σ3)/cu, and strain for cell pressure of 100 kN/m2 and 300 kN/m2 are presented in Figures 3 and 4 respectively. The deformation trend is generally non-linear with highest values found on soils within UST, and lowest on Iriebe soils, while intermediate values are found on soils within Agip. The response curves are given by equations (13–15) for cell pressures of 100 kN/m2, while equations (16–18) represent response curves of 300 kN/m2 cell pressure.
(σ1 - σ3)/cu = - 6E-05 ε 6 + 0.003 ε 5 - 0.049 ε 4 + 0.374 ε 3 - 1.447 ε 2 + 2.924 ε; R² = 0.990 UST (13) (σ1 - σ3)/cu = - 6E-05 ε 6 + 0.002 ε 5 - 0.036 ε 4 + 0.272 ε 3 - 1.065 ε 2 + 2.318 ε + 0.231;R² = , , , , , 0.993, Agip, (14)
(σ1 - σ3)/cu = - 2E-05, ε 6, + 0.001 ε 5, - 0.016 ε 4, + 0.134 ε 3, - 0.572 ε 2 + 1.431 ε + 0.117; R² = , , , , , 0.996, Iriebe, , (15)
(σ1 - σ3)/cu = -5E-05, ε 6, + 0.002 ε 5, - 0.034 ε 4, + 0.292 ε 3, - 1.291 ε 2, + 3.206 ε + 0.303; R² = , , , , 0.995, UST, , , (16)
(σ1 - σ3)/cu = -5E-05, ε 6, + 0.002 ε 5, - 0.035 ε 4, + 0.294 ε 3, - 1.290 ε 2, + 3.109 ε + 0.443; R² = , , , , 0.986, Agip, , , (17)
Strain ( σ %)
Figure 4 Deviator Stress to Undrained cohesion and Strain (σ3 = 300 kN/m2)
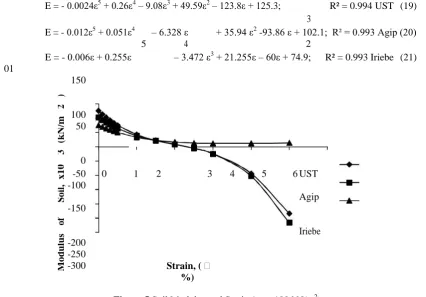
3.3. Soil Modulus
The slope of stress-strain curves of equations (7- 9) are presented in equations (19– 21) while the variation of soil modulus E, with strain for cell pressure of 100 kN/m2 is presented in Figure 5. Soil modulus E, generally had a decreasing trend, with maximum values obtained at zero strain; soils within UST had highest values, for cell pressure of 100 kN/m2 while soils within Iriebe had lowest E. But at 1.5 % strain, E values of the soils converged to about 22 MPa. For strains exceeding 1.5 %, soil modulus of soils within UST and Agip attained negative values for cell pressure of 100 kN/m2, while soils within Iriebe have positive values. Under soil pressure of 300 kN/m2, the rate of change of stress with strain, expressed by soil modulus is presented in equations (22–24) and depicted in Figure 6. It is noticed that soil modulus generally decreased with increase in strain up to about 3 % strain, beyond which E exhibited increase in value on the soils.
E = - 0.0024ε5 + 0.26ε4 – 9.08ε3 + 49.59ε2 – 123.8ε + 125.3; R² = 0.994 UST (19)
E = - 0.012ε5 + 0.051ε4
3
– 6.328 ε + 35.94 ε2 -93.86 ε + 102.1; R² = 0.993 Agip (20)
5 4 2
E = - 0.006ε + 0.255ε – 3.472 ε3 + 21.255ε – 60ε + 74.9; R² = 0.993 Iriebe (21) 01
)
150
2
(kN/m
100 50
3
0
E x10 -50 0 1 2 3 4 5 6 UST
S
o
il
, -100
E = - 0.006ε5 + 0.420ε4 – 5.968ε3
(22)
E = - 0.006ε5 + 0.375ε4 – 5.288
ε3 + 34.56ε 2
– 105.7ε + 132.8; R² = 0.986
Agip (23) E = -0.006ε5 + 0.2 5ε4– 3.56ε3 + 23.50ε2 –71.74ε + 93.88; R²=0.998
Iriebe (24)
Figure 6 Variation of Modulus with Strain (σ3 = 300 kN/m2)
3.4. Model Verification 3.4.1. SOIL MODULUS
Evaluation of tangent mo dulus of the soils at 1 % strain level for cell p ressures of 100 kN/m2 and 300 kN/m2 based on deviator stress-strain models of equations (7–9) and (10–12) respectively are shown in Table 2. The soil modulus are g enerally in the range of E, identified as medium clay soils, except for UST soils that are in the range of medium to stiff clay. From the derivatives of the deviator stress-strain models of
equations (19–21) and (22–24), the soil modulus at 1% strain level are presented in Table 3. Agip and Iriebe soils gave E values commonly described as medium clays, while those within UST had E associated with medium to stiff clays.
Table 2 Model verification of soil modulus (Stress-strain models)
LOCATION
Predicted Tangent Modulus E from field values (MPa)
E (MPa) Clay soil Range
UST 50–69 Very soft 0.5 - 5
Agip 38–65 Soft 5 - 21
Iriebe 33–51 Medium 21 - 53
Stiff clay, Silty clay 53 - 107
Table 3 Model verification of soil modulus) Predicted Tangent E from field values (MPa)
LOCATION Modulus
Clay soil Range
UST 53–85 Very soft 0.5 - 5
Agip 24–25 Soft 5 - 21
Iriebe 42–105 Medium 21 - 53 Stiff clay, Silty clay 53 - 107
3.4.2. STRESS TO UNDRAINED COHESION, (σ1-σ3)/CU AND STRAIN
The predicted values of E/cu based on the ratio of the derivative of deviator stress to undrained cohesion, (σ1 -σ3)/cu, to strain for cell pressure of 100 kN/m2 and 300 kN/m2 at strain level of 1% is presented in Table 4. Generally the E/cu values for the areas, is representative of the value used for routine work in London clay, but lower than reported field value frequently used for over consolidated intact blue London clay.
Table 4 Model verification of -+- (σ1- σ3)/cu) and strain
Location
Predicted E/cu Field values of E/cu
Clay soil Application
UST 130
140 Routine work in London clay
Agip 130
Iriebe 100
400
Frequently used for intact blue
over consolidated London clay
IV.
CONCLUSION
The soils exhibited a nonlinear stress-strain deformation behaviour and the predicted soil modulus for the areas are generally in the range of E applicable for routine work in London clay. Soils within Agip and Iriebe are identified as medium clay soils, except for UST soils that are within the range of medium to stiff clays. Based on the derivatives of the deviator stress-strain models, Agip and Iriebe soils gave E values commonly described as medium clays, while those within UST had E associated withmedium to stiff clays. Results of E obtained from the stress-strain models generally gave E values similar to those obtained from the derivatives of the deviator stress-stress to undrained cohesion, -+ (σ1- σ3)/cu), at strain level of 1 %, generally gavevalues used for routine work in London clay. Hence, input parameter of soil modulus, can easily be obtained within the study area from their respective predictive models, which can easily be adopted in preliminary analysis of shallow foundation deformation on cohesive soils.
REFERENCES
[1] Skempton, A. W. The Bearing Capacity of Clays, Building Research Congress, 1951.
[2] G. N. Smith, Elements of Soil Mechanics for Civil and Mining Engineers, 5th Edition, U. K.: Billing and Sons Ltd, , 1982, pp. 348–349.
[3] Geotechdata.info, Soils young’s modulus, http://geotechdata.info/parameters/soil-elastic-young-modulus.html, September 17.09, 2013.
[4] Akpila, S. B. and Omunguye, I. W. Soil Modulus and Undrained Cohesion of Clayey Soils from Stress−Strain Models. Canadian Journal of Pure and AppliedSciences,8(3), 2014, pp. 3155–3161. [5] Akpila, S. B. Predictive Approach on Evaluation of Settlement Parameters on Clayey Soils in Parts of
Port Harcourt. Scientific Journal of Pure and AppliedSciences,2(2), 2013, pp. 66–71.
[12] Butler, F. G.Review Paper: Heavily Over-consolidated Clays, in Proceedings of the Conference on Settlement of Structures. Cambridge: Pentech Press, 1974, pp. 531–578.
[13] Padfield, C. J. and Sharrock, M. J. Settlement of Structures on Clay Soils, Construction Industry Research and Information Association, Special Pub. 1983, pp. 27.
[14] Bowles, J. E. Foundation Analysis and Design, 5th Edition. MacGraw-Hill International Editions, 1997, pp. 125.
![Table 1 Young’s modulus of cohesive soils [9]](https://thumb-us.123doks.com/thumbv2/123dok_us/1364124.1645811/2.595.73.525.297.441/table-young-s-modulus-cohesive-soils.webp)