53
Study of Frequency Selective Surfaces
on Radar Cross Section Reduction
M.Y. Ismail1,* andN. A. N. M. Shamsani 1
1Faculty of Electrical and Electronic Engineering, Universiti Tun Hussein Onn Malaysia.
*Corresponding email : [email protected]
Abstract
With recent technology in radar cross section reduction (RCSR), a periodic array of frequency selective surfaces (FSSs) which exploits a non-metallic ground plane and slot embedded in the patch elements have been presented. In this study, the single layer FSSs with different incidence angles and substrate thicknesses have been investigated and simulated at the X-band frequency range using CST computer model. Based on the FSSs
design, the minimum reflection response is shown to be -74.68 dB while the minimum
RCS is -5577 dBm2 occurred at the incidence angle which is equal to 75 degree. Moreover, the maximum value of RCS at -4417 dBm2 has been observed when the incident wave and observer is located at the 0 degree which is offers maximum RCS reduction. Analysis of the CST computer model has been integrated with MATLAB 7 to show the reliability of
the two computer model in order to study the feasibility of reflection response in reducing
RCS. RCS calculations have been carried out using MATLAB 7 computer model in order
to investigate the performance of minimum reflection response which offers reduction in
RCS. From the simulated results, it can be concluded that, 75 degree’s incidence angles offered the best performance on RCS reduction due to the angles of incidence, minimum
reflection response and lower surface current distribution.
Keywords: Angle of incidence , Frequency Selective Surfaces, radar cross section,
International Journal of Integrated Engineering (Issue on Electrical and Electronic Engineering)
54
1. INTRODUCTIONThe use of the radar cross section reduction, RCSR [1] is one of the techniques that can reduce radar cross section, RCS. The most common technique that had been used is shaping of the periodic structure [2]. Although the shaping of the periodic structure can be used to reduce the RCS by minimizing the area presented of the radar
but it also has significant disadvantages.
In this study, frequency selective surfaces, FSS are proposed in order to minimize the radar cross section which can offer a
significant improvement in the radar cross
section technology. The structure of the frequency selective surface consists of the periodic array of dipole slots with the non-metallic ground plane [3]. By applying FSS
technique, the transmission and reflection
properties of FSS array can be achieved and the possibility of reducing radar cross section has been investigated. The main objectives of this study are to minimize the radar cross section by applying frequency selective surface technique and to observe the relationship between the angle of
incidence and the transmission/reflection coefficient due to radar cross section
reduction.
While varying the incidence angles, there have the change in frequency and
reflection/transmission plot. As the
incidence angles increased, the resonance frequency has been increased and transmitted signal is getting higher. Based
on the value of reflection/transmission
properties, the radar cross section has been calculated using equation 1.1 [4]:
2. FSS DESIGN SPECIFICATIONS
International Journal of Integrated Engineering (Issue on Electrical and Electronic Engineering)
55
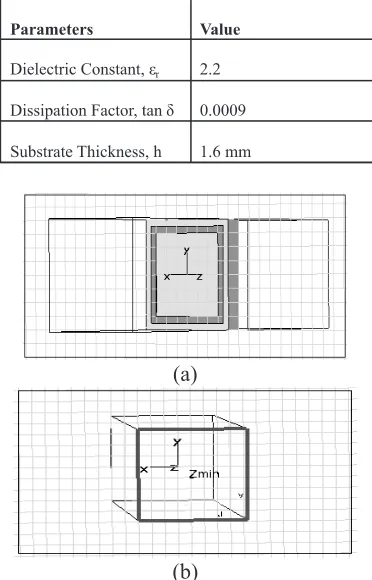
Fig. 2.2 Geometry structure of the frequencyselective surface using (a) CST Microwave Studio (c) Zmin port excitation (c) Zmax port
excitation (d) theoretical design.
A single layer FSS array as shown in Fig. 2.2 (a) has been simulated in the CST Computer Software at the X-Band frequency range. The FSS array has been designed using Rogers RT5880 as the substrate materials which dielectric constant is 2.2 and the dissipation factor is 0.0009. With the dimensions of the substrate elements is 4 mm length and 4 mm width, patch element is 3.5 mm length and 3.5 mm width and the slot element is 3 mm length and 3 mm width, the FSS array has been simulated in order to obtain the
minimum reflection.
Table 2.2 : Design Specifications of Frequency
Selective Surfaces.
Fig. 2.3 Flow of the FSS array study on the RCS Reduction.
Fig. 2.4: (a) Surface current distribution (b)
E-field intensity on the patch elements at theta =
75 degree
(a) (b)
Fig. 2.2 (b) and (c) shows the Zmin and Zmax port excitation during the
simulation on the reflection/transmission response. Minimum reflection was excited
from port Zmin to port Zmax while maximum transmission was excited from port Zmax to port Zmax. The FSS array design has been integrated to reduce the
radar cross section as shown in fig. 2.3. 3. RESULTS & ANALYSIS
International Journal of Integrated Engineering (Issue on Electrical and Electronic Engineering)
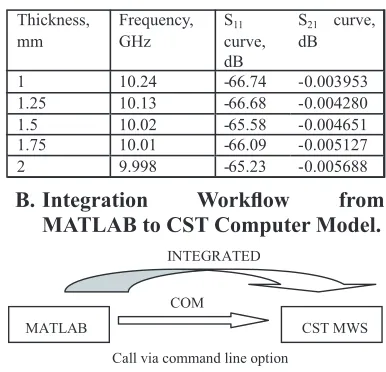
Fig. 3.1: Simulated Result of the (a) Reflection
and (b) Transmission Response by varying Angles of Incidence.
In this study, simulated results have been
carried out using the CST computer
software which gives better performance
on simulating the FSS array. Fig. 3.1 (a)
and (b) shows the performance of the
reflection/transmission and resonance
frequency as the incidence angles have
been varied from 0 to 75 degrees. The
change in resonant frequency occurred
because of the resonance frequency is
not strongly dependent on the angles of
incidence [5].
Table 3.1: Simulated Value of the Resonant
Frequency and S11 and S21 curve by varying the Incidence Angles.
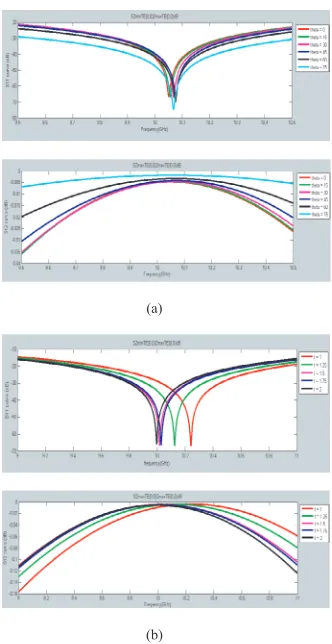
Fig. 3.2 Reflection and Transmission Response
of the FSS array for Different Substrate Thicknesses.
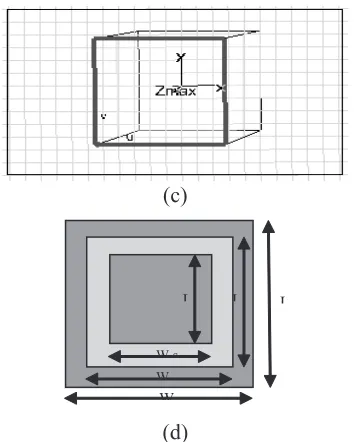
Both of Fig. 3.2 (a) and (b) are the simulation results that had been carried out from the CST computer model using different thickness of the substrate material [7]. Substrate thicknesses are indeed an important consideration in designing the FSS array.
Table 3.2: Simulated Value of the Resonant
Frequency, S11 and S21 curve using Different
Substrate Thicknesses A. Effect of Variable Thickness Substrate to the performance of Transmission and Reflection Response.
B. Integration Workflow from MATLAB to CST Computer Model.
Fig. 3.3: Integration Workflow between MATLAB
57
Fig. 3.3 shows the workflow howthe interface between MATLAB and CST computer model has been done using command line option in the MATLAB. The command line writing in the M-File Editor has been called the CST computer model and the interfaces between both of the computer model have been successes. By using the Computer Object Model (COM), it enables the interaction between MATLAB and CST computer software. The main command that had been used to call the CST computer model is actxserver
and this command act to create the COM server and returns the COM object. The object that is return by the actxserver is the CST computer model. In the CST computer
model, the transmission/reflection plots
have been displayed.
C. Integration Workflow from CST Computer Software to MATLAB.
Fig. 3.4: Flow of the integration between CST MWS and MATLAB.
Fig. 3.4 above shows the
integration workflow in order to get the transmission and reflection response in
the MATLAB. From the CST MWS,
the transmission and reflection response
were exported using the ASCII code to the EXCEL computer software. From EXCEL computer software, by using the
load command written in the MATLAB’s M-File Editor, the data in the EXCEL computer software have been call and
the transmission and reflection plot have
been displayed in the MATLAB computer software. Fig. 3.5 (a) show the transmission
and reflection response when the incidence
angle had been varied while Fig. 3.5 (b)
showed the transmission and reflection
plot for different substrate thickness. It
shows that the reflection and transmission
plots observed in the MATLAB computer software were quite similar with the CST computer software.
From fig. 3.6 (a) and (b), the
results show that the value of the resonant
frequency and reflection response at the 75
degree’s incidence angles is quite similar between each other. From the CST MWS, the resonance frequency is equal to 10.068 GHz while from the MATLAB 7 the resonance frequency is equal to 10.07.
Fig. 3.5 (a) Reflection and Transmission plot by
varying the Incidence Angles (b) Transmission and
Reflection plot for Different Substrate Thicknesses
International Journal of Integrated Engineering (Issue on Electrical and Electronic Engineering)
D. Comparison on Reflection Response using CST MWS and MATLAB.
For the reflection plot, the value
that has been carried out from CST MWS is equal to -74.68 dB while from MATLAB 7 is equal to -74.68 dB. From the results above, it shows that, CST MWS can be integrating between MATLAB in order to
get the transmission/reflection response of
the FSSs design.
Fig. 3.6: Reflection Response for theta = 75
degree using (a) CST MWS and (b) MATLAB 7.
E. Radar Cross Section Reduction. i) Effect of Different Incidence Angles
on the Radar Cross Section.
Fig. 3.7: Plot of radar cross section based on different angles of incidence.
Radar cross section is dependent on the direction where the energy is illuminates. And it has been proved based on the simulated results that, the RCS value is maximized when the angle of incidence is equal to zero degree.
Table 3.3: Calculated value of RCS using MATLAB computer software.
59
minimum value of RCS from the minimumvalue of reflection response. Therefore, in
order to reduce the RCS, the incident signal must be transmitted at the oblique angles of incidence which were equal to 15o, 30o,45o, 60o and 75o. The best performance in reducing RCS occurred at 75 degree’s incidence angles.
F. Effect of Different Substrate
Thicknesses on the Radar Cross Section.
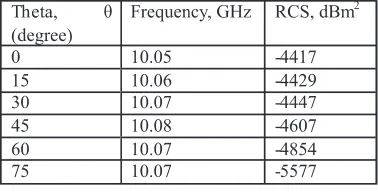
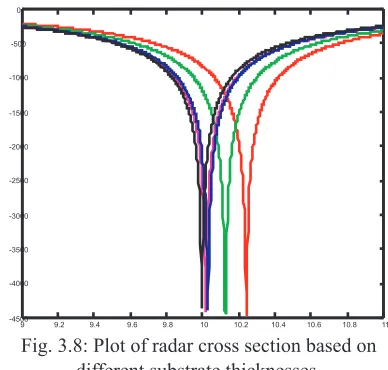
Fig. 3.8: Plot of radar cross section based on different substrate thicknesses.
Fig. 3.8 and Table 3.4 show the simulated results based on the MATLAB’s calculation. From the results above, it can be concluded that, the value of RCS is not really dependent on the substrate thickness.
Table 3.4: Calculated value of RCS by using MATLAB computer model.
The RCS’s value is not stable due the change of the substrate thickness. Due to the theoretical study, the RCS is dependent on the shape, material composition, size of the body and frequency of the incident electromagnetic wave [10].
4. CONCLUSION
In this study, design of frequency selective surfaces, FSS with analysis the different angles of incidence and thickness have been demonstrated using CST computer model in order to reduce the RCS. The interfaces between MATLAB and CST computer model have been developed to see the reliability of the two computer models.
Based on the transmission and reflection
responses for different incidence angles and substrate thicknesses, the minimized values of RCS have been presented. There are limitations due to computer model while doing the integration between CST 2009 and MATLAB 7.
ACKNOLEDGEMENT
Thanks to technical help from RF and Microwave Laboratories during the implementation of the project.
REFERENCES
[1] David C.Jenn.Naval Postgraduate School. “Radar Cross Section.” RF and Microwave Encyclopedia.
Volume 5. MC Graw Hill. pp. 4036. [2] David C.Jenn.Naval Postgraduate
School. “Radar Cross Section.” RF and Microwave Encyclopedia.
Volume 5. MC Graw Hill. pp.
4036-4037.
International Journal of Integrated Engineering (Issue on Electrical and Electronic Engineering)
Yusof Ismail, Vincent Fusco, David
Linton, Norman Grant, Simon Rea. ‘‘Liquid Crystal Tunable mm Wave Frequency Selective Surface’’, IEEE MICROWAVE AND WIRELESS
COMPONENTS LETTERS, Vol. 17,
No. 9, Sepetember 2007. pp. 667-669.
[4] Annapurna Das, Sisir K Das (2001). “Microwave Engineering” MC Graw Hill. pp. 507-509.
[5] Kamal Sarabandi and Nader Behdad “A Frequency Selective Surfaces with Miniaturized Elements”, IEEE TRANSACTIONS OF ANTENNAS
AND PROPAGATIONS, Vol. 55, No.
5, May 2007. pp. 1239-1245.
[6] Ghaffer I.Kiani, Kenneth L.Ford, Karu P.Esselle, Andrew R.Wiley, and Chinthana J. Panagamuwa “Oblique Incidence Performance of a Novel Frequency Selective Surface Absorber”, IEEE TRANSACTIONS OF
ANTENNAS AND PROPAGATIONS,
Vol. 55, No. 10, October 2007. pp.
2931-2934.
[7] Guo Qing Luo, Wei Hong, Zhang-Cheng Hao, Bing Liu, Wei Dong Li, Ji Xin Chen, Hou Xing Zhou and Ken Wu “ Theory and Experiment of Novel Frequency Selective Surface based on Substrate Integrated Waveguide Technology”, IEEE TRANSACTIONS OF ANTENNAS
AND PROPAGATIONS, Vol. 53, No.
12, December 2005. pp. 4035-4043. [8] Annapurna Das, Sisir K Das (2001).
“Microwave Engineering” MC Graw Hill. pp. 63-64.
[9] David C.Jenn.Naval Postgraduate School. “Radar Cross Section.” RF and Microwave Encyclopedia.
Volume 5. MC Graw Hill. pp. 4036.
[10] David C.Jenn.Naval Postgraduate School. “Radar Cross Section.” RF and Microwave Encyclopedia.