February, 22nd and 23rd, 2019
335 | P a g e
A Review on: Implementation of Wireless Farming using IOT
Miss. Shradha P. Rachcha Department of Electronics & Telecommunication
Vishwabharati Academy COE Sarola Baddi, Ahmednagar [email protected]
Prof.Atul Srivastav
Department of Electronics & Telecommunication Vishwabharati Academy COE
Sarola Baddi, Ahmednagar [email protected]
Abstract— As we know there are many issues surrounding our agriculture sector today lack of proper technology has caused a decline in production in the recent years. As in other countries we see that there is much technological advancement that has helped in the increase in Production. IoT is one of the technologies that can make a very large on impact on the agriculture sector. IoT stands for Internet of things it means that things will be connected to the internet and communicate with each other. In our system we have designed a system that can monitor parameters like temperature, humidity, Gas levels, Light detection etc. all this parameters will be monitored locally; our system will be connected to the internet via a Wi-Fi module. All the data that has been collected by the system than will be uploaded to the server where it will be displayed using graphs and will be available for analysis.
Keywords—ArduinoUno,SoilSensor,Wi-FiModule,Temperature & Humindity Sensor,Level Sonsor.
I.INTRODUCTION
1.1 Importance of Agriculture:
During Independence there was extremely low productivity per hectare and per worker. However, the previous trend of stagnant agriculture was completely changed due to the introduction of economic planning since 1950-51, and with special emphasis on agricultural development, particularly after 1962.
(i) A steady increase in the area under cultivation is noticed. (ii) A substantial growth in the food crops is marked.
(iii) During the plan period there had been a constant increase in the yield per hectare.
Importance of Agriculture in Indian Economy:
Though industry has been playing an important role in Indian economy, still the contribution of agriculture in the development of Indian economy cannot be denied.
This can be measured and gauged by the following facts and figures:
1. Agricultural influence on national income:
The contribution of agriculture during the first two decades towards the gross domestic product ranged between 48 and 60%. In the year 2001-2002, this contribution declined to only about 26%.
2. Agriculture plays vital role in generating employment: In India at least two-thirds of the working population earn their living through agricultural works. In India other sectors have failed generate much of employment opportunity the growing working populations.
3. Agriculture makes provision for food for the ever increasing population:
Due to the excessive pressure of population labour surplus economies like India and rapid increase in the demand for food, food production increases at a fast rate. The existing levels of food consumption in these countries are very low and with a little increase in the capita income, the demand for food
rise steeply (in other words it can be stated that the income elasticity of demand for food is very high in developing countries). Therefore, unless agriculture is able to continuously increase it marketed surplus of food grains, a crisis is like to emerge. Many developing countries are passing through this phase and in a bid to ma the increasing food requirements agriculture has been developed.
4. Contribution to capital formation:
There is general agreement on the necessity capital formation. Since agriculture happens be the largest industry in developing country like India, it can and must play an important role in pushing up the rate of capital formation. If it fails to do so, the whole process economic development will suffer a setback. To extract surplus from agriculture the following policies are taken:
(i) Transfer of labour and capital from farm non-farm activities.
(ii) Taxation of agriculture should be in such a way that the burden on agriculture is greater than the government services provided to agriculture. Therefore, generation of surplus from agriculture will ultimately depend on increasing the agricultural productivity considerably.
5. Supply of raw material to agro-based industries:
Agriculture supplies raw materials to various agro-based industries like sugar, jute, cotton textile and vanaspati industries. Food processing industries are similarly dependent on agriculture. Therefore the development of these industries entirely is dependent on agriculture.
6. Market for industrial products:
Increase in rural purchasing power is very necessary for industrial development as two- thirds of Indian population live in villages. After green revolution the purchasing power of the large farmers increased due to their enhanced income and negligible tax burden.
7. Influence on internal and external trade and commerce: Indian agriculture plays a vital role in internal and external trade of the country. Internal trade in food-grains and other agricultural products helps in the expansion of service sector. 8. Contribution in government budget:
Right from the First Five Year Plan agriculture is considered as the prime revenue collecting sector for the both central and state budgets. However, the governments earn huge revenue from agriculture and its allied activities like cattle rearing, animal husbandry, poultry farming, fishing etc. Indian railway along with the state transport system also earn a handsome revenue as freight charges for agricultural products,both-semi finished and finished ones.
February, 22nd and 23rd, 2019
336 | P a g e Indian agriculture has a cost advantage in several agricultural
commodities in the export sector because of low labour costs and self- sufficiency in input supply.
II.LITERATURE SURVEY
1. GREENHOUSE CONTROLLING SYSTEM USING GSM Yash Soni & Kalgi Trivedi Guided by- Asst. Prof. Bhagirathi Dodiya. International Journal of Engineering Research and General Science Volume 4, Issue 5, September-October, 2016 ISSN 2091-2730
The system proposed in this project is Green House which is a smart technology to provide plants and trees the required nourishment from the sunlight and to prevent the same from the harmful effects. Therefore this project focuses on developing a system that can automatically monitor and predict changes of temperature, light, humidity and soil moisture in the greenhouse. The objective of the research is to develop an automatic control and monitoring system using sensors and Short Message Service (SMS) technology. This proposed system also has a mechanism to alert farmers regarding the parameter changes in the greenhouse so that early precaution steps can be taken. System components used are Humidity sensor, Temperature sensor, soil moisture sensor, light sensor, Transistor switches, relay nodes for automatic control, Microcontroller to control greenhouse information. To make this more efficient a GSM has been linked with the system.
2. A WIRELESS SENSOR NETWORK FOR POLYHOUSE CULTIVATION USING ZIGBEE TECHNOLOGY Prathiba Jonnala and G. S. R. Sathyanarayana ARPN Journal of Engineering and Applied Sciences 2006-2015 Asian Research Publishing Network (ARPN).
The required climatic conditions for the polyhouse cultivation can be provided by using this proposed technique. The Zigbee technology has used for implementing the proposed wireless network. Few of the surrounding parameters of ambient temperature, humidity percentage, light intensity range and soil moisture content inside polyhouse are controlled and optimum conditions for crop growth inside polyhouse can be provided with the proposed model using abrupt actuators used. This model has developed with the mesh topology consists various nodes which are deployed inside polyhouse and are controlled by one central monitoring unit (CMU). Based on the crop the threshold values for the sensors and control values for the actuators during day time and night time are programmed in the CMU and it continuously receives the sensors data from all the nodes, and with respect to the programmed values of crop the CMU sends the controlling data to the actuator node for maintaining constant and required environmental conditions. By using this proposed model the necessity of human effort can be reduced and also the suitable weather conditions for the crop production irrespective of the season can be provided for the maximum beneficiary to the farmer.
3. Environment Monitoring and Control of a Polyhouse Farm through Internet Yogesh R. Sonawane a , Sameer Khandekar a *, Bipin Kumar Mishra a , K. K. Soundra Pandian b
Control and monitoring of environmental parameters inside a Polyhouse farm, so as to ensure continuous maintenance of favorable crop atmosphere is the objective of the work
presented in this paper. The objective is achieved through the use of internet based technology. The system is also expandable to be integrated with mobile telephony. The concept encompasses data acquisition of thermal process parameters through a sensor network, data storage, post processing and online transmission of data to multiple users logged on to their respective web-browsers. Further, control of process parameters of a Polyhouse (for example, toggle on/off control of pumps and accessories, louvers and ventilators, air flow rate, sunlight management, etc.) from one or more remote monitoring stations over the web server in real time is also integrated. A graphical user interface (GUI) is unified for the ease of operations by the farming community. System also allows transmission of process parameters, including emergency alarm signals via e-mail client server or alternatively sending a SMS on a mobile phone. A conventional chat has also been integrated with the GUI to add vibrancy to inter-user communication. This feature can be embedded in upcoming 3G mobile technology. Simulations and video tutorials can also be integrated in the web server for teaching the farming community. Such integrated approach greatly widens the socio-economic possibilities for farmers through interaction with modern technological resources.
III.SYSTEM DEVELOPMENT
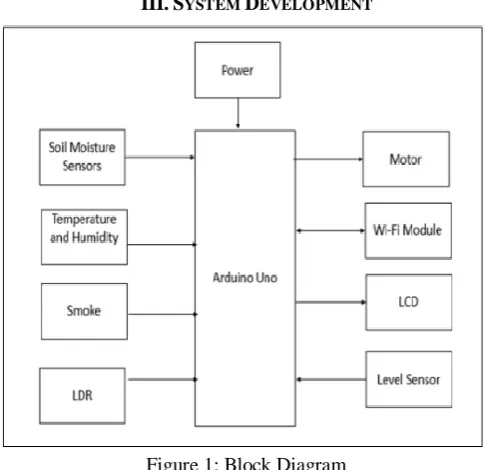
Figure 1: Block Diagram
The Block Diagram consists of two sides one is the input side and the other is the output side. The input side consist of the input from the sensors and the output side consist of motors. There are sensors that will measure smoke, Temperature, Humidity, Soil Moisture and water level. All the input will be collected from the sensor by the controller that is at AT mega 328 which is present on the Arduino Uno Board.
MQ135 sensor will be used to measure the air quality, DHT11 is used to measure the Temperature and the humidity of the surrounding, and ultrasonic sensors will be used to measure the level of the water.
The motor will be controlled on the basis of the moisture level of the soil which will be measured using the soil moisture sensor.
February, 22nd and 23rd, 2019
337 | P a g e module will connect the Arduino Uno to the internet that will
allow us to upload our data on the cloud.
1.Hardware Requirement:
A. Arduino Uno:
Microcontroller Atmega:328 Operating Voltage:5V
Input Voltage (recommended):7-12V Input Voltage (limit): 6-20V
Digital I/O Pins : 14 (of which 6 provide PWM output) PWM Digital I/O Pins
Analog Input Pins 6
DC Current per I/O Pin :40 mA DC Current for 3.3V Pin :50 mA
Flash Memory :32 KB (ATmega328P) of which 0.5 KB used by bootloader
SRAM :2 KB (ATmega328) EEPROM :1 KB (ATmega328P) Clock Speed :16 MHz
B. Soil Moisture:
This is an easy to use digital soil moisture sensor. Just insert the sensor in the soil and it can can measure moisture or water level content in it. It gives a digital output of 5V when moisture level is high and 0V when the moisture level is low in the soil.
Figure 2 : Moisture sensor
C. LCD (Liquid Crystal Display):
LCD (Liquid Crystal Display) is a flat panel display, electronic visual display, or video display that uses the light modulating properties of liquid crystals. Liquid crystals do not emit light directly. Our project uses the 16x2 LCD display.16x2 LCD display is very basic module and is very commonly used in various device and circuits. These modules are preferred over seven segments and other multi segment LEDs. The reasons being, LCDs are economical, easily programmable have no limitation of displaying special and even custom characters.
Figure 3: Liquid Crystal Display (16x2 LCD)
D. Ultrasonic sensor:
An Ultrasonic sensor is a device that can measure the distance to an object by using sound waves. It measures distance by sending out a sound wave at a specific frequency and listening for that sound wave to bounce back. By recording the elapsed time between the sound wave being generated and the sound wave bouncing back, it is possible to calculate the distance between the sonar sensor and the object. Since it is known that sound travels through air at about 344 m/s (1129 ft/s), you can take the time for the sound wave to return and multiply it by 344 meters (or 1129 feet) to find the total round-trip distance of the sound wave. Round-trip means that the sound wave traveled 2 times the distance to the object before it was detected by the sensor; it includes the ’trip’ from the sonar sensor to the object AND the ’trip’ from the object to the Ultrasonic sensor (after the sound wave bounced off the object). To find the distance to the object, simply divide the round-trip distance in half. The distance can be calculated with the following formula: Distance L = 1/2 ∗ T ∗ C
where L is the distance, T is the time between the emission and reception, and
C is the sonic speed. (The value is multiplied by 1/2 because T is the time for go-and-return distance.)
Figure 4 : Ultrasonic sensor
E. DHT11:
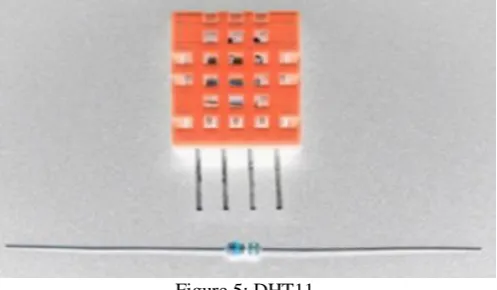
The DHT11 is a basic, ultra low-cost digital temperature and humidity sensor. It uses a capacitive humidity sensor and a thermistor to measure the surrounding air, and spits out a digital signal on the data pin (no analog input pins needed). Its fairly simple to use, but requires careful timing to grab data. The only real downside of this sensor is you can only get new data from it once every 2 seconds, so when using our library, sensor readings can be up to 2 seconds old.
Figure 5: DHT11 FEATURES
• Low cost
• 3 to 5V power and I/O
• 2.5mA max current use during conversion (while requesting data)
• Good for 20-80% humidity readings with 5% accuracy • Good for 0-50C temperature readings ±2C accuracy • No more than 1 Hz sampling rate (once every second) • Body size 15.5mm ∗ 12mm ∗ 5.5mm
February, 22nd and 23rd, 2019
338 | P a g e
F. Wi-Fi Module:
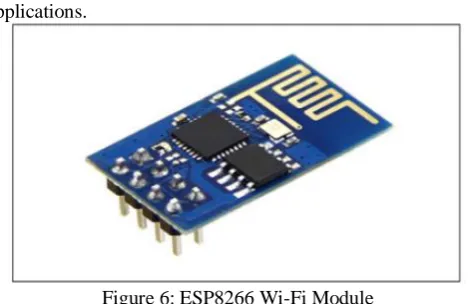
ESP8266 is Wi-Fi enabled system on chip (SoC) module developed by Espressif sys- tem. It is mostly used for development of IoT (Internet of Things) embedded applications.
Figure 6: ESP8266 Wi-Fi Module
ESP8266 comes with capabilities of 2.4 GHz Wi-Fi (802.11 b/g/n, supporting WPA/WPA2), general-purpose input/output (16 GPIO), Inter-Integrated Circuit (IC) serial communication protocol, analog-to-digital conversion (10-bit ADC)
Serial Peripheral Interface (SPI) serial communication protocol, IS (Inter-IC Sound) interfaces with DMA(Direct Memory Access) (sharing pins with GPIO), UART (on dedicated pins, plus a transmit-only UART can be enabled on GPIO2)
G. Pulse-width modulation (PWM):
It employs a 32-bit RISC CPU based on the TensilicaXtensa L106 running at 80 MHz (or overclocked to 160 MHz). It has a 64 KB boot ROM, 64 KB instruction RAM and 96 KB data RAM. External flash memory can be accessed through SPI. ESP8266 module is low cost standalone wireless transceiver that can be used for end-point IoT developments. To communicate with the ESP8266 module, microcontroller needs to use set of AT commands. Microcontroller communicates with ESP8266-01 module using UART having specified Baud rate. There are many third-party manufacturers that produce different modules based on this chip. So, the module comes with different pin availability options like, ESP-01 comes with 8 pins (2 GPIO pins) PCB trace antenna. ESP-02 comes with 8 pins, (3 GPIO pins) U-FL antenna connector. ESP-03 comes with 14 pins, (7 GPIO pins) Ceramic antenna. ESP-04 comes with 14 pins, (7 GPIO pins) No ant. etc.
2. Software design:
A. Proteus 8:
The Proteus Design Suite is a proprietary software tool suite used primarily for electronic design automation. The software is used mainly by electronic design engineers and electronic technicians to create electronic schematics and electronic prints for manufacturing printed circuit boards. We have used it for circuit diagram and simulation.
2. Arduino IDE :
Arduino is an open-source hardware and software company, project and user community that designs and manufactures single-board microcontrollers and microcontroller kits for
building digital devices and interactive objects that can sense and control objects in the physical and digital world. Its products are licensed under the GNU Lesser General Public License (LGPL) or the GNU General Public License (GPL),permitting the manufacture of Arduino boards and software distribution by anyone.
Arduino boards are available commercially in preassembled form or as do-it-yourself (DIY) kits. Arduino board designs use a variety of microprocessors and controllers.
The boards are equipped with sets of digital and analog input/output (I/O) pins that may be interfaced to various expansion boards or breadboards (shields) and other circuits. The boards feature serial communications interfaces, including Universal Serial Bus (USB) on some models, which are also used for loading programs from personal computers. The microcontrollers are typically programmed using a dialect of features from the programming languages C and C++. In addition to using traditional compiler toolchains, the Arduino project provides an integrated development environment (IDE) based on the Processing language project. The Arduino project started in 2003 as a program for students at the Interaction Design Institute Ivrea in Ivrea, Italy,aiming to provide a low-cost and easy way for novices and professionals to create devices that interact with their environment using sensors and actuators. Common examples of such devices intended for beginner hobbyists include simple robots, thermostats and motion detectors. The name Arduino comes from a bar in Ivrea, Italy, where some of the founders of the project used to meet. The bar was named after Arduin of Ivrea, who was the margrave of the March of Ivrea and King of Italy from 1002 to 1014.
IV.ADVANTAGES
• Low design time. • Low production cost.
• This system is applicable for both the indoor and • Outdoor environment.
• Setting the destination is very easy. • Less space.
• Low power consumption.
V.APPLICATIONS
• Smart farming. • Wireless farming. • Agriculture Automation
VI.CONCLUSION
Hence we conclude that we have discussed all the hardware that is required for our project, for measuring temperature, moisture, humidity etc. we all also discussed the software that we will be using for our project. Also we have discussed the flow and the algorithm that we will be using for our project.
References
February, 22nd and 23rd, 2019
339 | P a g e [2] A WIRELESS SENSOR NETWORK FOR POLYHOUSE
CULTIVATION USING ZIGBEE TECHNOLOGY Prathiba Jonnala and G. S. R. Sathyanarayana
[3] Environment Monitoring and Control of a Polyhouse Farm through Internet Yogesh R. Sonawane a , Sameer Khandekar a *, Bipin Kumar Mishra a , K. K.Soundra P
[4] Smart Poly-House Surveillance Using IOE Vaibhav Sherkar1, Akshay Surwase2, Prasad Kalekar3, Bhagyashree Gavhane International Research Journal of Engineering and Technology (IRJET) e-ISSN: 2395 [5] Ji-chun Zhao, Jun-feng Zhang; Yu Feng, JianxinGuo (2010) The Study
and Application of thelOT Technology in Agriculture,978-1-4244-5540 9/10 2010 IEEE.
[6] LenordMelvix J.S.M , Sridevi C. (2014) Design of Efficient Hydroponic Nutrient Solution Control System using Soft Computing based Solution Grading,International Conference On Computation Of Power, Energy, Information And Communication (TCCPETC),978-I -4799-3826-1114/ 20 14 IEEE.
[7] Aalaa Abdullah, Shahad Al Enazi and IssamDamaj (2016) AgriSys: A Smart and Ubiquitous ControlledEnvironment Agriculture System,3rd MEC International Conference on Big Data and Smart City, 978-1-4673-9584-7/16/31.002016 IEEE.