Comparative Study of Different Plan
Configuration Buildings using Wind Analysis
Potnuru Avinash Shaik Yajdani
M. Tech Student Associate Professor Department of Civil Engineering Department of Civil Engineering Andhra University College of Engineering (A) Andhra University College of Engineering (A)
Abstract
The present study describes the effect of wind on multi-storied building. It deals with the analysis of G+15 multi-storied framed structure for different plan configuration i.e. Rectangular, I-shape, C-shape and L-shape building plan configuration are considered. The basic wind speed considered is 50m/s. For the analysis the software tool is used i.e. E-TABS. Different load combinations considered and compared the results of Lateral Displacement, Base shear, Over-turning moment, Torsion etc.., for all four models and concluded that which one is the best configuration among them. Compared only lateral displacement parameter with and without shear wall. In analysis for gravity, live and wind loads used codes are IS: 875 part-1, IS: 875 part-2, IS: 875 part-3, for load combinations used IS: 456, Compiled all the results and tabulated. All the results are studied thoroughly and concluded. Keywords: Wind effect, Rectangular, I-shape, C-shape and L-shape building plan configuration, Shear wall and Lateral displacement
________________________________________________________________________________________________________
I. INTRODUCTION
Due to rapidly growing urbanization the land become very scarcer, to that alternate is using vertical occupancy (i.e. High-rise and Tall buildings). Tall buildings are mainly differ with normal building is its lateral load which is mainly differentiate them. Main difficulty always exist in measuring its real performance. As a structural engineer always want the structure should give comfort to the occupant in its service. Lateral displacement will cause more discomfort to the occupant and that is the main concerning problem in tall structures. Due to this lateral movement the building may oscillates if it extends the allowable there will be structural damages, so the building should satisfy for all required serviceability criteria.
In previous we saw due to lateral loads the building is going to categorize as tall building. Here our main concern about wind load. In USA between 1986 and 1993 hurricanes and tornados caused about $41 billion in insured catastrophic losses, compared with $6.18 billion for all other natural hazards. Not only in USA, had so many European countries also faced losses due to winter storms. According to one insurance agency in 1999 the natural catastrophic resulting in the largest amount of insured losses up to that date was hurricane Andrew in 1992($16.5 billion).
Hudhud caused extensive damage to the city of Visakhapatnam and the neighboring districts of Vizianagaram and Srikakulam of Andhra Pradesh. Damages were estimated to be ₹21908 crore (US$3.4 billion) by the Andhra state government. So in this paper we concentrate about the wind.
Nature of Wind
“Wind” is term used for air in motion and is usually applied to the natural horizontal motion of the atmosphere. Motion in a vertical or nearly vertical direction is called a “current”. Movement of air nearby earth’s surface is 3-dimensional with horizontal motion much greater than the vertical motion. Horizontal motion of air, particularly the gradual retardation of wind speed and the high turbulence that occur near the ground surface. Variations in speed of local winds are referred as “gusts”. Flow of wind is not steady and fluctuates in a random fashion. So wind loads imposed on buildings are studied statistically.
Characteristics of wind
Variation of wind velocity with height
Wind turbulence
Statistical probability
Vortex shedding phenomenon
Dynamic nature of wind-structure interaction
Shear Wall
Location of Shear Wall
Shear walls should create a box structure. Shear walls can provide at corners, sides, and in the interior space, but the location of shear wall at the corners give more strength and stiffness compared to other cases.
To be effective, shear walls should be equal length and placed symmetrically on all four exterior walls of the building.
II. OBJECTIVES OF STUDY
Carryout analysis of a multi-story building subjected to wind load by considering a Rectangular Building, L-shape Building, C-shape Building, I-shape Building.
To ensure that the structure is safe against all possible loading conditions and to fulfill the function for which they built.
To present the factors which are taken into account in the analysis of multi storied Building and the methods, which can be adopted.
To gain a better understanding of the structure behavior under the action of the applied loading.
To check for the best plan of a building among three different shapes in certain design specifications.
To illustrate the decrease in lateral displacements using shear wall
III. METHODOLOGY
For the study four three dimensional building models (i.e. Rectangular, I-shape, C-shape, L-shape plan configuration) are used as the basic models in the study. All buildings have 15 stories with plot area of 40.1574mX40.005m.
Loading
Dead loads of respective members. Concrete density: 25kN/m3.
Finishes: Floor finish=1.5kN/m2 on all floors.
Live loads= 2kN/m2 on all floors except roof.
=3kN/m2 on balconies and corridors.
Lateral load is calculated as per IS 875(part-3):1987 Fallowing parameters are considered
Terrain category: IV Class of building: B Basic wind speed: 50 m/sec
Material Properties
Concrete grade: M25 for beams, columns, slabs and shear wall. Steel grade: Fe415.
Modulus of elasticity of steel (Es)= 2x10⁵ MPa
Modulus of elasticity of concrete (Ec) =5000√𝑓𝑐𝑘 =25000MPa for M25
Assumed Element Dimensions
Column size up to 10 stories is 05mX0.7m. From 11-15 stories is 0.3mX0.6m
Beams: 0.23mX0.23m, 0.23mX0.3m and 0.3mX0.4m Floor and Roof slabs: 125mm.
Shear Wall: 3m along X and Y directions with 230mm thickness. Story height: Typical floor height= 3.5m.
Drawings
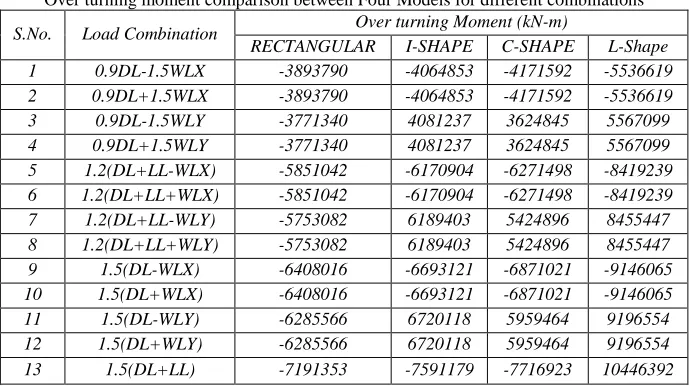
Fig 3.1 Plan of Rectangular Model
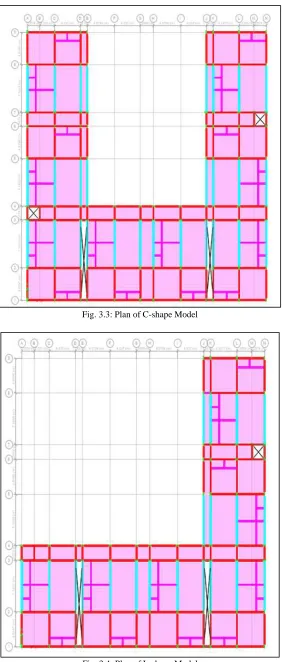
Fig. 3.3: Plan of C-shape Model
IV. RESULTS AND DISCUSSIONS
Displacement comparison between Four Models for different combinations
Table - 4.1
Displacement comparison between Four Models for different combinations
SNO Load Combination DISPLACEMENT mm
RECTANGULAR I SHAPE C SHAPE L SHAPE
1 0.9DL-1.5WLX 60.275 73.493 89.578 149.979
2 0.9DL+1.5WLX 60.275 73.493 89.578 149.979
3 0.9DL-1.5WLY 52.899 64.809 67.796 123.028
4 0.9DL+1.5WLY 52.899 64.809 67.796 123.028
5 1.2(DL+LL-WLX) 49.681 59.916 71.282 120.835
6 1.2(DL+LL+WLX) 49.681 59.916 71.282 120.835
7 1.2(DL+LL-WLY) 42.580 51.967 54.838 93.646
8 1.2(DL+LL+WLY) 42.580 51.967 54.838 93.646
9 1.5(DL-WLX) 61.561 74.388 89.432 150.729
10 1.5(DL+WLX) 61.561 74.388 89.432 150.729
11 1.5(DL-WLY) 53.037 65.054 68.406 118.884
12 1.5(DL+WLY) 53.037 65.054 68.406 118.884
13 1.5(DL+LL) 52.350 65.054 68.406 67.821
Base shear comparison between Four Models for different combinations
Table - 4.2
Base shear comparison between Four Models for different combinations
SNO Load Combination Base shear (kN)
RECTANGULAR I-SHAPE C-SHAPE L-Shape
1 0.9DL-1.5WLX -4529.7454 -4529.7444 -4529.745 -4529.7444
2 0.9DL+1.5WLX 4529.7453 4529.7443 4529.745 4529.7443
3 0.9DL-1.5WLY -4546.9998 -4546.9998 -4547.000 -4546.9998
4 0.9DL+1.5WLY 4546.9998 4546.9998 4547.000 4546.9998
5 1.2(DL+LL-WLX) -3623.7963 -3623.80 -3623.796 -3623.80
6 1.2(DL+LL+WLX) 3623.7962 3623.7955 3623.796 3623.7955
7 1.2(DL+LL-WLY) -3637.5999 -3637.5998 -3637.600 -3637.5998
8 1.2(DL+LL+WLY) 3637.5999 3637.5998 3637.600 3637.5998
9 1.5(DL-WLX) -4529.7454 -4529.7444 -4529.745 -4529.7444
10 1.5(DL+WLX) 4529.7453 4529.7443 4529.745 4529.7443
11 1.5(DL-WLY) -4546.9998 -4546.9998 -4547.000 -4546.9998
12 1.5(DL+WLY) 4546.9998 4546.9998 4547.000 4546.9998
13 1.5(DL+LL) -0.0001 0 0.000 0
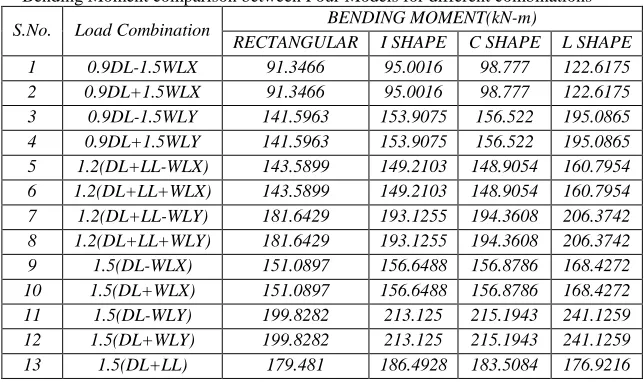
Over turning moment comparison between Four Models for different combinations
Table - 4.3
Over turning moment comparison between Four Models for different combinations
S.No. Load Combination Over turning Moment (kN-m)
RECTANGULAR I-SHAPE C-SHAPE L-Shape
1 0.9DL-1.5WLX -3893790 -4064853 -4171592 -5536619
2 0.9DL+1.5WLX -3893790 -4064853 -4171592 -5536619
3 0.9DL-1.5WLY -3771340 4081237 3624845 5567099
4 0.9DL+1.5WLY -3771340 4081237 3624845 5567099
5 1.2(DL+LL-WLX) -5851042 -6170904 -6271498 -8419239
6 1.2(DL+LL+WLX) -5851042 -6170904 -6271498 -8419239
7 1.2(DL+LL-WLY) -5753082 6189403 5424896 8455447
8 1.2(DL+LL+WLY) -5753082 6189403 5424896 8455447
9 1.5(DL-WLX) -6408016 -6693121 -6871021 -9146065
10 1.5(DL+WLX) -6408016 -6693121 -6871021 -9146065
11 1.5(DL-WLY) -6285566 6720118 5959464 9196554
12 1.5(DL+WLY) -6285566 6720118 5959464 9196554
Torsion comparison between Four Models for different combinations
Table - 4.4
Torsion comparison between Four Models for different combinations
S.No. Load Combination TORSION(kN-m)
RECTANGULAR I-SHAPE C-SHAPE L-Shape
1 0.9DL-1.5WLX -90606.231 -90606.212 -90606.212 -90606.2127
2 0.9DL+1.5WLX 90606.2322 90606.212 90606.2118 90606.2136
3 0.9DL-1.5WLY -91297.8451 -91297.845 -91297.845 -91297.8446
4 0.9DL+1.5WLY 91297.8464 91297.845 91297.845 91297.8455
5 1.2(DL+LL-WLX) -72484.9844 -72484.969 -72484.969 -72484.9698 6 1.2(DL+LL+WLX) 72484.9862 72484.970 72484.9695 72484.9712 7 1.2(DL+LL-WLY) -73038.2757 -73038.276 -73038.276 -73038.2753 8 1.2(DL+LL+WLY) 73038.2775 73038.276 73038.2761 73038.2767 9 1.5(DL-WLX) -90606.2306 -90606.212 -90606.212 -90606.212
10 1.5(DL+WLX) 90606.2327 90606.212 90606.2119 90606.2139
11 1.5(DL-WLY) -91297.8447 -91297.845 -91297.845 -91297.8443
12 1.5(DL+WLY) 91297.8468 91297.845 91297.8451 91297.8458
13 1.5(DL+LL) 0.0012 0.0002 0.0002 0.0009
Shear force comparison between Four Models for different combinations
Table - 4.5
Shear force comparison between Four Models for different combinations
S.No Load Combination shear force (kN)
RECTANGULAR I SHAPE C SHAPE L SHAPE
1 0.9DL-1.5WLX 105.6719 123.8233 138.988 225.48
2 0.9DL+1.5WLX 105.6719 123.8233 138.988 225.48
3 0.9DL-1.5WLY 117.771 120.9088 125.595 145.157
4 0.9DL+1.5WLY 117.771 120.6625 125.595 145.157
5 1.2(DL+LL-WLX) 143.9649 145.1871 144.466 186.6003
6 1.2(DL+LL+WLX) 143.9649 145.1871 144.466 186.6003
7 1.2(DL+LL-WLY) 162.082 165.1067 168.266 182.0129
8 1.2(DL+LL+WLY) 162.082 165.1067 168.266 182.0129
9 1.5(DL-WLX) 153.8588 153.7776 154.509 230.8434
10 1.5(DL+WLX) 153.8588 153.7776 154.509 230.8434
11 1.5(DL-WLY) 176.5273 179.7083 184.270 201.2312
12 1.5(DL+WLY) 176.5273 179.7083 184.270 201.2312
13 1.5(DL+LL) 176.7988 179.9738 178.907 177.5262
Bending Moment comparison between Four Models for different combinations
Table - 4.6
Bending Moment comparison between Four Models for different combinations
S.No. Load Combination BENDING MOMENT(kN-m)
RECTANGULAR I SHAPE C SHAPE L SHAPE
1 0.9DL-1.5WLX 91.3466 95.0016 98.777 122.6175
2 0.9DL+1.5WLX 91.3466 95.0016 98.777 122.6175
3 0.9DL-1.5WLY 141.5963 153.9075 156.522 195.0865
4 0.9DL+1.5WLY 141.5963 153.9075 156.522 195.0865
5 1.2(DL+LL-WLX) 143.5899 149.2103 148.9054 160.7954
6 1.2(DL+LL+WLX) 143.5899 149.2103 148.9054 160.7954
7 1.2(DL+LL-WLY) 181.6429 193.1255 194.3608 206.3742
8 1.2(DL+LL+WLY) 181.6429 193.1255 194.3608 206.3742
9 1.5(DL-WLX) 151.0897 156.6488 156.8786 168.4272
10 1.5(DL+WLX) 151.0897 156.6488 156.8786 168.4272
11 1.5(DL-WLY) 199.8282 213.125 215.1943 241.1259
12 1.5(DL+WLY) 199.8282 213.125 215.1943 241.1259
Shear force in Columns comparison between Four Models for different combinations
Table - 4.7
Shear force in Columns comparison between Four Models for different combinations
S.No Load Combination SHEAR FORCE (kN)
RECTANGULAR I SHAPE C SHAPE L SHAPE
1 0.9DL-1.5WLX 78.575 90.181 93.953 127.657
2 0.9DL+1.5WLX 78.575 90.181 93.953 127.657
3 0.9DL-1.5WLY 92.9153 111.428 110.234 146.735
4 0.9DL+1.5WLY 92.9153 111.428 110.234 146.735
5 1.2(DL+LL-WLX) 96.8081 119.093 115.738 115.315
6 1.2(DL+LL+WLX) 96.8081 119.093 115.738 115.315
7 1.2(DL+LL-WLY) 121.4883 147.373 144.778 152.583
8 1.2(DL+LL+WLY) 121.4883 147.373 144.778 152.583
9 1.5(DL-WLX) 103.0573 126.112 122.120 136.528
10 1.5(DL+WLX) 103.0573 126.112 122.120 136.528
11 1.5(DL-WLY) 133.9076 161.462 158.420 174.719
12 1.5(DL+WLY) 133.9076 161.462 158.420 174.719
13 1.5(DL+LL) 120.4334 147.840 143.018 128.097
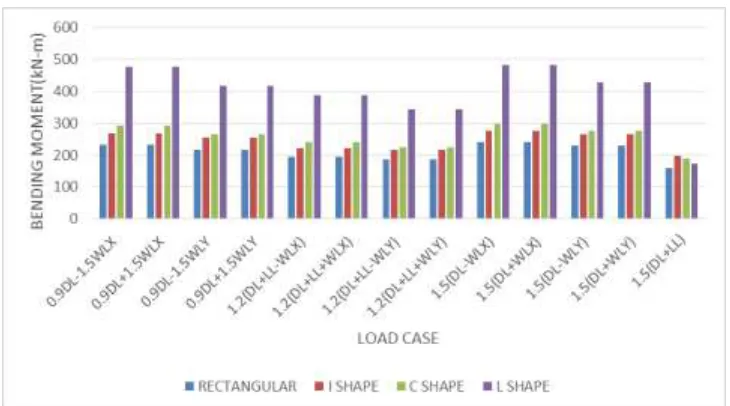
Moment in Columns comparison between Four Models for different combinations
Table - 4.8
Moment in Columns comparison between Four Models for different combinations
S.No Load Combination BENDING MOMENT(kN-m)
RECTANGULAR I SHAPE C SHAPE L SHAPE
1 0.9DL-1.5WLX 233.9411 268.398 291.4255 477.3162
2 0.9DL+1.5WLX 233.9411 268.398 291.4255 477.3162
3 0.9DL-1.5WLY 216.3234 255.0263 264.5479 416.995
4 0.9DL+1.5WLY 216.3234 255.0263 264.5479 416.995
5 1.2(DL+LL-WLX) 195.4256 223.1656 241.4597 388.608
6 1.2(DL+LL+WLX) 195.4256 223.1656 241.4597 388.608
7 1.2(DL+LL-WLY) 186.956 217.6635 225.4157 343.6643
8 1.2(DL+LL+WLY) 186.956 217.6635 225.4157 343.6643
9 1.5(DL-WLX) 240.7149 275.5748 298.205 483.3083
10 1.5(DL+WLX) 240.7149 275.5748 298.205 483.3083
11 1.5(DL-WLY) 228.9679 266.5727 277.0409 427.4511
12 1.5(DL+WLY) 228.9679 266.5727 277.0409 427.4511
13 1.5(DL+LL) 160.5761 197.3045 189.5591 171.6488
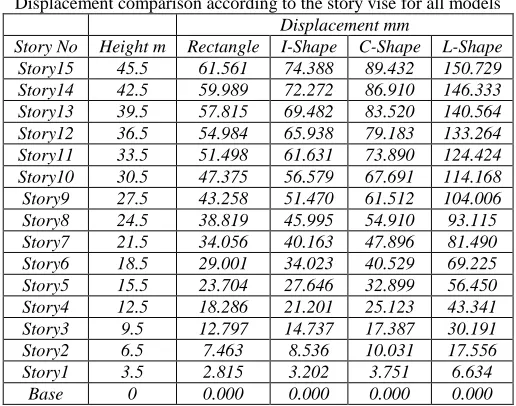
Displacement comparison according to the story vise for all models
Table - 4.9
Displacement comparison according to the story vise for all models Displacement mm
Story No Height m Rectangle I-Shape C-Shape L-Shape
Story15 45.5 61.561 74.388 89.432 150.729
Story14 42.5 59.989 72.272 86.910 146.333
Story13 39.5 57.815 69.482 83.520 140.564
Story12 36.5 54.984 65.938 79.183 133.264
Story11 33.5 51.498 61.631 73.890 124.424
Story10 30.5 47.375 56.579 67.691 114.168
Story9 27.5 43.258 51.470 61.512 104.006
Story8 24.5 38.819 45.995 54.910 93.115
Story7 21.5 34.056 40.163 47.896 81.490
Story6 18.5 29.001 34.023 40.529 69.225
Story5 15.5 23.704 27.646 32.899 56.450
Story4 12.5 18.286 21.201 25.123 43.341
Story3 9.5 12.797 14.737 17.387 30.191
Story2 6.5 7.463 8.536 10.031 17.556
Story1 3.5 2.815 3.202 3.751 6.634
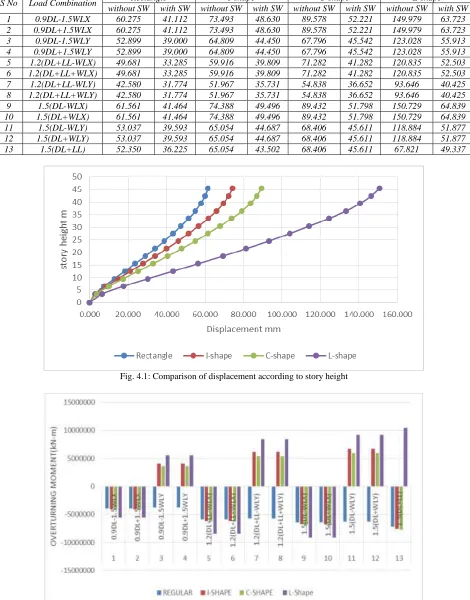
Comparison of Displacements (mm) with and without shear wall(SW)
Table - 4.10
Comparison of Displacements (mm) with and without shear wall
S No Load Combination Rectangle I-shape C-shape L-shape
without SW with SW without SW with SW without SW with SW without SW with SW
1 0.9DL-1.5WLX 60.275 41.112 73.493 48.630 89.578 52.221 149.979 63.723
2 0.9DL+1.5WLX 60.275 41.112 73.493 48.630 89.578 52.221 149.979 63.723
3 0.9DL-1.5WLY 52.899 39.000 64.809 44.450 67.796 45.542 123.028 55.913
4 0.9DL+1.5WLY 52.899 39.000 64.809 44.450 67.796 45.542 123.028 55.913
5 1.2(DL+LL-WLX) 49.681 33.285 59.916 39.809 71.282 41.282 120.835 52.503
6 1.2(DL+LL+WLX) 49.681 33.285 59.916 39.809 71.282 41.282 120.835 52.503
7 1.2(DL+LL-WLY) 42.580 31.774 51.967 35.731 54.838 36.652 93.646 40.425
8 1.2(DL+LL+WLY) 42.580 31.774 51.967 35.731 54.838 36.652 93.646 40.425
9 1.5(DL-WLX) 61.561 41.464 74.388 49.496 89.432 51.798 150.729 64.839
10 1.5(DL+WLX) 61.561 41.464 74.388 49.496 89.432 51.798 150.729 64.839
11 1.5(DL-WLY) 53.037 39.593 65.054 44.687 68.406 45.611 118.884 51.877
12 1.5(DL+WLY) 53.037 39.593 65.054 44.687 68.406 45.611 118.884 51.877
13 1.5(DL+LL) 52.350 36.225 65.054 43.502 68.406 45.611 67.821 49.337
Fig. 4.1: Comparison of displacement according to story height
Fig. 4.3: comparison of BM in columns w.r.t Load Combinations
V. DISCUSSIONS
After applying wind load the lateral displacements are going to increase according to its asymmetry. It was decreased by providing shear wall.
Story displacement is drastically increasing from fourth to tenth story.
Percentage difference in torsion and base shear for all models are very less.
Moment in columns are going to change drastically.
Maximum bending moment in beams is doubled for L-shape compare with rectangle plan configuration.
1.5(DL±WLX), 1.5(DL±WLY) load combinations creating maximum effect on all structural parameters.
Over turning moment is very high for L-shape compare with the remaining configurations.
VI. CONCLUSIONS
From the results and graphs it is inferred that the lateral displacement for all load combinations is increasing with the increase in asymmetry of plan. For example the lateral displacement for all the load combinations in L shaped plan is obtained maximum when compared to the other plans. (Nearly doubled)
It was also inferred that Base shear and Torsion remains unchanged irrespective to the plans.
From the results it was interpreted that the Overturning moment is less for Rectangular shape and very high for L Shape plans.
Maximum Shear force in a beam is changing drastically between rectangular and L Shape. It was found that the maximum shear force has been increased to 23.41% in case of L shaped plan when compared to the rectangular plan.
Maximum Bending moment in a beam for different load combinations is differ by 17.2% to Rectangular and L shape building.
Shear force in columns for different load combinations, it is interpreted that is differ by 30.477%.
It is inferred that the moment in columns are doubled when compare with rectangle and L shape building.
Lateral displacement in L Shape building is decreased by nearly 55% for all combinations by providing Shear wall.
REFERENCES
[1] Abhay Guleria, “Structural Analysis of a Multi-Storeyed Building using ETABS for different Plan Configurations” International Journal of Engineering
Research & Technology (IJERT) IJERT ISSN: 2278-0181 IJERTV3IS051552 www.ijert.org Vol. 3 Issue 5, May – 2014.
[2] Arvind Y.Vyavahare, Godbole P.N Nikose, “Analysis of Tall Buildings for Across Wind Respons” International
[3] Journal of Civil and Structural Engineering, VOL 2 NO3, 2012.
[4] Auto S.M., “Wind load estimation of Tall buildings part I: Comparision of Russian and Nigerian code of practice” Asian Journal of Civil Engineering (Building and Housing) vol 7, No3 (2006)
[5] Abdur Rahman, Saiada Fuadi Fancy, Shamim Ara Bobby “Analysis of drift due to wind loads and earthquake loads on tall structures by Programming Language C”, International Journal of Scientific & Engineering Research
[6] Bungale S.Taranath Ph.D.,S.E., John A. Martin &Associates "Design of Wind and Earthquake Resistant Buildings" Inc Los Angeles, California
[7] Bodhisatta H and P.N.Godbole:"Review of Indian wind code-1S 875(part3) 1987" prepared by the Indian Institute of Technology, Kanpur(2006)
[8] Islam & Siddique ,Murshed "Sustinable Development in drift control of Tall Buildings”, 4th annual paper meet and 1st Civil Engineering Congress, December
2224, 2011
[9] ETABS 2016 Analysis reference manual and ETABS videos.