Segmentation, Super-resolution and Fusion for
Digital Mammogram Classification
By
TABAN FOUAD MAJEED
Department of Applied Computing
University of Buckingham
United Kingdom
A thesis submitted for the
Degree of Doctor of Philosophy in Computer Science to the
School of Science and Postgraduate Medicine in
The University of Buckingham
i
ABSTRACT
Mammography is one of the most common and effective techniques used by radiologists for the early detection of breast cancer. Recently, computer-aided detection/diagnosis (CAD) has become a major research topic in medical imaging and has been widely applied in clinical situations. According to statics, early detection of cancer can reduce the mortality rates by 30% to 70%, therefore detection and diagnosis in the early stage are very important. CAD systems are designed primarily to assist radiologists in detecting and classifying abnormalities in medical scan images, but the main challenges hindering their wider deployment is the difficulty in achieving accuracy rates that help improve radiologists’ performance.
The detection and diagnosis of breast cancer face two main issues: the accuracy of the CAD system, and the radiologists’ performance in reading and diagnosing mammograms. This thesis focused on the accuracy of CAD systems. In particular, we investigated two main steps of CAD systems; pre-processing (enhancement and segmentation), feature extraction and classification. Through this investigation, we make five main contributions to the field of automatic mammogram analysis.
In automated mammogram analysis, image segmentation techniques are employed in breast boundary or region-of-interest (ROI) extraction. In most Medio-Lateral Oblique (MLO) views of mammograms, the pectoral muscle represents a predominant density region and it is important to detect and segment out this muscle region during pre-processing because it could be bias to the detection of breast cancer. An important reason for the breast border extraction is that it will limit the search-zone for abnormalities in the region of the breast without undue influence from the background of the mammogram. Therefore, we propose a new scheme for breast border extraction, artifact removal and removal of annotations, which are found in the background of mammograms. This was achieved using an local adaptive threshold that creates a binary mask for the images, followed by the use of morphological operations. Furthermore, an adaptive algorithm is proposed to detect and remove the pectoral muscle automatically.
Feature extraction is another important step of any image-based pattern classification system. The performance of the corresponding classification depends very much on
ii
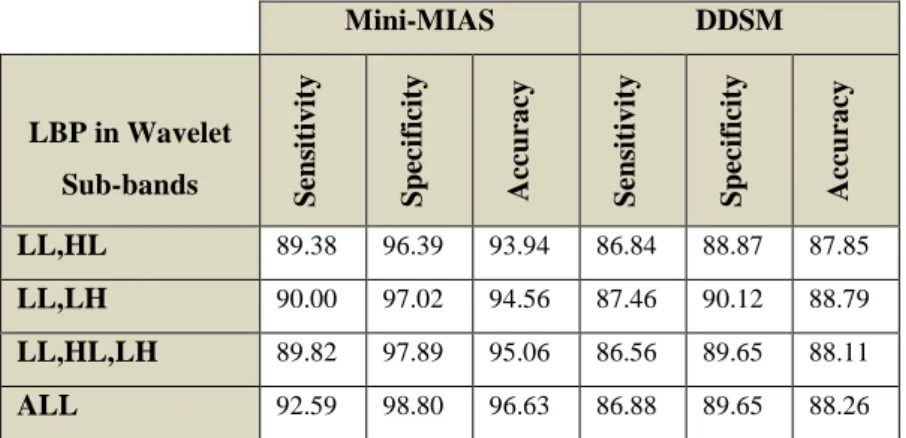
how well the extracted features represent the object of interest. We investigated a range of different texture feature sets such as Local Binary Pattern Histogram (LBPH), Histogram of Oriented Gradients (HOG) descriptor, and Gray Level Co-occurrence Matrix (GLCM). We propose the use of multi-scale features based on wavelet and local binary patterns for mammogram classification. We extract histograms of LBP codes from the original image as well as the wavelet sub-bands. Extracted features are combined into a single feature set. Experimental results show that our proposed method of combining LBPH features obtained from the original image and with LBPH features obtained from the wavelet domain increase the classification accuracy (sensitivity and specificity) when compared with LBPH extracted from the original image.
The feature vector size could be large for some types of feature extraction schemes and they may contain redundant features that could have a negative effect on the performance of classification accuracy. Therefore, feature vector size reduction is needed to achieve higher accuracy as well as efficiency (processing and storage). We reduced the size of the features by applying principle component analysis (PCA) on the feature set and only chose a small number of eigen components to represent the features. Experimental results showed enhancement in the mammogram classification accuracy with a small set of features when compared with using original feature vector.
Then we investigated and propose the use of the feature and decision fusion in mammogram classification. In feature-level fusion, two or more extracted feature sets of the same mammogram are concatenated into a single larger fused feature vector to represent the mammogram. Whereas in decision-level fusion, the results of individual classifiers based on distinct features extracted from the same mammogram are combined into a single decision. In this case the final decision is made by majority voting among the results of individual classifiers.
Finally, we investigated the use of super resolution as a pre-processing step to enhance the mammograms prior to extracting features. From the preliminary experimental results we conclude that using enhanced mammograms have a positive effect on the performance of the system. Overall, our combination of proposals outperforms several existing schemes published in the literature.
iii
I dedicate my thesis to my Father,
Mother, and
iv
ACKNOWLEDGMENT
Allah the most gracious and merciful: Who gave me the energy, health and courage to spend the time to complete this work.
Special thanks go to my supervisors, Dr Harin Sellahewa and Dr Naseer Al-Jawad, for their help, guidance and supervision.
I would like to thank my husband, Rasber, for his patience and endless support and my lovely angels, Shanya and Lanya. Many thanks go to my parents for their unconditional love and support all the way through. Also, thanks to all my friends for their support and encouragement.
I would like to thank Dr Sheeba Taneja, Consultant Radiologist at Milton Keynes Hospital, for her time and consultations.
Many thanks go to Dr Nadia Al-Hassan for her time and help with converting the original mammogram images to super resolved images.
v
ABBREVIATIONS
x2 chi-square test
ACR American College of Radiology
AD Architectural Distortions
ANN Artificial Neural Networks
ASM Angular Second Moment
BI-RADS Breast Imaging Reporting and Data System
CAD Computer Aided Detection/Diagnosis
CBIR Content-Based Image Retrieval System
CC Cranio-Caudal view
CLAHE Contrast Limited Adaptive Histogram Equalization
CS Compressive sensing
DDSM Digital Database for Screening Mammography
DWT Discrete Wavelet Transform
FN False Negative
FP False Positive
GLCM Gray Level Co-occurrence Matrix
HDM Hausdorff Distance Measure
HH High-High (one of the wavelet sub-band)
HL High-Low (one of the wavelet sub-band)
HOG Histogram of Oriented Gradient
HRT Hormone Replacement Therapy
ICA Independent Component Analysis
IDM Inverse Difference Moment
KNN K-Nearest Neighbour
LBPP,Ru2 Local Binary Patterns uniform pattern
LBP Local Binary Pattern
LBPH Local Binary Patterns Histogram
LCIS Lobular Carcinoma in Situ
LH Low-High (the wavelet sub-band representing
vi
LL Low-Low (the wavelet sub-band representing
horizontal/vertical features)
LR Low Resolution
Mini-MIAS Mini-Mammographic Image Analysis Society
MLO Medio-Lateral-Oblique view
MRF Markov Random Field
MRI Magnetic Resonance Image
PCA Principle Component Analysis
ROC Receiver Operating Characteristic
ROI Region of Interest
RP Random Projection
SM Spiculated Masses
SR Super Resolution
SRG Region Growing
ST-ROI Surrounding Tissue Regions of Interest
SVD Singular Value Decomposition
SVM Support Vector Machine
TN True Negative
TP True positive
vii
CONTENTS
ABSTRACT ... i ACKNOWLEDGMENT ... iv ABBREVIATIONS ... v CONTENTS ... vii LIST OF FIGURES ... xiLIST OF TABLES ... xiv
DECLARATION ... xviii
Chapter 1 Introduction ... 1
1.1 Challenges in a CAD System ... 3
1.2 Thesis Motivation ... 4
1.3 Thesis Aims and Contributions ... 4
1.4 Thesis Outline ... 5
1.5 List of Publications ... 6
Chapter 2 Background... 8
2.1 Breast Cancer ... 8
2.1.1 What is Cancer? ... 8
2.1.2 What is Breast Cancer? ... 9
2.1.3 Breast Tumours ... 10
2.1.4 Risk Factors ... 11
2.2 Mammography ... 12
2.2.1 Objects (Lesions) in Mammogram Image... 12
2.2.2 Mammograms Projection ... 14
2.2.3 Breast Image Reporting... 14
2.2.4 Challenges in Reading Mammogram ... 15
viii
2.3.1 What is a CAD System? ... 16
2.3.2 CAD Architecture ... 17
2.3.3 Evaluation of CAD System ... 18
2.4 Mammogram Image Databases ... 20
2.4.1 Mini-MIAS Database ... 21
2.4.2 DDSM Database... 22
Chapter 3 Literature review ... 23
3.1 General CAD System ... 23
3.2 Pre-processing (Segmentation) ... 25
3.3 Feature Extraction and Classification ... 30
3.4 Summary ... 36
Chapter 4 Breast Border Extraction and Pectoral Muscle Removal in MLO Mammogram ... 38
4.1 Breast Region Segmentation ... 38
4.2 Breast Border Extraction ... 40
4.3 Pectoral Muscle Removal ... 42
4.4 Experiment Setup ... 45
4.4.1 Dataset and Strategy ... 46
4.4.2 Gray level Co-occurrence Matrix Features ... 46
4.4.3 Classification Methods ... 51
4.5 Results and Discussion ... 52
4.6 Conclusions ... 58
Chapter 5 Texture-based Features for Mammogram Classification ... 60
5.1 Background ... 61
5.1.1 Discrete Wavelet Transform (DWT) ... 61
5.1.2 Local Binary Patterns (LBP) Features ... 63
ix
5.1.4 Histogram of Oriented Gradients (HOG) descriptor ... 66
5.1.5 Gray level co-occurrence matrix (GLCM) ... 67
5.2 Proposed Feature Extraction Methods ... 68
5.2.1 Multi-Scale LBP ... 68 5.2.2 GLCM ... 69 5.2.3 HOG Descriptor ... 70 5.3 Experimental Setup ... 71 5.3.1 Databases... 71 5.3.2 Evaluation Protocol ... 72 5.3.3 Classification Methods ... 73
5.4 Experimental results and discussion ... 73
5.4.1 Multi-Scale LBP ... 73
5.4.2 GLCM ... 81
5.4.3 HOG ... 82
5.5 Results Summary ... 83
5.6 Dimension Reduction ... 85
5.7 Dimension Reduction on Proposed Schemes ... 88
5.7.1 PCA over HOG ... 88
5.7.2 PCA over LBP ... 89
5.7.3 Experimental Setup and Results ... 89
5.8 Conclusions ... 94
Chapter 6 Fusion for Mammogram Classification ... 97
6.1 Fusion Techniques ... 98
6.1.1 Feature-Level Fusion ... 98
6.1.2 Decision-Level Fusion ... 98
x
6.2.1 Feature-Level Fusion for Mammogram Classification ... 100
6.2.2 Proposed Decision-Level Fusion methods ... 105
6.3 Statistical evaluation of Experiment Results ... 107
6.3.1 Significance between the observed and expected model ... 107
6.3.2 SVM Score Analysis ... 112
6.4 Comparison with Existing Works ... 114
6.5 Conclusions ... 121
Chapter 7 Mammogram Enhancement using Super resolution... 124
7.1 Super Resolution Technique... 125
7.2 Experimental Result ... 127
7.2.1 Original LBP ... 128
7.2.2 Multi Sub-bands LBP ... 129
7.2.3 Original LBP with Multi Sub-bands LBP ... 132
7.2.4 HOG Descriptor ... 135
7.2.5 PCA-HOG and PCA-LBP ... 136
7.2.6 GLCM ... 137
7.2.7 Decision level fusion ... 138
7.3 Conclusions ... 141
Chapter 8 Conclusions and Future Work ... 143
8.1 Limitations and Future Works ... 147
REFERENCES ... 149
APPENDIX A: Some examples of SR-Mini-MIAS database ... 162
APPENDIX B: Super resolution Mini-MIAS database ... 164
APPENDIX C: Super resolution DDSM database ... 171
xi
LIST OF FIGURES
Figure 1.1 : Cranial-Caudal (CC) view and Medio-Lateral-Oblique View (MLO)
(Molloy, 1997) ... 2
Figure 2.1: The part of female breast: image from www.breastcancer.org ... 9
Figure 2.2 Shapes of mass (adapted from (Yacoub, et al., 2006)) ... 13
Figure 2.3: Mammogram Projections ... 14
Figure 2.4: CAD architecture ... 17
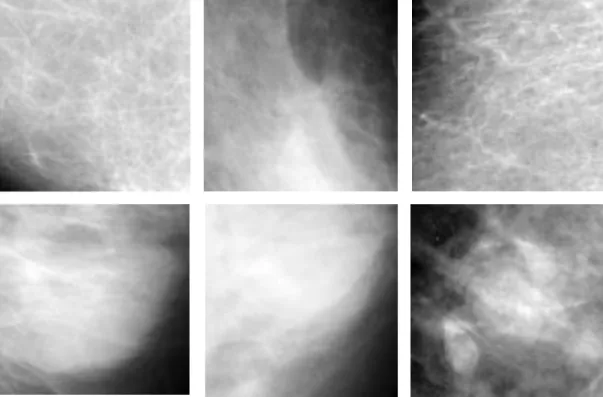
Figure 2.5: Examples of different tissue types available in the Mini-MIAS database 21 Figure 2.6: Sample mass ROIs first row and normal ROIs second row ... 22
Figure 4.1: Types of noises example observed at a mammogram mdb002 in Mini-MIAS database (Suckling, et al., 1994) ... 39
Figure 4.2: Example images of the Mini-MIAS database with different types of noises and background artifacts ... 39
Figure 4.3: Breast border extraction process... 41
Figure 4.4: (a) Original image, (b) Binarised image, (c) Removed artifacts, (d) Extracted breast region ... 42
Figure 4.5: Pectoral muscle removal process ... 44
Figure 4.6: Output of the Pectoral muscle removal algorithm ... 45
Figure 4.7: Example of extracting GLCM matrix from a part of image ... 47
Figure 4.8: An example of SVM model ... 52
Figure 4.9: Label removal and Border extraction sample ... 53
Figure 4.10: Radiologist Decisions for muscle removal ... 54
Figure 4.11: Classification accuracy by KNN classifier, (a) d=1 and angle=0 degree, (b) d=1 and angle= 45 degree, (c) d=1 and angle= 90 degree and (d) d=1 and angle=135 degree ... 58
Figure 4.12: Classification accuracy by SVM classifier, (a) d=1 and angle=0 degree, (b) d=1 and angle= 45 degree, (c) d=1 and angle= 90 degree and (d) d=1 and angle=135 degree ... 58
xii
Figure 5.1: Wavelet Decompositions ... 62
Figure 5.2: Three Level Pyramid DWT decomposition of mammograms ... 63
Figure 5.3: An example of LBP operator ... 64
Figure 5.4: Sub block histogram concatenating (Ahonen, et al., 2004) ... 65
Figure 5.5: Circular neighbourhoods for LBP (a, (b), and (c) ... 66
Figure 5.6 : Results summary of Mini-MIAS database accuracy ... 83
Figure 5.7 : Results summary of DDSM database accuracy ... 84
Figure 5.8: Largest and smallest Principle components... 88
Figure 5.9: General frame work of PCA-HOG ... 89
Figure 6.1: General frame work of feature level fusion strategy ... 99
Figure 6.2: General frame work of the decision level fusion strategy ... 100
Figure 6.3 : Proposed HOG and LBPH features fusion diagram ... 101
Figure 6.4 : Proposed PCA-HOG and PCA-LBPH features fusion diagram ... 104
Figure 6.5: Examples of Correctly and Incorrectly classified mammograms ... 123
Figure 7.1: An example of Mini-MIAS mammogram: (a) Normal LR-Mini-MIAS mammogram, (b) Normal SR-Mini-MIAS mammogram, (c) Abnormal LR-Mini-MIAS mammogram, and (d) Abnormal SR-Mini-LR-Mini-MIAS mammogram ... 127
Figure 7.2: Results of Mini-MIAS Database based on LBPH scheme obtained from original mammogram ... 128
Figure 7.3: Results of DDSM Database based on LBPH scheme obtained from original mammogram ... 128
Figure 7.4: Multi sub-bands results of leave-one-out strategy, (a) Mini-MIAS, (b) DDSM ... 130
Figure 7.5: Multi sub-bands results of 70% training and 30% testing strategy, (a) Mini-MIAS, (b) DDSM ... 130
Figure 7.6: Multi sub-bands results of 50% training and 50% testing strategy, (a) Mini-MIAS, (b) DDSM ... 131
xiii
Figure 7.7: Multi sub-bands results of 10% training and 90% testing strategy, (a) Mini-MIAS, (b) DDSM ... 131
Figure 7.8: Original LBP and multi sub-bands LBP results of leave-one-out strategy, (a) Mini-MIAS, (b) DDSM ... 133
Figure 7.9: Original LBP and multi sub-bands LBP results of 70% / 30% strategy, (a) Mini-MIAS, (b) DDSM ... 133
Figure 7.10: Original LBP and multi sub-bands LBP results of 50% / 50% strategy, (a) Mini-MIAS, (b) DDSM ... 134
Figure 7.11: Original LBP and multi sub-bands LBP results of 10% / 90% strategy, (a) Mini-MIAS, (b) DDSM ... 134
Figure 7.12: Results of HOG features obtained from Mini-MIAS Database ... 135
Figure 7.13: Results of HOG features obtained from DDSM Database ... 135
Figure 7.14: Results based on PCA-LBP features obtained from (a) Mini-MIAS, (b) DDSM Database... 136
Figure 7.15: Results based on PCA-HOG features obtained from (a) Mini-MIAS, (b) DDSM Database... 137
Figure 7.16: Results of GLCM features obtained from Mini-MIAS database ... 138
Figure 7.17: Results of using four strategies based on GLCM features obtained from DDSM database ... 138
Figure 7.18: Decision fusion results of Leave-one-out strategy, (a) Mini-MIAS, (b) DDSM ... 139
Figure 7.19: Decision fusion results of 70% training and 30% testing strategy, (a) Mini-MIAS, (b) DDSM ... 139
Figure 7.20: Decision fusion results of 50% training and 50% testing strategy, (a) Mini-MIAS, (b) DDSM ... 140
Figure 7.21: Decision fusion results of 10% training and 90% testing strategy, (a) Mini-MIAS, (b) DDSM ... 140
xiv
LIST OF TABLES
Table 2.1: CAD system evaluation terminology ... 19
Table2.2: CAD measure example ... 20
Table 3.1: Pre-processing (segmentation) techniques summary ... 30
Table 3.2: Feature extraction and classification summary ... 35
Table 4.1: Classification result, d=1, angle=0 degree ... 54
Table 4.2: Classification result, d=1, angle=45 degree ... 55
Table 4.3: Classification result, d=1, angle=90 degree ... 55
Table 4.4: Classification result, d=1, angle=135 degree ... 56
Table 5.1: Results of leave-one-out strategy based on LBPH features obtained from single wavelet sub-band ... 74
Table 5.2: Results of 70%/30% training/testing strategy based on LBPH features obtained from single wavelet sub-band... 74
Table 5.3: Results of 50%/50% training/testing strategy based on LBPH features obtained from single wavelet sub-band... 75
Table 5.4: Results of 10%/90% training/testing strategy based on LBPH features obtained from single wavelet sub-band... 75
Table 5.5: Results of leave-one-out strategy based on LBPH features obtained from multi wavelet sub- bands ... 76
Table 5.6: Results of 70%/30% training/testing strategy based on LBPH features obtained from multi wavelet sub-bands ... 76
Table 5.7: Results of 50%/50% training/testing strategy based on LBPH features obtained from multi wavelet sub-bands ... 77
Table 5.8: Results of 10%/90% training/testing strategy based on LBPH features obtained from multi wavelet sub-bands ... 77
Table 5.9: Results of different strategy based on LBPH features obtained from original mammogram images ... 78
xv
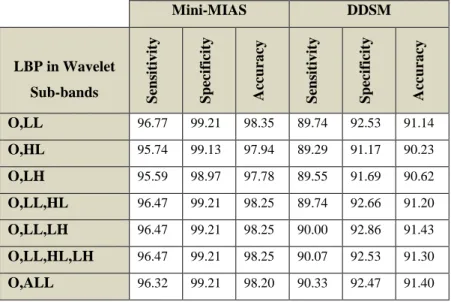
Table 5.10: Results of leave-one-out tests strategy based on LBPH features obtained from original mammogram and wavelet sub-bands ... 78
Table 5.11: Results of 70%/30% training/testing strategy based on LBPH features obtained from original mammogram and wavelet sub-bands ... 79
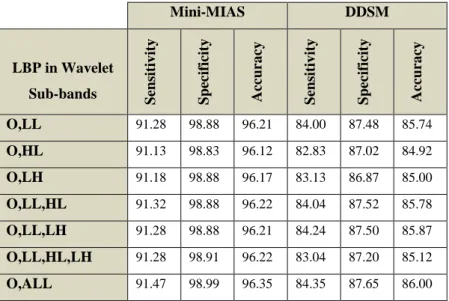
Table 5.12: Results of 50%/50% training/testing strategy based on LBPH features obtained from original mammogram and wavelet sub-bands ... 79
Table 5.13: Results of 10%/90% training/testing strategy based on LBPH features obtained from original mammogram and wavelet sub-bands ... 80
Table 5.14: Results of leave-one-out tests strategy based on 14 GLCM features obtained from the original mammogram... 81
Table 5.15: Results of 70%/30% training/testing strategy based on 14 GLCM features obtained from the original mammogram... 81
Table 5.16: Results of 50%/50% training/testing strategy based on 14 GLCM features obtained from the original mammogram... 82
Table 5.17: Results of 10%/90% training/ testing strategy based on 14 GLCM features obtained from the original mammogram... 82
Table 5.18: Results of using four strategies based on HOG features obtained from original mammogram ... 82
Table 5.19: Feature vector size ... 86
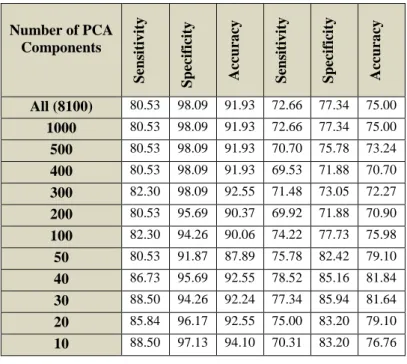
Table 5.20: Results of leave-one-out strategy based on applying PCA over HOG features with selecting various PCA components ... 89
Table 5.21: Results of 70%/30% training/testing strategy based on applying PCA over HOG features with selecting various PCA components ... 90
Table 5.22: Results of 50%/50% training/testing strategy based on applying PCA over HOG features with selecting various PCA components ... 90
Table 5.23: Results of 10%/90% training/testing strategy based on applying PCA over HOG features with selecting various PCA components ... 91
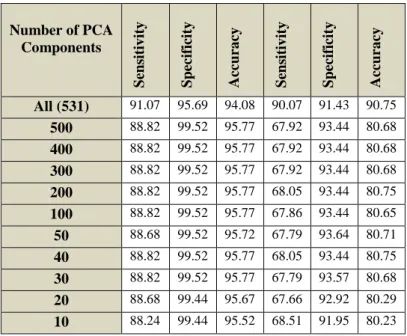
Table 5.24: Results of leave-one-out strategy based on applying PCA over LBPH features with selecting various PCA components ... 92
xvi
Table 5.25: Results of 70%/30% training/testing strategy based on applying PCA over LBP features with selecting various PCA components... 92
Table 5.26: Results of 50%/50% training/testing strategy based on applying PCA over LBP features with selecting various PCA components... 93
Table 5.27: Results of 10%/90% training/testing strategy based on applying PCA over LBP features with selecting various PCA components... 93
Table 6.1: Results of leave-one-out tests strategy based on fusing HOG and LBPH features ... 101
Table 6.2 : Results of 70%/30% training/ testing strategy based on fusing HOG and LBPH features ... 102
Table 6.3 : Results of 50%/50% training/testing strategy based on fusing HOG and LBPH features ... 102
Table 6.4 : Results of 10%/90% training/testing strategy based on fusing HOG and LBPH features ... 103
Table 6.5 : Results of leave-one-out tests strategy based on fusing HOG and PCA-LBPH features ... 104
Table 6.6 : Results of 70%/30% training/testing strategy based on fusing PCA-HOG and PCA-LBPH features ... 104
Table 6.7 : Results of leave-one-out tests strategy based on decision level fusion of using different kind of f features ... 106
Table 6.8 : Results of 70%/30% training/testing strategy based on decision level fusion of using different kind of features ... 106
Table 6.9: Contingency table shows the frequencies of 1s and 0s for Method1 and Method2 ... 108
Table 6.10: Chi-square (𝐱𝟐) test for mammogram image classification on Mini-MIAS database ... 110
Table 6.11: Chi-square (𝐱𝟐) test for mammogram image classification on DDSM database ... 111
Table 6.12: SVM score analysis for Mini-MIAS database ... 113
xvii
Table 6.14: Comparison between proposed method and some related work (Mini-MIAS database) ... 115
Table 6.15: Comparison between proposed method and some related work (DDSM database) ... 117
xviii
DECLARATION
I, hereby declare that presented work has not previously been submitted towards any qualification, degree or diploma at the University of Buckingham or any other university.
I also declare that, to the best of my knowledge and belief, the thesis contains no material previously published or written by another person except where due reference is made in the thesis itself.
1
Chapter 1
Introduction
Breast cancer is a major global health problem in the world. It is the main cause of mortality amongst women. Excluding skin cancers, breast cancer is the most commonly diagnosed cancer amongst women in the USA. Also, it comes as the second leading cause of cancer-related death (Kwan1, et al., 2009). It affects women over the age of 15 (usually between 35-55 years) as well as men over the age of 40 (Senthilkumar & Umamaheswari, 2011). Reports from 2007 have shown an estimated 178,480 newly-diagnosed cases of breast cancer and 40,460 deaths from the disease amongst women (Tang, et al., 2009). Moreover, reports from the World Health Organization’s (WHO) International Agency for Research on Cancer in Lyon-France, shows that more than 150,000 women around the world die from breast cancer each year (Yu & Guan, 2000). Given the high mortality rates associated with breast cancer, early detection remains the key to ameliorating its prognosis (Xue, et al., 2010) (Deserno, et al., 2011) (Khuzi, et al., 2009). The death rate in the UK shows that for every 100000 females there are around 36 death cases caused by breast cancer, while the rate is less than 1 for every 100000 males (Cancer Research, UK, 2014).
Mammography is known as one of the effective tools for earlier breast cancer detection. It is a screening tool used to examine the human breast by using low-dose amplitude X-rays. Here, asymptomatic women with no clinical suspicion for breast cancer are screened using screening mammography and this has reduced the mortality rate by 30-70% (Linguraru, et al., 2006). Two imaging projections of each breast are routinely obtained as part of the human test, Cranio-Caudal (CC) and Medio-Lateral-Oblique (MLO) views, as shown in Figure 1.1.
When reading a mammogram, in the majority of cases, a specialist radiologist would identify a radiographic abnormality; however, there is a chance of missing the same abnormality under different circumstances. So, the probability of false negatives is high. Retrospective studies (Christoyianni, et al., 2002) (Winsberg, et al., 1967) (Marx, et al., 2004) have shown that 10 to 30% of the cancers are undetected due to radiologist fatigue, the complex structure of the breast tissue, and the subtlety of the cancer. It was
2
hoped that with the aid of Computer Aided Detection (CAD) schemes, this lack of consistency of the human observer may be overcome when used as a reminder or “second opinion” (Masala, 2006) (Sampat, et al., 2008). Results have shown that the performance of radiologists can be improved by providing them with the results of a CAD system. Radiologist's performance can be improved by providing them with the results of a CAD system.
Figure 1.1 : Cranial-Caudal (CC) view and Medio-Lateral-Oblique View (MLO) (Molloy, 1997) Nowadays, Computer-aided detection/diagnosis (CAD) is an integral part of the process adopted by radiologists and Oncology specialists in detecting breast cancer from mammograms produced at most screening centres and hospitals. In fact, over the last few years CAD has been developed and incorporated in the detection and differential diagnosis of a variety of abnormalities in medical images obtained from different scanning schemes (Doi, 2007).
Therefore, it was felt that a high performance CAD system is needed to be designed in order to help radiologists to detect cases of breast cancer early, hence, reducing, or even eliminating, the rate of mortality amongst women with the disease.
In this thesis we will investigate a method to breast border extraction and pectoral muscle removal. Also we classify the mammogram to normal and abnormal by
3
extracting textural feature and fuse the features in two different level (feature level fusion and classification level fusion). Finally, we will investigate the use of super-resolution methods to enhance the mammogram classification.
1.1
Challenges in a CAD System
The large set of images produced by screening mammogram tests constitutes a huge workload for the relatively few radiologists that need to interpret these mammogram images. Thus, the computerized mammographic analysis will have a great impact in terms of easing the workload and assisting in the detection of the breast cancer.
In CAD systems, detecting an abnormality is difficult because of the characteristics and structure of breast abnormalities. Sometimes mass and micro-calcifications are superimposed and hidden in the dense tissue, therefore this makes the segmentation of a correct region of interest (ROI) difficult. A wide range of features of the abnormality (e.g. shape, margin and density) and their low visibility within the surrounding tissue makes the computer aided detection and diagnosis of breast abnormalities a challenge.
A typical CAD system includes a number of steps: pre-processing and segmentation, feature extraction, feature reduction (selection), and classification. Each step has its challenges and the outcome of one affecting the result of the next. Before a digitized mammogram is analyzed by a computer, it must be segmented into its representative anatomical regions. Accurate segmentation of the breast region in mammograms is a key pre-processing step in the analysis of mammograms. This step is essential for confining the relevant search regions that may contain the suspect abnormalities and reduce excessive influence from the irrelevant background regions of the mammogram.
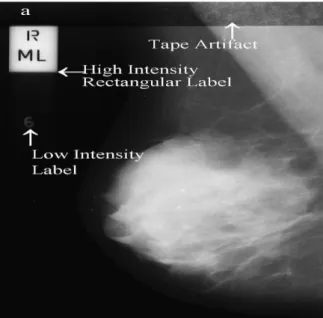
Examples of background information that must be segmented and excluded from the mammogram region are types of noise observed in mammograms that include high intensity rectangular label, low intensity label and tape artifacts (Tzikopoulos, et al., 2011).
The pectoral muscle should always appear as a high-intensity, triangular region across the upper posterior margin of the image on a proper MLO view. We deal with this kind of challenge in details in chapter four of this thesis by proposing breast border extraction and pectoral muscle suppression as a part of the pre-processing step. Automatically extracting and selecting appropriate features that will give the best classification accuracy results is a difficult task. Furthermore, the choice of a classifier
4
has a great influence on the final result. Again we deal with these kinds of challenges in detail by investigating several features extraction techniques, feature fusion, feature reduction (selection), and classification in chapters five and six of this thesis. Finally, in chapter seven we will investigate the use of super-resolution to enhance the mammogram prior to feature extraction.
1.2
Thesis Motivation
Since the cause of breast cancer is still not certain, prevention against breast cancer remains a challenge. However, there is a chance of complete recovery if the efficient diagnosis of breast cancer was made at an early stage. In other words, early detection of breast cancer can play a key role in reducing the associated morbidity and mortality rates. Advances have been made in the diagnosis of breast cancer at earlier stages of development using radiographic breast imaging and screening programs; however, figures show that 10-30% of biopsy-proven malignant cases are missed due to various factors and reasons such as technical problems in the imaging procedure, abnormalities that are not apparent, and abnormalities that are misread (Shinde, 2003).
As mentioned above, a high percentage of breast cancer cases can be missed by conventional screening mammography. Therefore, this fact motivates us to create and design Computer-aided detection/diagnosis (CAD) systems, which use advanced image analysis techniques to detect abnormalities in mammograms. Separating mammogram images to the normal and abnormal case is defined as the first step towards detecting abnormality or to help radiologists in making a diagnosis.
1.3
Thesis Aims and Contributions
A high performance CAD system is needed to be designed in order to help radiologists to detect cases of breast cancer in an early stage, thereby, reducing, or even eliminating, the rate of mortality amongst women with the disease.
Our primary objective is to investigate and develop reliable algorithms designed to automate the computer- based aspects of the process of detecting and classifying abnormalities in digital mammograms. In particular we aim to eventually provide a Computer-Aided Detection/Diagnosis (CAD) system to improve existing tools and help facilitate comprehensive screening systems.
In order to satisfy our aims expressed above, the main contributions of this thesis can be stated as follows:
5
Developed and proposed a scheme to remove irrelevant parts of the mammograms to prepare the image for feature extraction. This resulted in obtaining a higher mammogram classification accuracy when compared to using all mammograms parts. Irrelevant parts are breast region background and muscles of the breast, especially in MLO view images which causes a negative effect on the classification accuracy of the CAD system.
Different types of texture feature extraction schemes such as Local Binary Pattern (LBP), wavelet based multiscale LBP, Gray Level Co-occurrence Matrix (GLCM), and Histogram Oriented Gradient (HOG), have been investigated. We propose multi-scale features based on wavelet and local binary patterns for mammogram classification. Furthermore, two different classifiers, namely K-Nearest Neighbour (KNN) and Support Vector Machine (SVM) are discussed and investigated.
Propose to use PCA to reduce the dimension of very large feature sets (e.g. HOG features, multiscale LBPH) and demonstrated that a very small feature vector could be used without compromising classification accuracy. The small feature sets improve efficiency (processing and storage) of the system.
Propose the use of the feature and decision fusion to obtain better mammogram classification accuracy and overcome the limitation of using single feature type mentioned above. We show that decision level fusion can lead to significant improvement in classification accuracy, similar to a number of radiologists examining the same mammogram to arrive at a diagnosis.
Propose the use of super resolution to enhance mammograms prior to feature extraction. Experimental results show an improvement in classification accuracy. However, further research is required to establish a deeper understanding of the effects of super-resoling mammograms on the final classification.
1.4
Thesis Outline
The rest of the thesis is organised as follows:
Chapter two: A theoretical background about the main focuses subjects are given in details. Focused subjects are breast cancer, mammography, and CAD system. For each subject, important terminology and concepts are explained such as in the breast cancer field, the risk factors are given, in mammography field, mammography projection and challenges of reading mammogram images
6
explained, while in the CAD system field, the architecture of any CAD system given as well as evaluation measurements of any CAD system are discussed. At the end of the chapter properties of used databases are given.
Chapter three: provides literature survey about the CAD system, pre-processing step, and feature extraction methods to classify mammogram images.
Chapter four: proposes a method for mammogram border extraction and pectoral muscle removal. The experimental results show that using segmented mammogram images by our proposed method has better classification accuracy than using original mammograms.
Chapter five: a number of texture-based features are investigated for mammogram classification. We propose the use of multiscale LBPH features in combination with existing features to represent mammograms. Results of experiments on two databases are discussed here. Also we present the use of PCA to reduce the number of features while keeping the classification accuracy at the same level or even increase it when compared with using original feature sets.
Chapter six: proposes the use of the feature and decision fusion to increase mammogram classification accuracy.
Chapter seven: proposes the use of super resolution to enhance mammograms prior to feature extraction. Several experiments will be conducted to evaluate the effects of super resolution on mammogram classification.
Chapter eight: ends the thesis by presenting our overall conclusions and direction of future research work.
1.5
L
ist of
P
ublications
Peer Reviewed Paper:
1. Taban F. Majeed, Naseer Al-Jawad and Harin Sellahewa, “Breast Border Extraction and Pectoral Muscle Removal in MLO Mammogram Images”, Fifth Computer Science and Electronic Engineering Conference (CEEC 2013), September 17-18, 2013, University of Essex, Colchester, United Kingdom.
7
Posters:
1. Taban F. Majeed, Naseer Al-Jawad and Harin Sellahewa, “Breast Border Extraction and Pectoral Muscle Removal in MLO Mammogram Images”, in BioTrinity 2013 - European Biopartnering and Investment Conference - May 14-16, 2013, Newbury Berkshire, United Kingdom.
2. Taban F. Majeed, Naseer Al-Jawad and Harin Sellahewa, “Breast Border Extraction and Pectoral Muscle Removal in MLO Mammogram Images”, in 9th London Hopper poster competition, 23 May 2013, London, United Kingdom.
8
Chapter 2
Background
This chapter gives a general background to cancer and includes definitions of cancer especially breast cancer, types of cancer appears in the breast, and risk factors of the breast cancer. Mammography and its use in detecting the breast abnormality are explained in Section 2.2. A brief description of CAD systems, their advantages for detecting breast abnormality, system architecture, and system evaluation are presented in Section 2.3. Finally, the mammogram databases used in this thesis will be described in Section 2.4. Readers familiar with the general background on breast cancer and mammography may skip Sections 2.1 and 2.2.
2.1
Breast Cancer
This section presents important background information on breast cancer.
2.1.1 What is Cancer?
The human body is composed of millions of cells. Normally, body cells grow, multiply and then die in a programmed and controlled way. The rate at which body cells divide and grow varies with age. In infancy and childhood, normal cells divide faster to allow for growth. In adult life, some cells differentiate and specialize and hence stop dividing, while others divide only to replace cells lost either through injury or after cell death. The whole processes of cell growth and division is under close monitoring by different mechanisms in the body to keep the processes well controlled.
A group of conditions where the human body's cells begin to grow and divide in an uncontrolled fashion is called cancer. When cancer arises from epithelial cells it is called ‘carcinoma’. Six biological capabilities characterise cancer cells and they constitute what is called ‘hallmarks of cancer’. These biological capabilities are obtained during the multistep development of human tumours and include self-sufficiency in growth signals, evading growth suppressors, evasion of apoptosis (programmed cell death),limitless, replicative potential, the induction of angiogenesis, and tissue invasion and metastasis, cancer cells seize nutrients from normal cells, and
9
then encroach on the surrounding tissues. Cancer cells can even detach from tumour and metastasis to other parts of the human body via the lymphatic or vascular systems (i.e. spreading of cancer from one part of the body to another). Genome instability is pivotal in the development and maintenance of these hallmarks (Samulski, 2006) (Sample, 2003) (Hanahan & Weinberg, 2011) (Che Kuo, et al., 2014).
2.1.2 What is Breast Cancer?
Breast cancer is the most common cancers in the UK. Each year, approximately 50,000 women are affected by breast cancer in the UK. Amongst these, 80% are over 50; however, younger women, and in rare cases men, can also get the disease (UK.GOV, 2010). In the United States the breast cancer has become the second leading cause of cancer death in women. The World Health Organization's statistics show that around 519,000 women worldwide will die of breast cancer (Elshinawy, 2010).
The female breast is composed of lobules (glands that produce milk), ducts (the milk carrier from the lobules to the nipple), and stroma (adipose and connective tissue surrounding the ducts and lobules with blood and lymphatic vessels). Figure 2.1 show the anatomy of female breast (da Fonseca, February 2013) (NIH, September, 2009).
Figure 2.1: The part of female breast: image from www.breastcancer.org Breast profile A B C D E F G Ducts Lobules
Dilated section of duct Nipple
Fat
Pectorals major muscle Chest wall/rib cage
Enlargement
A B C
Normal duct cells Basement membrane Lumen (centre of duct)
10
Many cases of breast cancer arise from cells that line the breast ducts (ductal cancers), but cells that line the lobules are also the source other cancers (lobular cancers). Breast cancer has adverse effects on mammary gland and cancer cells can metastasize (i.e. break away from the breast tumour and disperse to other parts of the body via the lymphatic system. Therefore, the lymphatic drainage of the breasts is very relevant to oncology(Society, 2009).
2.1.3 Breast Tumours
Breasts tumours can be classified into three types: benign breast tumours, in situ breast cancers, and invasive breast cancers (Samulski, 2006) (Sample, 2003).
2.1.3.1 Benign Breast Tumours
This type of breast neoplasm forms the majority of breast tumours detected by mammography. As the name implies, these are noncancerous growths and lack the capability to invade surrounding tissues or spread to other organs. Most benign tumour cases can be left alone if they show no symptoms and create no complications. The examinations or imaging scans needs to ensure that the tumour is not growing. In some cases it is difficult to distinguish certain benign masses cases from malignant lesions cases with mammography scans.
2.1.3.2 In Situ Cancer
In situ breast cancer (non-invasive breast cancer) is where the cancer cells have not invaded the basal membrane and are fully contained in the lobule or the duct. It is at a stage where it has not spread to the surrounding tissues in the breast or other parts of the body. However, it has the potential to develop into a more serious invasive cancer.
Depending on whether the carcinomatous cells arise from the ducts or the lobules, two types of non-invasive breast cancer available: (i) ductal carcinoma in situ (DCIS) which is named as stage 0 cancer that has not spread beyond the ductal system (i.e. to the lymph nodes or other parts of the human body). The chance of overcoming this kind of cancers can be increased by taking the proper treatment, (ii) lobular carcinoma in situ (LCIS), the LCIS type of cancer is more difficult to detect using the mammography compared with DCIS cases. LCIS cases are usually discovered when the patient is being investigated and biopsied for another kind of abnormality. Therefore for early detection of breast cancer, the recommendation by American Cancer Society includes
11
a clinical examination every three years for women aged between 20 to 39 years, and at the age 40, the annual mammography screening should start. Another optional recommendation of monthly breast self-examination starts from 20 years old is made to the American Cancer Society.
2.1.3.3 Invasive Cancer
Cancer is said to be invasive when cancer cells have broken through the basal membrane and spread into the surrounding tissue. Here the chance of metastasis increases considerably. The American Cancer Society shows that age is an important factor in developing breast cancer among women, so women under age 45 have more chance of contracting invasive breast cancer diseases. Unfortunately, two thirds of invasive breast cancer cases are only diagnosed at the age of 55 or more (Samulski, 2006).
Other risk factors include race, geography, socioeconomic status, family history, genetics, exposure to radiation, obesity, and alcohol intake (see Section 2.1.4 for risk factors). The most common form of breast cancer is invasive ductal breast cancer. There are other types of breast cancer which are classed as special types such as invasive lobular breast cancer and some rare types of breast cancer. Invasive ductal breast cancer accounts for about 80% of all cases of breast cancer. The invasive ductal breast cancer has a number of possible symptoms, for example change of the breast size and shape, lump or thickening of the breast tissue or skin puckering or dimpling of the skin, swelling under the arm, discharge from the nipple, and constant pain in the breast or armpit. Less commonly, a type of rash involving the nipple.
It is worth mentioning that the stage of breast cancer at the time of detection dictates the success of any subsequent treatment. The stage of a tumour often takes into account its size, depth of penetration whether there is any invasion to adjacent organs, whether there is metastasis to regional lymph nodes, and if so how many lymph nodes, and whether it has spread to distant organs .
2.1.4 Risk Factors
The exact causes of breast cancer are still not known; however, there are some factors that increase the risk of developing the disease. These include early menarche or late menopause, family history of breast cancer, taking combined hormone replacement therapy (HRT) containing oestrogen and progesterone, the risk of breast cancer is
12
strongly related to age, certain dietary factors and some lifestyle factors including excessive consumption of alcohol over many years, excessive smoking over many years, physical inactivity and being overweight (increased levels of fat tissue-derived oestrogen). Women with dense breast tissue (when the breast is mostly composed of glandular and connective tissue with scanty amount of fatty tissue) manifested in mammograms as a larger area of dense tissue for the breast if it compares with the mammogram of the women of the same age are at higher risk of breast cancer (Society, 2009).
2.2
Mammography
Many different techniques for imaging have been produced such as (X-ray, Magnetic Resonance Image (MRI), and ultrasound). However, mammography is the technique that is used most widely to detect breast cancer at early stages. Digital mammography represents an advanced form of x-ray mammography. Here, a special electronic x-ray detector is used to capture the breast image and the image is converted into a digital picture which is then stored on a computer. The magnification, orientation, brightness and contrast of the mammogram image may be changed after the exam is finished to enhance the clarity of the digital mammogram images and to help the radiologist to see certain zones clearly. The advantages of digital mammography over traditional film mammography are (i) faster image acquisition, (ii) examination time is shorter, (iii) easier processes of image storage, (iv) low cost when compared to other techniques such MRI, and (v) transmission to other health professionals. In addition, it facilitates computer processing analysis of breast images which results in greater accuracy in breast cancer detection (Hashimoto, 2008) (The Independent UK Panel on Breast Cancer, October 2012).
2.2.1 Objects (Lesions) in Mammogram Image
There are certain characteristic lesions that characterize breast cancer; these include microcalcifications, masses, and architectural distortions. Bilateral asymmetry may also hint towards breast cancer.
Microcalcifications are tiny lesions (typically 0.05 - 1 mm) on mammograms. Their minute sizes make them relatively difficult to detect. Beside their minute and variable sizes, they are bright, of different shapes and distribution, and in some cases of low contrast making them even harder to spot. Furthermore, their proximity to the
13
surrounding dense tissues adds to the difficulty in detection because of considerable overlapping between normal and suspicious tissues. To further complicate the picture, some anatomic structures such as fibrous strands, breast margins or hypertrophied lobules mimic microcalcifications in their mammographic appearance. Accurate identification of microcalcifications is paramount for an early detection of the majority of breast cancer cases, because their presence is strongly correlated with breast cancer, particularly when they appear in clusters (Bozek, et al., september, 2008) (de Cruz, July, 2011).
The morphology of the microcalcifications is an important indicator of the nature of the underlying pathology. Generally larger, round and oval shaped calcifications with uniform size are in favour of a benign lesion; whereas, calcifications that are smaller, irregular, heterogeneous in size and morphology and of arborizing nature are in favour of being malignant (de Cruz, July, 2011).
On mammograms, masses appear as dense regions in the breast that are of different sizes and properties. The categorization of masses is based on their shape, density, and margins. Regarding the shape, masses could be round, oval, lobular, or irregular as shown in Figure 2.2. The margins can be described as circumscribed (well-defined with clearly demarcated borders), or obscured (margins are not clear because of overlapping by adjacent tissue). With regard to density, masses could be either of high density, low density, equal density, or fat containing. This categorization helps radiologists in the precise description of masses found in mammograms and in commenting on masses as either benign or potentially malignant (Sample, 2003) (Rangayyan, 2005).
14
Architectural distortions on a mammogram basically refer to a disruption in the normal radiating or arbitrary pattern of the parenchyma. With no visible centre or mass, they are very variable and hence very difficult to detect (de Cruz, July, 2011).
2.2.2 Mammograms Projection
The mammograms have two important projections of the breast:
a) Medio-Lateral Oblique side view: this facilitates making almost the whole breast visible commonly including lymph nodes which taken at an angle. In this view, the pectoral muscle will appear in the upper part of the mammogram images.
b) Cranio-Caudal view: CC view is one of the two standard projections in a screening mammography. The CC view is taken from top to bottom. It must show the medial part as well the external lateral portion of the breast as much as possible (Varjonen, et al., 2007). Figure 2.3 illustrates the two most common types of breast projections.
a- Medio-Lateral Oblique b- Cranio-Caudal
Figure 2.3: Mammogram Projections
2.2.3 Breast Image Reporting
BI-RADS are an acronym for Breast Imaging- Reporting and Data System. It was developed by the American College of Radiology (ACR). The system is designed to standardize reporting. Each category provides the overall assessment related to the findings and the necessary follow up. The radiologist assigns a BI-RADS category 0 to 6 as the final imaging result (Eberl, et al., 2005) (Hashimoto, 2008)
Category 0 Incomplete Assessment: this type needs more imaging evaluation or prior mammogram images for comparison.
15
Category 2 (Benign Finding): this type is negative mammogram images. Although in some cases, the radiologist may find something and describe it as calcified fibro adenomas, or fat-containing lesions such as (oil cysts)…etc. The mammogram did not show any evidence of malignancy.
Category 3 (Probably Benign): Initial follow-up suggested.
Category 4 (Suspicious abnormality): Biopsy should be considered.
Category 5 (Highly suggestive of malignancy): Appropriate action should be the probability of being cancer.
Category 6: The biopsy-proven malignancy mammogram.
2.2.4 Challenges in Reading Mammogram
The difficulties faced by radiologists when detecting breast abnormality on mammograms images is based on some factors such as the resolution of the mammogram and the location of the abnormality within the breast tissue. Generally, the smaller the size of the lesion and the more deeply situated within a dense breast tissue the more difficult is its detection by the radiologist. As a result, it might be necessary to take several other images from different views to help the radiologist in making a diagnosis. It is worth mentioning that the younger the patient, the more difficult it is to detect a lesion on a mammogram; this is because younger patients have denser breast tissues, and this will hinder the process of detecting lesions on mammograms. In most of these cases, it would be very important a biopsy taken in order to arrive at the final diagnosis since diagnosis by the mammogram is difficult.
Many statistics show that 30% of breast cancers are undetected (Elshinawy, 2010). Double reading is needed to reduce the rate of missing cancers among radiologists. Double reading means that two radiologists will read the same mammogram. This method has been proven to overcome or reduce the missing rate of cancer but with a major drawback which is the high cost and work load on radiologists.
Because of the aforementioned difficulties, radiologists hold regular meetings to assess their performance in interpreting mammograms. This is conducted via asking a number of radiologists to interpret a set of mammograms, and each radiologist is asked to write his/her report. Reports from all the radiologists are then compared and plotted on a curve to rate the individual performance of each of them. This procedure sheds light on the fact that two different radiologists might comment differently on the same
16
mammogram especially if the target lesion is small or obscured by dense breast tissue (Elshinawy, 2010) (Bozek, et al., september, 2008).
2.3
CAD Systems
In the following section, we explain the general idea about the Computer Aided-Detection and Diagnosis systems (CAD), followed by CAD architecture of the mammogram system. Finally, we present statistical measurements such as Sensitivity, Specificity, and Accuracy that are used to evaluate the performance of CAD algorithms.
2.3.1 What is a CAD System?
Double reading of mammograms has been applied to reduce the proportion of the misclassified cancers; this is performed by two radiologists read the same mammogram images. However, the workload and cost associated with double reading are relatively high. Instead of double reading, a Computer Aided Detection and Diagnosis system (CAD) is used as a second reader and the final decision is made by the radiologist, which is referred to as the “second pair of eyes of the radiologists”.
The CAD system employs digital image processing procedures to detect a variety of abnormalities in mammogram images including calcifications, masses, and architectural distortion. Expert radiologists can benefit from such procedures that can be of great benefits to early detection of breast cancer which can consequently lower mortality rate among women with breast cancer (Tang, et al., 2009) (Brown, et al., 1996).
The Food and Drug Administration of United states (FDA of U.S) has approved commercially available computer aided detection and diagnosis systems to aid radiologists. Examples of commercial CAD system are iCAD and R2 Technology ImageChecker®. The iCAD is designed to help radiologists and other health care providers detect cancer early.R2 Technology ImageChecker®, is a software application used by radiologists for analyzing two dimensional digital mammography images. This system is designed to search for features that may be associated with breast cancer and mark them (Senthilkumar & Umamaheswari, 2011). Here, an asterisk is used to mark masses while microcalcification clusters are marked with a triangle.
17
2.3.2 CAD Architecture
Computer-Aided Detection and Diagnosis is designed to provide the radiologist with visual prompts on series of mammograms. When the detection algorithm identifies a suspicious lesion that necessitates further assessment, the system marks those areas on the mammogram to highlight them. This way, the radiologists' interpretations will be complemented. A typical CAD scheme includes the following main stages: Pre-processing, Segmentation, Feature extraction (analysis), and Classification. Figure 2.4 shows the typical processes of CAD system (Masala, 2006) (Costaridou, 2005).
Figure 2.4: CAD architecture
In the pre-processing step, the subtle features of interest are enhanced and the unwanted characteristics of the image are de-emphasized. The better description of the objects of interest as a result of the enhancement improves the sensitivity of the detection system. In the pre-processing step, the contrast of the region of interest is enhanced, the margins of abnormalities are sharpened, and noise suppression is performed (Costaridou, 2005).
In the segmentation step, segmentation algorithms have two important principal purposes. The first one is the segmentation methods used to separate the abnormality in the mammogram images from the normal tissue. The second one is the segmentation methods used to split the mammogram image to different components
Pre-processing
Segmentation/Detection
Feature Extraction
18
(background, breast tissue, and pectoral region). The breast tissue is segmented from the image to reduce the amount of image to be analysed by follow-on steps in screening (Sample, 2003).
Feature extraction is one of the most important parts of the system that effect the CAD performance. Researchers in this field investigate two feature types: (i) those traditionally used by radiologists (gradient-based, intensity-based and geometric features). (ii) high order features that may not be as intuitive to radiologists such as (texture features). An important issue in any CAD system is selecting the best type of features to classify the mammogram images. Taking the single type of feature might not be significant for the classification accuracy but when combined with another type of features might be very significant. The success of classification tasks depends on the use of the most discriminating features. The availability of a large set of features that can be extracted from mammograms necessitates the use of carefully designed feature selection schemes that aim to select an appropriate smaller feature subset of the available set of features, that leads to improved classifier performance (Masala, 2006).
The classification represents the last step and involves classifying suspicious areas of mammograms into their types such as normal, benign, or malignant tissue. The same classification techniques used in another field of image processing and pattern recognition used for mammograms as well such as Neural networks, Bayesian belief network, Supported vector machine, and K-nearest neighbour. One problem in this manner is how to select the extracted features suitable for various classifiers (Zhang, et al., 2008).
2.3.3 Evaluation of CAD System
The statistical measures of the performance of detection algorithms generally use three indices: sensitivity, specificity and accuracy:
Sensitivity: is the proportion of women positively diagnosed by CAD system as having breast cancer out of those truly diagnosed as having breast cancer by the gold standard test.
𝑆𝑒𝑛𝑠𝑖𝑡𝑖𝑣𝑖𝑡𝑦 = 𝑇𝑟𝑢𝑒 𝑃𝑜𝑠𝑖𝑡𝑖𝑣𝑒 (𝑇𝑃)
19
Where: True positive (TP) means results obtained by CAD system identifying cancer cases are compatible with the gold standard diagnostic test results, and false negative (FN) means the pathological cases missed by CAD system.
Specificity: is the proportion of women truly diagnosed as not having breast cancer and left alone by CAD system.
𝑆𝑝𝑒𝑐𝑖𝑓𝑖𝑐𝑖𝑡𝑦 = 𝑇𝑟𝑢𝑒 𝑁𝑒𝑔𝑎𝑡𝑖𝑣𝑒 (𝑇𝑁)
𝑇𝑟𝑢𝑒 𝑁𝑒𝑔𝑎𝑡𝑖𝑣𝑒 (𝑇𝑁) + 𝐹𝑎𝑙𝑠𝑒 𝑃𝑜𝑠𝑖𝑡𝑖𝑣𝑒 (𝐹𝑃) (2.2)
Where: True negative (TN) means the CAD system results were compatible with the conventional results as not having the disease, and false positive (FP) means cancer cases been identified by CAD system despite the fact that they are not cancer by the gold standard test. Since sensitivity and specificity are proportions, their value will range between 0 and 1; when the value of sensitivity is equal to 1, it means that all cases detected as abnormal are actually abnormal in reality. Similarly, when the value of specificity equals to 1, this means that all cases diagnosed as normal are in fact normal in reality (Shinde, 2003) (Lee, December, 2006) (Yacoub, et al., 2006). We can represent the above terminologies by Table 2.1.
Table 2.1: CAD system evaluation terminology
Gold Standard Positive (Biopsy demonstrated
malignancy) Negative (Biopsy demonstrated Benign)
CAD Positive TP FP
Negative FN TN
To further explain sensitivity and specificity in the context of CAD system, an example is assumed where we have 1000 women to be tested by CAD system. The result of biopsy shows that 800 of the cases are positive (malignant), and 200 of the cases are negative (benign). The result of CAD system is as shown in Table2.2.
20 Table2.2: CAD measure example
Gold Standard Positive (Biopsy demonstrated
malignancy) Negative (Biopsy demonstrated Benign)
CAD Positive
700 50
Negative 100 150
Therefore: Sensitivity= (700/800) = 0.875, i.e. out of 100 women screened by CAD, 87.5% will be truly positive, and 12.5% will be falsely negative i.e. will receive false reassurance and the disease progress to advance stages before being diagnosed later which adversely affect prognosis.
Specificity= (150/200) =0.75, i.e. out of 100 women screened by CAD, 75% will be truly negative while 25% will be falsely positive. Those false positive cases might receive unnecessary investigation and treatment wasting avoidable resources. Moreover, the diagnosis will put unnecessary stress on the patients and their families (Akobeng, 2007).
Accuracy: is the proportion of true results to the total number of cases (normal and abnormal). It is a testing parameter defined as follows:
𝐴𝑐𝑐𝑢𝑟𝑎𝑐𝑦 = (𝑇𝑃 + 𝑇𝑁)
(𝑇𝑃 + 𝐹𝑃 + 𝑇𝑁 + 𝐹𝑁) (2.3)
2.4
Mammogram Image Databases
We need to use a database of mammogram images for a reasonable size population in order to test the performance of any mammogram classification scheme. These tests are conducted according to certain protocols of separating mammograms to testing and training sets for classification purpose that is decided according to one of the mammogram classifiers. There are a number of benchmark mammogram databases that have been recorded for the purpose of experiments; each meets certain criteria regarding structure/kind of the mammograms (Dense, Fatty, or glandular) and (normal, benign, or malignant).
In this thesis, we used the two most commonly used mammogram databases that are publicly available for research purposes; the Mini Mammographic Image Analysis Society (Mini-MIAS) and the Digital Database for Screening Mammography (DDSM). The choice of these databases is based on the fact that, in our application, we face difficulty to collect real cases. On the other hand, we aimed to use mammograms that
21
are not captured in controlled conditions, and these databases include sufficient noise and low resolution problem, to investigate challenges in such kind of databases for the researchers.
2.4.1 Mini-MIAS Database
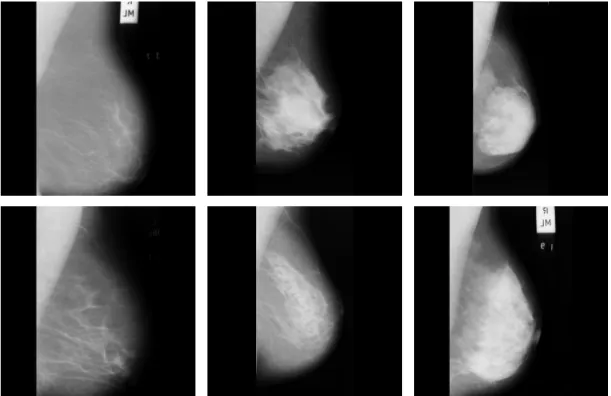
The MIAS database is freely available for scientific research purposes (Suckling, et al., 1994). The database consists of 322 mammograms gathered from 161 pairs of Medio-lateral oblique (MLO) views (right and left view). Mammograms originate from a film-screen imaging process in the United Kingdom, National Breast Screening Program (Suckling, et al., 1994). Originally, the MIAS Database images were digitised at 50 micron pixel edge, but were reduced to 200 micron pixel edge and clipped/padded for of research purposes so that every mammogram is of size 1024 × 1024 pixels resolution with 8-bits per pixel. The new reduced mammogram database called is Mini-MIAS. Depending on the intensity of the mammograms, the database is partitioned into three classes: fatty, glandular and dense. There are 106 fatty mammograms (67 normal and 39 abnormal), 104 glandular mammograms (67 normal and 37 abnormal) and 112 dense mammograms (76 normal and 36 abnormal). Two example mammograms of each class are shown in Figure 2.5.
Figure 2.5: Examples of different tissue types available in the Mini-MIAS database
22
The database includes different types of abnormalities, including calcifications, well-defined Spiculated or ill-well-defined masses, architectural distortion or asymmetry. The severity of each abnormality is also descried, i.e. benignancy or malignancy.
2.4.2 DDSM Database
The commonly used Digital Database for Screening Mammography (DDSM) is a benchmark for testing new proposals dealing with processing and analysis of mammograms for breast cancer detection (Heath, et al., 2001). It contains 2620 cases, each with mammograms captured from four views (Medio-Latral Oblique and Cranio Caudal) for each case. The mammograms were obtained from Massachusetts General Hospital, Wake Forest University School of Medicine, Sacred Heart Hospital and Washington University of St. Louis School of Medicine. The database was completed in the fall of 1999. Original images were digitised with three different sampling rates (i.e. 42, 43.5, and 50 micron pixel edges) with different resolutions and two different grey levels (12 or 16 bits per pixel). For experimental purposes, most researches fixed the size of images cropping and converting the grey levels to only 8-bits grey values. Images containing suspicious areas have associated pixel level "ground truth" information about the locations and types of suspicious regions. Some samples of the ROIs are shown in Figure 2.6.
23
Chapter 3
Literature review
Several types of research in the area of computer aided detection and diagnosis systems are available, each of the researches discuss the area depend on their view of the subject. Clearly, it is impossible to include all existing approaches in this chapter. We here focus on publications and works related to our research and provide a brief description of the main points of the approaches. We separated our literature into three main parts. Firstly in Section 3.1 we review CAD breast systems, in general, how CAD systems work and the different problems or limitations they have. Section 3.2 reviews the literature on pre-processing techniques used in automatic mammography systems. This is followed by a review of feature extraction and classification techniques used for mammogram analysis. Finally, the chapter concludes with a brief summary of the overall literature review.
3.1
General CAD System
Computer-aided detection and diagnosis systems play a key role in the early detection of breast cancer and help to reduce the mortality rate and increase the survival rate (Tang, et al., 2009). Subramaniam et al. (Subramaniam, et al., 2006), presented and described a multi-components (referred to as categories) system that they developed for breast cancer diagnosis. The data extraction category discusses methods to improve the process of obtaining breast tissue and record mammogram and MRI (Magnetic Resonance Imaging) in order to aid the medical personal to interpret the images obtained from the breast. They also describe adequate ways of data interpretation that help improving diagnosis. Miscellaneous components are focused on implementing telemedicine in breast diagnosis systems.
Digital image processing techniques play an important role in helping to perform breast biopsies. The role is more for abnormal regions that cannot be felt but can be seen or detected using a conventional mammogram or with using ultrasound. Therefore, before we design a CAD system we need to have knowledge about the differences between
24
normal breast and abnormal breast tissues. In (Das, et al., 2009) comparison between normal breast tissue and malignant invasive breast tissue was conducted using a series of image processing steps. The comparison also included normal ductal epithelial cells versus ductal / lobular invasive carcinogenic cells. Rangayyan et al. (Rangayyan, et al., 2007) presented an overview of digital image processing and pattern analysis techniques which aimed to address several areas in a CAD system used to detect breast cancer such as: contrast enhancement, detection and analysis of calcifications, detection and analysis of masses and tumours, analysis of bilateral asymmetry, and detection of architectural distortion. In (Bozek, et al., september, 2008) a description of the lesions that could be detected and diagnosed utilizing developed computer-aided detection and diagnosis methods were made. This paper point out further developments is required in CAD algorithms to improve the detection and diagnosis of breast abnormalities using computers.
Masala (Masala, 2006) presents a broad outline of Computer Aided Detection and highlights how CAD systems are correctly used. It also outlines the typical situation where CAD systems can be utilized in the most helpful way. The design of the CAD software for mammography falls within the framework of the MAGIC-5 collaboration. A comparison is made between the newly designed CAD software and the commercial CAD. But (Tang, et al., 2009) is aimed at providing an overview of CAD systems and related techniques developed in recent years, the latest progress that have been achieved in the development of CAD systems and related techniques. Thereafter, the focus will be on the chief CAD techniques developed lately for breast cancer, including detection of calcifications, detection of masses, detection of architectural distortion, detection of bilateral asymmetry, image enhancement, and image retrieval.
In the review paper (Senthilkumar & Umamaheswari, 2011), Computer aided detection and diagnosis are discussed given the mammography-based approach. Here,