Maturing Software Engineering Knowledge
through Classifications:
A Case Study on Unit Testing Techniques
Sira Vegas, Natalia Juristo, and Victor R. Basili
Abstract—Classification makes a significant contribution to advancing knowledge in both science and engineering. It is a way of investigating the relationships between the objects to be classified and identifies gaps in knowledge. Classification in engineering also has a practical application; it supports object selection. They can help mature Software Engineering knowledge, as classifications constitute an organized structure of knowledge items. Till date, there have been few attempts at classifying in Software Engineering. In this research, we examine how useful classifications in Software Engineering are for advancing knowledge by trying to classify testing techniques. The paper presents a preliminary classification of a set of unit testing techniques. To obtain this classification, we enacted a generic process for developing useful Software Engineering classifications. The proposed classification has been proven useful for maturing knowledge about testing techniques, and therefore, SE, as it helps to: 1) provide a systematic description of the techniques, 2) understand testing techniques by studying the relationships among techniques (measured in terms of differences and similarities), 3) identify potentially useful techniques that do not yet exist by analyzing gaps in the classification, and 4) support practitioners in testing technique selection by matching technique characteristics to project characteristics.
Index Terms—Classification, software engineering, software testing, test design techniques, testing techniques, unit testing techniques.
Ç
1
I
NTRODUCTIONS
OFTWAREEngineering (SE) has aspects that disqualify it as a genuine engineering discipline [8], [11]. A promi-nent point is the immaturity of the theoretical knowledge in some areas of SE [1], [15], [19]. In science and engineering, knowledge matures as the investigated objects are classi-fied. Mature knowledge is not a sequential heap of pieces of knowledge, but an organized structure of knowledge items, where each piece smoothly and elegantly fits into place, as in a puzzle. Classification groups similar objects to form an organization. Examples are the classification of living beings in the natural sciences, diseases in medicine, elements in chemistry, architectural styles in architecture, materials in civil engineering, etc.Classifications have advanced knowledge in three ways as the following:
. By providing a set of unifying constructs. Such constructs systematically characterize the area of research [28]. To facilitate knowledge sharing,
disciplines typically develop classifications. These classifications then provide a common terminology for communication.
. By understanding interrelationships[18], [22]. For example, the periodic table of elements that Mendeleyev built in the 1860s had a profound impact on the understanding of the structure of the atom. On the contrary, it is hard to pigeonhole bacteria within the classification of living beings because relatively little is known about them [30]. . By identifying knowledge gaps. For instance, the
gaps in the classification of chemical elements prompted a search for further knowledge. Properties of elements like gallium and germanium were predicted before they were discovered years later [13]. However, classifications can serve other purposes apart from providing a useful organization of knowledge. In medicine, for example, the classification of diseases has two main aims: prediction (separating diseases that require different treatments) and provision of a basis for research into the causes of different types of disease. In the case of engineering, this other purpose is usuallydecision making support.
We believe that classifications can help mature SE knowledge in the same way as classifications further knowledge in other fields of science and engineering. Classifications structure a body of knowledge within a field, enabling researchers and practitioners to generalize, communicate, and apply the findings [28]. The information organized as a classification is a step higher on the knowledge maturity ladder than separate pieces of in-formation, as it can be more easily understood and more efficiently retrieved. More to the point, SE can benefit from
. S. Vegas and N. Juristo are with the DLSIIS, Facultad de Informatica, Universidad Politecnica de Madrid, Campus de Montegancedo, 28660, Boadilla del Monte, Madrid, Spain. E-mail: {svegas, natalia}@fi.upm.es.
. V.R. Basili is with the Department of Computer Science, University of Maryland, 4111 A.V. Williams Building, College Park, MD 20742, and the Fraunhofer Center for Experimental Software Engineering-Maryland, Fraunhofer USA, Inc., 5825 University Research Court, Suite 1300, College Park, MD 20740-3823.
E-mail: [email protected], [email protected].
Manuscript received 25 Feb. 2008; revised 2 Jan. 2009; accepted 13 Jan. 2009; published online 29 Jan. 2009.
Recommended for acceptance by A. Bertolino.
For information on obtaining reprints of this article, please send e-mail to: [email protected], and reference IEEECS Log Number TSE-2008-02-0086. Digital Object Identifier no. 10.1109/TSE.2009.13.
classifications because, today, the information about the different elements making up SE (techniques, methods, and processes) is unconnected. At best, you can pick up separate pieces of information from books and research papers. In other cases, the information is in the shape of experience (of the people who have used these elements). At worst, there is no information at all. This means that, at present, there is nothing (a classification would be a good place to start) offering a consistent description of the SE elements according to standard parameters. So, it is not easy to create a good picture of the relationships between the separate elements, identify what information is missing, and make systematic selections.
A number of different objects have already been classified in the field of SE. Noteworthy is Bass et al.’s classification of architectural styles [2]. This classification was designed to unify software system architecture descriptions, provide developers with information about a particular style, and offer guidance for selecting the styles that are to dictate the design of a software system. Maiden and Rugg [16] present a classification of requirement elicitation methods to ease the selection of methods and help developers set up an acquisition program. Glass et al., [9], [10], Ramesh et al. [20], and Vessey et al. [28] outline a classification of the state of research in the fields of Computer Science, Software Engineering, and Information Systems. Chillarege [5] describes a classification of defects aimed at rapidly capturing the semantics of each software defect. Finally, the SWEBOK [12] is a classification of the knowledge now available in the field of SE. The SWEBOK was designed to provide a consensually validated char-acterization of the bounds of the discipline and topical access to the underlying body of knowledge.
However, populating a classification is a community effort, as the classification of living beings in the natural sciences is. Linneaus began the current classification of living beings in the late 18th century. The original classifica-tion was and is being added to and reorganized, due to inputs from thousands of researchers who have contributed, are contributing, and will contribute to its apparently unlimited growth [24]. The same applies to other classifica-tions like the periodic table of elements in chemistry [13].
Due to the breadth of SE knowledge, any attempt at classifying all knowledge would be an immense under-taking for just one research group. It is really something that should be undertaken as a community effort like the SWEBOK project [12]. We have confined our effort to one SE topic, testing technique technology. We use this topic to exercise our approach for building SE knowledge classifica-tions. The testing area can benefit from a testing techniques classification. Today, there is a multitude and diversity of items to be classified, and testing techniques meet the conditions that illustrate the difficulties and benefits of classification in SE.
We propose an initial classification of testing techniques using a set of the unit testing techniques available today. Note, however, that, although directly applicable to testing techniques, the approach we have followed in this research can be applied to other classifications of SE objects.
There are a few classifications of testing techniques [4], [7], [31], but they were not built for the same purpose as ours. There are actually different ways of classifying
things depending on the purpose of the classification. Hence, there is no one universally correct classification for a set of knowledge; the classification depends on what the knowledge is being classified for.
The remainder of the paper is organized as follows: Section 2 reviews some of the existing testing technique classifications. Section 3 presents the proposed testing technique classification and the steps used to create it. This is a generic process and can be applied to generate other SE classifications. Section 4 shows how the proposed testing technique classification gives a detailed systematic char-acterization of testing techniques, and how to use the classification: to get a better understanding of the relation-ships between the classified techniques, to detect missing knowledge, and for the purposes of selection. Finally, Section 5 sets out some conclusions.
2
C
URRENTT
ESTINGT
ECHNIQUEC
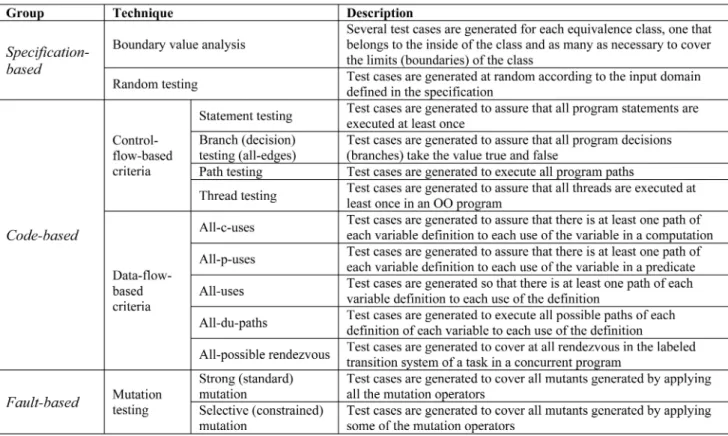
LASSIFICATIONSThree testing technique classifications have been proposed to date: one by Bertolino for the SWEBOK [4], another by Glass [7] (both covering all testing stages), and the third one by Zhu et al. [31] (covering unit testing only). Strictly speaking, there is a fourth classification: the classical classification used in testing textbooks. It is based on whether or not implementation knowledge is needed to apply the technique. When no implementation knowledge is used, the technique is black box; when implementation knowledge is required, the technique is white box.
Bertolino’s classification, shown in Table 1, considers just one criterion. It accounts for how the technique generates test cases and has six possible values: testers’ insight and experience, specification, code structure, faults to be discovered, field usage, and application type.
Glass’ classification, shown in Table 2, also considers a single criterion. It is related to the goal of the techniques (testing all requirements, testing the structure of the program, etc.). It takes four different values: requirements-driven, structure-requirements-driven, statistics-requirements-driven, and risk-driven.
Zhu et al.’s classification, shown in Table 3, classifies the techniques according to two criteria. The first criterion is based on the source of information used to generate test cases (similar to Glass’ goal). This criterion can take four different values (which can be traced back to the traditional black/white box classes): use of specifications, use of interface, use of the program, or use of a combination of the program and its specifications. The second criterion is based on the underlying testing approach (similar to how Bertolino’s tests are generated) and has three possible values: based on code structure, based on program faults, and based on programmer errors. Note that, after classification, one of the groups (interface-based techniques) is empty.
Note that, though these classifications agree on some criteria, their values are different. This leads to different testing technique classifications. Additionally, Bertolino’s and Zhu et al.’s classifications list types of testing techniques, not actual testing techniques. A type or group of testing techniques covers a set of techniques that have some features in common.
These classifications are valuable contributions to the testing field, as they provided the groundwork for testing
technique research. This paper extends what they started by adding more criteria to take into account other knowledge about the technique, like when to use it, who can use it, where it can be used, etc., and imitating the classifications of
chemical elements and living beings, by having a single item at the end of each classification.
Robillard distinguishes two types of knowledge [21]: topic (dealing with the meaning of concepts) and episodic
TABLE 2
Glass’ Classification of Testing Techniques TABLE 1
Bertolino’s Classification of Testing Techniques
TABLE 3
(dealing with the experience using the knowledge). As engineering classifications deal with practical matters, it is reasonable to expect an SE classification to contain both topic and episodic knowledge.
3
A C
LASSIFICATION FORS
OFTWARET
ESTINGT
ECHNIQUESTo get a classification that fulfills the four targeted purposes, we enacted a three-step process: 1) identify the underlying classification criteria; 2) search and analyze the sources of information required to give value to the classification criteria for each technique; and 3) instantiate and accordingly order the classification criteria for the techniques that are being classified. The output of this process is the classification of the selected techniques.
The first step is of vital importance, as the success of the classification depends on the selected set of classification criteria. We took an iterative and empirical approach to this, which led us to a useful set of classification criteria. The process is described in more detail in Section 3.1.
When a set of classification criteria has been decided on, the information required to give value to the criteria for each technique to be classified has to be gathered. This search for information will also refine the set of classifica-tion criteria. Criteria about which no informaclassifica-tion is yet available or for which the pinpointed information is unreliable will be removed from the set. This step is detailed in Section 3.2.
Finally, the classification itself is put together. This includes instantiating each criterion of the set of classifica-tion criteria for the techniques being classified and establish-ing an order within the set. Instantiation also allows criteria refiltering by deleting any that are not discriminatory (i.e., all of the techniques belong to just one group) or are redundant (i.e., classify the techniques identically). Criteria ordering involves studying the selectivity of each single criterion. Partial classifications of techniques for each criterion are then combined to get an overall classification arranging the criteria in order. This step is detailed in Section 3.3.
This is a generic process insofar as it can be used to classify any SE object and not just testing techniques, as can be seen throughout the section.
3.1 Development of the Classification Scheme
The most straightforward technique for generating a classification scheme (a set of criteria on which a classifica-tion is based) is to examine a significant number (a number that is large, disparate, and yet similar enough to guarantee a relatively stable classification scheme) of the objects for classification and look at the similarities and differences between them. This is actually how the criteria in the classifications discussed in Sections 1 and 2 were put together and provided a guideline for our approach.
Here, we provide some details and justification of our approach to make this paper self-contained. Further details can be found in [25] and [27]. Our approach began with a literature review in search of knowledge (theoretical and empirical) about testing techniques. Based on an extensive literature search in SE, testing and empirical journals and conferences, we identified 69 relevant papers corresponding to 47 studies (13 theoretical, 32 empirical, and two
simula-tions). The studies were grouped into five categories: eight studies on relationships between structural techniques, five studies on data flow techniques, nine studies comparing random and partition techniques, four studies comparing functional and structural techniques, four studies on muta-tion techniques, 11 studies on regression techniques, two studies on minimization techniques, and four other studies. We found the following:
. The studies covered a limited universe of testing techniques and did not identify all the characteristics of interest about those testing techniques, e.g., information about the effectiveness of the techniques was missing in many cases.
. There were few characteristics of pragmatic use to developers, e.g., there was little or no discussion of cost of application. Comparing objects by observa-tion only detects the criteria that cause the most prominent differences, whereas others are missed. This approach could also lead to a classification that researchers think is useful for supporting practitioner decision making, but which practitioners would regard as not really interesting because it does not take into consideration episodic information.
In an attempt to find a pragmatic solution for the above shortcomings, we decided to use other methods to supple-ment the literature review. The next step was to seek out the opinions of researchers and practitioners in the testing area. This generated a second scheme. This scheme was built after holding a series of interviews to find out what the interviewed subjects are likely to need to know about a testing technique for selection purposes. The scheme was developed incrementally, i.e., the criteria of researchers and practitioners were gradually added. If the meaning of a criterion suggested by the interviewee was in any way ambiguous, we asked the subject to give a better explana-tion or some examples.
A key issue at this stage was to determine how many individuals needed to be interviewed as well as what characteristics they should have. This is equivalent to the sampling problem in statistics. Of the different types of sampling [14], we opted for nonprobabilistic judgment sampling. This way, subjects were not chosen at random. As the potential subjects are busy people, we targeted subjects that were willing to cooperate. Because we applied judgment sampling, sample representativeness was achieved by interviewing “typical” subjects. We defined typical subjects from the profiles of people working in testing using the following attributes: employer, job, education, SE, and testing and job experience.
To maximize the representativeness of the sample for the population, we chose 17 subjects from different employers (three from universities, two from university-associated research centers, and 12 from software companies of different sizes), holding different positions (three profes-sors, five software department managers, two project managers, six developers, and one scientist), with varying levels of job experience and expertise in software testing issues. Experience varied in terms of planning to execution of the test processes across various test techniques; qualifications ranged from bachelor’s to doctorate degrees in computer science, physics, and electrical engineering; and software development experience ranged from 3 to 22 years, the mean being 12 years.
To determine if our sample size was sufficient for the results to be representative, we conducted a stability analysis of the classification scheme generated throughout the interview process. This second scheme reached 50 per-cent of its final size with the first interviewed subject, rising to 80 percent after the second. The scheme reached 100 percent after the 10th respondent, so the last six subjects interviewed (37.5 percent of the total) added no new information to the scheme. At this point, the scheme was considered as stable and interviewing stopped. This supported sample sufficiency.
The criteria of most interest to the interviewed subjects in descending order were the existence of tools (identifier), the application costof the technique, theinputsof the technique, and the knowledgerequired to apply the technique.
After interviewing subjects, we merged our literature-derived scheme with the researchers’ and practitioners’ opinions to create a single scheme.1The scheme built after synthesis was sent to a series of experts2in the testing area
(out of 12 requests, only four replied) along with a
questionnaire. This step helped identify redundancies and interdependencies between criteria and let to a compaction of the scheme.
The approach used to obtain the classification scheme is iterative and generic. It can be enacted by other SE researchers interested in building classification schemes containing useful criteria. Table 4 shows the resulting classification scheme.
To make our classification scheme easier to understand, we arranged the criteria around two perspectives related to the type of information they represent. The first group of classification criteria—operational—is linked to how the technique works, whereas the second group—historical— refers to experience in using the technique. The classifica-tion criteria were further grouped by aspects. The aspects make it easier to locate any criterion within the scheme, as they represent the concept that each criterion refers to. The operational criteria were grouped around five aspects that refer to the features of thetechnique, the results of applying the technique (test cases), the software (object) on which to apply the technique, the tools available for using the technique, and the subjects (agents) considered qualified to use the technique. The criteria related to experience using the technique or historical criteria were grouped around two aspects: earlier projects in which the technique has been used and the satisfaction that the technique merits among people who have used it before. The perspectives, aspects, and criteria are listed in the first three columns of Table 4, respectively.
TABLE 4
Classification Scheme for Testing Techniques
1. The fact that the scheme we generated did not contain an attribute that appeared in the scheme after interviewing researchers and practitioners (or vice versa) does not necessarily mean that this attribute is unimportant or unnecessary. The omission could be a mistake or oversight. Likewise, there is no way of knowing which attributes are not necessary (we did not ask for this information).
2. An expert is a person of high international repute in the area of testing, with lengthy experience in both the theory and practice of the testing process and knowledge of the people involved in this process. They have experience mainly as researchers, although some are also experienced developers.
The grouping of classification criteria around perspec-tives and aspects is generic too. Any SE classification can be arranged hierarchically as perspectives and aspects, although they will not necessarily be the same as the ones listed here.
Finally, we took into account the meaning and implica-tions of the classification criteria as well as the information now available about the different testing technique metrics in order to choose the metrics to rate each criterion. The description and values column of Table 4 contains the meaning of each criterion and its possible values.
The source column in Table 4 traces each criterion of the classification scheme back to its source. R represents the information suggested by the researchers3and P represents the information suggested by the practitioners. Of the 30 classification criteria identified, 28 (93 percent) were suggested by the practitioners and 18 (60 percent) were put forward by the researchers. These results imply that practitioners are better at identifying episodic criteria. This is supportive of the original idea about the difference between topic and episodic knowledge and the importance of examining the viewpoint of both the researchers and practitioners to establish an SE classification covering both types of criteria. A classification based solely on the viewpoint of the researchers (ourselves included) would fail to incorporate episodic knowledge. On the other hand, a classification based solely on the practitioners’ opinions could leave out topic knowledge.
3.2 Search and Analysis of the Information Needed
Generally speaking, when searching for the information needed to instantiate a given classification scheme for a set of SE objects, the maturity level of the information available on the objects being classified is very likely to differ (it may range from very mature information to open research questions). We will only be able to use informa-tion that has attained a minimum maturity level for classification purposes.
To try out our proposal, we present a testimonial classification of a wide-ranging group of 13 testing techniques rather than an exhaustive classification of all testing techniques. To reduce the immensity of the task of classifying all testing techniques, we decided to focus on unit testing. We disregarded techniques that are not applicable at the unit testing stage and classified a number of unit testing techniques. To assure that the exercise would be useful, the techniques chosen for classification cover the whole spectrum of unit testing techniques. Based on Bertolino’s classification, described in Section 2, we selected a number of technique groups to cover the between-group variety of techniques and a number of techniques within each group to cover the within-group variety of techniques. Additionally, we chose well-known techniques. This gives a better understanding of how the scheme is instantiated. Table 5 describes the techniques covered here.
Column 6 of Table 4 characterizes each criterion’s knowledge maturity for this particular case. The classifica-tion criteria labeled asreliablerefer to criteria whose values are dependable and can be found in the testing literature.
TABLE 5 Classified Techniques
However, we came up against the following problems when attempting to assign a value to the other criteria.
Some values are unreliable. In testing books and research articles, one often comes across inconsistent (sometimes even contradictory) information on the value of some techniques for criteria likedependencies,repeatability, number of generated cases,effectiveness,andtype of defects.
Some values areunknown. Thecompletenessandprecision criteria cannot be rated at present. The knowledge regard-ing these criteria does not exist today, nor is there, to our knowledge, any ongoing research investigating what their values could be.
Metrics for assigning values to some criteria are not equivalent. This applies to theeffectivenessandtype of defects criteria. The sources of information provide different metrics from the ones applied in our classification, and the results of one metric cannot always be mapped to another. For example, some studies measure effectiveness not as a percentage of faults found by a technique (as required by the proposed classification) but as the like-lihood of finding one of all the faults in the software.
Some values arenotpubliclyavailable. The information contained in the historical perspective represents knowl-edge gained by organizations after using the techniques in real projects. However, this experience-related information is condemned to disappear unless it is recorded. Since most organizations do not now document this information, it is difficult to find.
For classification purpose, only mature criteria (listed as reliable in Table 4) can be taken into consideration in our analysis. Therefore:
. The historical perspective criteria have been re-moved because the values are unavailable.
. All the criteria of the test casesaspect as well as the dependencies andrepeatability criteria have also been removed, because they are listed in Table 4 as unknown or unreliable.
Additionally, we have omitted any criteria that, although mature, are informational rather than classification:sources of information, adequacy criterion, tool automation, cost, and environment. Finally, we left out the element criterion, because the value for all the techniques in this exercise would be unit testing (although some techniques could also have another value as they are not used exclusively for unit testing). So, there are mature criteria that can be removed from the classification schema because they are considered as informational.
3.3 Instantiation of the Classification Schema
This section describes the steps used to complete the final classification for unit testing techniques. First, we instan-tiated each classification scheme criterion for the objects being classified according to the information identified in the previous step. Then, we looked at how each separate criterion classified objects. This was designed to filter out possibly superfluous criteria (i.e., that do not discriminate techniques) or redundant criteria (i.e., that classify techni-ques in the same manner). Finally, we combined the criteria to arrange them in ascending order of discrimination and put together the final classification.
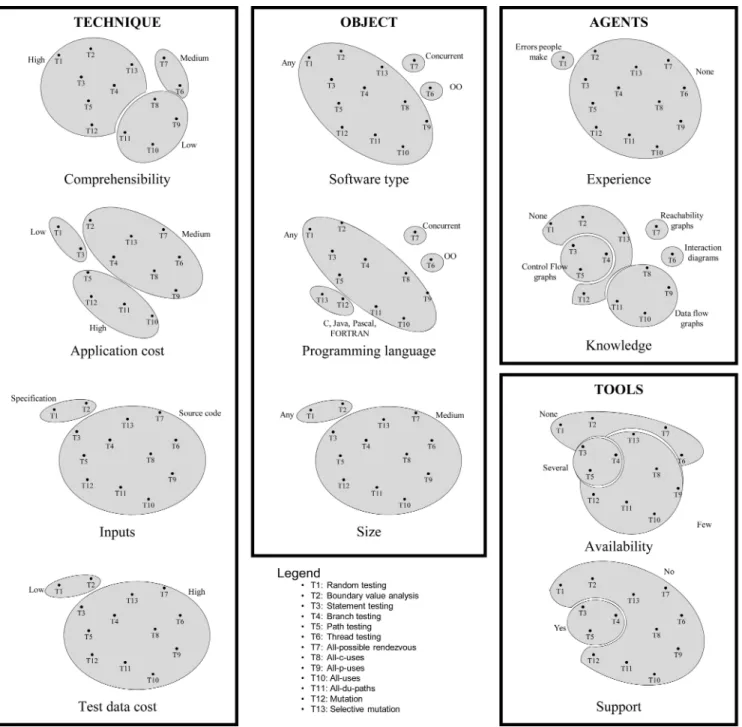
To assure that the instantiation of the 13 selected techniques for the classification criteria reflected the current knowledge about the techniques as closely as possible, we used the same bibliography as in the literature review described in Section 3.1. This included reviewing current knowledge about the testing techniques provided in theoretical and empirical studies as well as simulations. Fig. 1 shows the results of instantiating and grouping the techniques by criterion. Column 1 shows the resulting groups for the fourtechniqueaspect criteria. The groups for the three object aspect criteria are shown in column 2. Column 3 shows the groups for the two agents and tools aspect criteria.
The classifications shown in Fig. 1 illustrate some interesting points. First, we found that almost all the criteria classify the set of techniques differently. This means that almost all the criteria provide relevant information about the techniques. The exceptions are theinputs,size,and test data costcriteria. They classify the techniques identically (the random and boundary value analysis techniques in one group and the others in another). This might lead us to think that two of these three criteria are redundant or perhaps the three represent the same thing. As we are only classifying a subset of testing techniques rather than the whole universe, we will not venture to delete any criterion in this case.
We use the cluster analysis technique [6] to establish an order of priority among the different classification criteria depending on how selective they are. Numerical classifi-cation techniques like clustering originated primarily in the natural sciences, like biology and zoology, in an effort to rid taxonomy of its traditional subjectivity. Using clustering, the instantiated testing techniques are classified based on their similarities (expressed as distances).4 To calculate the distances between techniques, we assumed that all the criteria have the same weight. We have no objective reason to believe that some criteria are more important (and thus, have a greater weight) than others. The fact that a person failed to suggest a criterion during the interviews is more likely to be due to an oversight than objective unimportance.
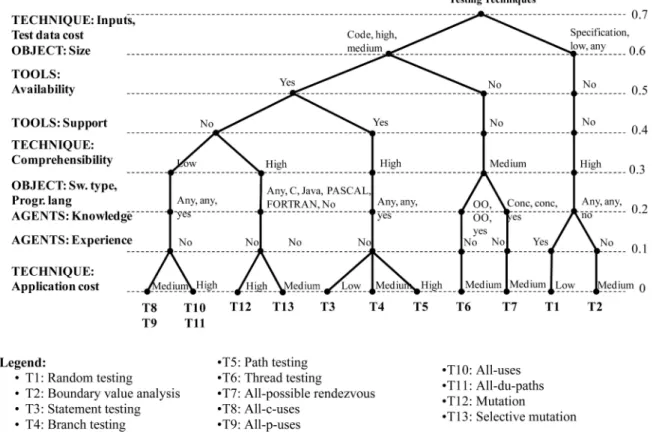
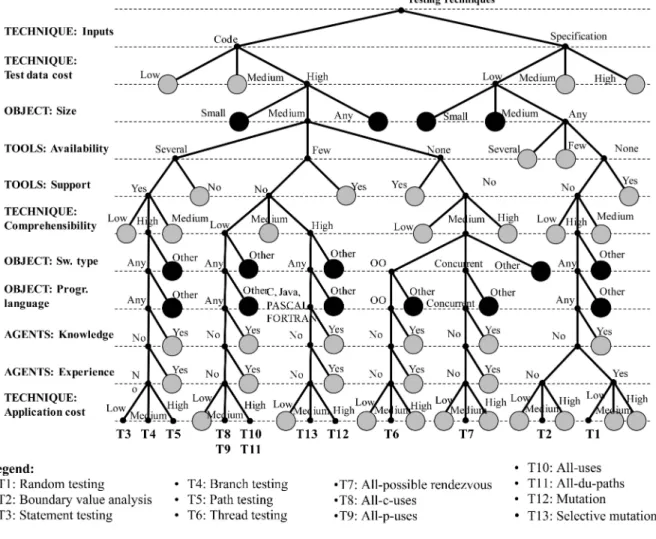
Fig. 2 shows the final classification for the 13 techniques. It shows a hierarchical tree-shaped diagram of the results of the clustering analysis. The items to be classified are arranged at the bottom of the graph. The unions between the items are represented by the meeting of two lines at the level specified by the distance between them, where 1.0 is the maximum permitted by the defined metric. It provides information about how selective the classification criteria are. The criteria are arranged along the vertical axis of the diagram, the least selective criterion appearing at the top and the most selective at the bottom. Note that more than one criterion may appear at any one decision point. This applies, for example, to the inputs, size, and test data cost criteria in this case, and is because they classify techniques in the same way (a point discovered in Fig. 1). Also, some
4. To do a cluster analysis, the distance between the items to be classified needs to be defined and the cluster strategy selected. The distance we used was the number of criteria with different values for two techniques over the total number of criteria. We used the complete linkage or farthest neighbor clustering strategy.
classification criteria may never appear. This would be the case for criteria that are not selective, as they have the same value for all the items being classified (this is out of the question in this case, as this type of criteria would have been deleted in the study of single-criterion classifications). Ranked in ascending order criteria selectivity is:inputs/ test data cost/size (all three at the same level), availability, support, comprehensibility, software type/programming lan-guage/knowledge (all three at the same level), experience, andapplication cost.
4
C
HECKING THEP
ROPERTIES OF THEC
LASSIFICATIONOur aim was to produce a classification that helps to mature and, therefore, advance SE knowledge. Such a classification
should systematically characterize the objects being classi-fied, help to understand the relationships among these objects, identify knowledge gaps, and support practitioner decision making. This section discusses how SE can benefit from the proposed testing technique classification. Sec-tion 4.1 examines the terms in which the techniques are described. Section 4.2 describes how classifications give an understanding of the relationships among the objects being classified. Section 4.3 analyzes how classifications can be used to predict knowledge gaps by pinpointing where information has been found to be missing from our testing technique classification. Finally, Section 4.4 discusses how classifications can be used for decision making purposes and presents some examples using the classification presented here.
Although the discussion presented here deals with the unit testing technique classification, this reasoning is extendible to any SE classification developed using the process defined in Section 3.
4.1 A Detailed Systematic Characterization of Testing Techniques
This section looks at whether we have built a classification that provides as detailed as possible a systematic char-acterization of unit testing techniques, covering and extending existing classifications. To check this point, we analyze the equivalences between the white/black box, Bertolino’s, Glass’s, and Zhu et al.’s classifications and those proposed here.
Bertolino’s and Zhu et al.’s classifications share the test case generation criterion. Their suggested values are differ-ent, but all are covered by four of our criteria. This means that our classification discriminates between features whose effect was confounded by Bertolino’s and Zhu et al.’s classifications. Bertolino’s classification based on tester’s insight and experiencevalue and Zhu et al.’serror-basedvalue are related to the knowledge and experience criteria of our classification. Bertolino’sspecification-based, code-based, fault-based,andusage-basedvalues, and Zhu et al.’sstructuraland fault-based values are covered by our inputs criterion. Finally, Bertolino’s based on application-type value is linked to oursoftware-typecriterion.
Zhu et al.’s, Glass’s, and the white/black box classifica-tions share thesource of informationcriterion, although they also provide different values but all are covered by three of our criteria. Again, our classification discriminates between features whose effect was confounded by Glass’s, the
traditional, and Zhu et al.’s classifications. Our classification suggests that techniques differ not only as regards theinput criterion but also as to thetest data cost, and the size criteria. Additionally,experienceandknowledgeare also important.
The implication of all this is that the test case generation and thesource of informationcriteria are not the only features determining technique membership of the same class. These features (the most striking) actually designate the value of many other features. This is a commonplace occurrence in classifications. Consider the classical division between men and women. According to Needham [17], the usefulness of this classification does not begin and end with all that can strictly be inferred from it (a statement about sexual organs). It is a very useful classification because classifying a person as a man or woman conveys a great deal more information about probable relative size, strength, endur-ance, certain types of dexterity, and so on. Similarly, the testing technique division associated with the inputs required to apply the technique actually implies many more features. These are primarily test data cost and softwaresize, but also, to a lesser extent (because they place some that would traditionally be white box techniques into the black box category), tool availability, or the need for specific knowledge to apply the technique. And the same applies to the division based on test case generation. It implies more features: knowledge, experience, inputs, and software type.
The existing classifications might appear to be simpler than and just as effective as a classification based on the equivalent criteria in our classification. But the fact is that, in classifying by one aspect only (technique inputs or test Fig. 2. Classification of testing techniques.
case generation), there is a risk of key information being missed due to oversimplification. If the other criteria are removed, that information is no longer available for describing and, of course, comparing the techniques.
Finally, one of our aims was to produce a selective classification, i.e., ending in a single technique. Fig. 2 shows that we have come very close to achieving this goal, as there are only two cases in which two techniques (T8 and T9—all-p-uses and all-c-uses—and T10 and T11—all-uses and all-du-paths) are classified identically. It is our belief that this is because we used only mature knowledge on testing techniques for the purpose of classification. We think that if we had been able to use all the proposed classification criteria (i.e., if the current knowledge on testing techniques were more mature), we would have discriminated between all techniques.
4.2 Understanding Testing Techniques
This section describes the relationships among testing techniques and testing technique groups by investigating the proximity and distance between the techniques and reaching conclusions about the distribution of the techni-ques and their rationale.
If we draw a horizontal line through Fig. 2 at a given distance level, we will get as many groups as lines we cut through. The resulting groups will be clusters whose elements are nearer together than the chosen distance. The groups that are formed will be identified by the values of those criteria that are above the cutoff line. The goal is to find the cut that makes more sense for the data you have (termed thebest cutin clustering analysis).
There are many ways of selecting the best cut. Everitt et al. [6] list around 10 different methods. Also they suggest that, given the lack of consensus about which rule to apply, the best thing to do is to follow Baxter’s advice [3]: “informal and subjective criteria, based on subject expertise, are likely to remain the most common approach.”
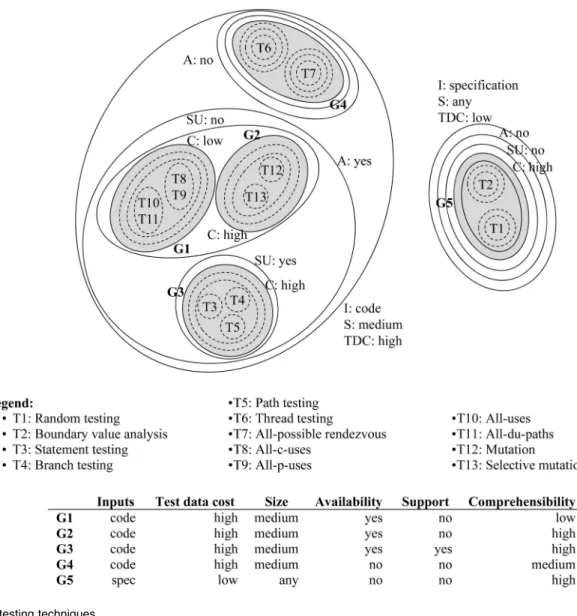
We used two indicators to get the best cut: 1) large distances in Fig. 2 (changes in fusion levels) and 2) multi-dimensional scaling (MDS) [23], as it provides a usable graphical display of the objects in a two-dimensional space. Superimposing both indicators encloses objects within closed boundaries, providing more insight into testing technique relationships. The result of applying this strategy led us to draw the cutoff line between 0.2 and 0.3 in Fig. 2. Fig. 3 illustrates this partition.
The points in the space represent the techniques. They are arranged so that the distances between the points in the space resemble the original differences or similarities as closely as possible. Each set boundary represents the cluster generated by each classification criterion. The classification criteria are arranged in order of selectivity: The least selective criterion is on the outermost set boundary and the most selective on the innermost. The shaded areas represent the five groups of techniques that we established. The groups that are inside the shaded areas (reflected by a dotted line in Fig. 3) match criteria that are not selective (criteria that are under the cutoff line in Fig. 2). The groups are defined by the inputs, test data cost,size,availability,support, andcomprehensibility criteria. This means that the criteria that best describe a unit testing technique are the ones that indicate the inputs required to apply the technique, the size of the software the technique can test, the tool market availability and support, and how easy it is to understand the technique.
Group 1 (all-c-uses, all-p-uses, all-uses, and all-du-paths) is formed by techniques whose values are Code forinputs, High fortest data cost, Medium forsize, Yes foravailability, No for support, and Low for comprehensibility. Group 2 (mutation and selective mutation) is formed by techniques whose values are Code for inputs, High for test data cost, Medium for size, Yes for availability, No for support, and High for comprehensibility. Group 3 (statement testing, branch testing, and path testing) has techniques whose values are Code for inputs, High fortest data cost, Medium for size, Yes for availability, No for support, and High for comprehensibility. Group 4 (thread testing and all-possible-rendezvous) is formed by techniques whose values are Code forinputs, High fortest data cost, Medium forsize, No for availability, No forsupport,and Medium for comprehen-sibility. Group 5 (random testing and boundary value analysis) is formed by techniques whose values are Specification for inputs, Low fortest data cost, Any forsize, No foravailability, No for support, and High for comprehen-sibility. These five groups are not all the same distance apart. The closest are G1 and G2, followed by G3, then G4, and, finally, the group furthest away of all is G5.
A more detailed analysis of the resulting classification shows us that for some techniques, this result is at odds with what one might have expected according to the already existing classifications. On one hand, groups G1, G2, and G3 match what Bertolino and Zhu et al., respectively, call data flow, mutation testing, and control-flow criteria. However, according to the classifications by these authors, we expected the techniques in G4 (thread testing and all-possible rendezvous) to be members of G3 (control-flow techniques) and G1 (data-flow techniques), respectively.
Likewise, according to Bertolino’s classification, there would be three equidistant groups: one composed of our groups G1, G3, and G4, another matching our G2, and a third equivalent to our G5. In other words, G2 should be further away from the G1, G3, and G4 conglomerates, and these three should be much closer to each other. The reason is that of the four criteria in our scheme into which Bertolino’s classification would be divided (inputs,software type,knowledge,and experience), only one (inputs) is among
the most selective criteria of our classification. In other words, Bertolino’s classification does not take into account aspects, liketest data cost, softwaresize, toolavailability,and support, and techniquecomprehensibility, that we have found to be important for classification purpose.
On the other hand, we find that Zhu et al.’s classification is slightly closer to ours than Bertolino’s. Zhu et al. also classify techniques into the same three groups as Bertolino’s classification: one would be composed of our G1, G3, and G4, another would match our G2, and the third would correspond to our G5. And G5 would be a little further away from the other two groups. In other words, the only difference is that G1, G3, and G4 would be much closer together. However, we get the same results as in the above comparison. According to our classification, the same three criteria as in Bertolino’s case turned out to be relevant and Zhu et al.’s classification does not take them into account.
Finally, the white/black box and Glass’s classifications envisaged two groups: one composed of our G1, G2, G3, and G4 and the other of our G5, so the distance between G1, G2, G3, and G4 should be zero. Here, as in the case of Bertolino’s classification, only one of the six criteria that turned out to be relevant for our classification (inputs) matched the white/black box classification.
Finally, let us see if our classification is able to explain real facts and how it does explain them. Let us focus, for example, on the success rate of the classified techniques. The techniques most used in practice by the practitioners today are the members of G5, followed by G3. The techniques in groups G1, G2, and G4 are hardly used at all. This means that practitioners are generally likely to opt for the cheaper (simple test data generation), easier (high comprehensibil-ity), and more versatile (useful for any software size) techniques, even if there are no available tools (group G5). They are also prepared to use more costly and less versatile techniques, provided simple and commercial tools are available to automate their use. In summary, the explana-tion that our classificaexplana-tion gives for the success of the techniques is that practitioners appear to prefer techniques that are easier to use. None of the other three classifications examined above give an explanation for this. One objection might be that this is not a new finding. The point here is that research has ratified a belief that was widely held, but a belief nonetheless. Arriving at the same conclusion via different routes raises the confidence in a finding.
4.3 Analysis of Knowledge Gaps
This section illustrates that an SE knowledge classification is useful for detecting knowledge gaps. Having identified the gaps the proposed classification reveals, we need to study whether or not they really are gaps. For every real gap detected, we identify the missing item. Finally, we look at how important every gap is.
First of all, it is necessary to expand the classification tree by considering all the possible values for each classification criterion. Each tree node represents a possible value for the classification criterion at the respective level, irrespective of whether or not there are techniques with this value. Each tree node with no associated technique at the end of a path is a gap. The result of expanding the tree, shown in Fig. 2, is illustrated in Fig. 4, where we have circled the gaps in the
classification, i.e., nodes without any associated technique. Note that the classification presented here is incomplete, as we have considered only 13 of the whole spectrum of testing techniques. The results of the gaps analysis reported in this section then are not conclusive because some of the existing techniques not considered in the preliminary classification presented here could fill these gaps.
Before moving on to the gap analysis, let us consider whether all the gaps identified are potentially useful. Chemical and biological classifications organize things that already exist in nature and are waiting to be discovered. However, in SE, we are concerned with human creations designed to solve a specific problem (technological rather than scientific research [29]). They are things created on demand rather than things that exist. One might think, in principle, that some nodes in Fig. 4 should not be filled, as they are techniques that nobody would want, e.g., a technique that can be applied to software code, at a high test data cost, and is applicable to small programs, if there is already a technique that works for medium-sized programs. However, a technique with one (or all) of the above-mentioned features could have some very specialized feature that made it useful (e.g., a technique that can be applied to software code, at a high test data cost, is applicable to small programs and has a very low applica-tion cost). Therefore, in principle, all nodes will be considered as missing knowledge.
A distinction can even be made between the gaps that should be filled. We have found that there are some gaps that are critical for testing because they stop certain software from being tested. These gaps correspond to the object aspect and are the criteria that characterize what software the techniques can test (size, software type, and programming language). These gaps are highlighted in black in Fig. 4. The existence of these gaps alerts us to the need for urgent improvements in testing. For example, the fact that there are no techniques for testing some types of large-sized software (size criterion value: any) is something that should be urgently remedied.
The other gaps, shaded gray in Fig. 4, are important but less critical, as they refer to the improvement of some technique features to make them easier and more straight-forward for testers to use. These are gaps in thetechnique, tools, and agents aspects. The gaps associated with these aspects are not as critical as the others, because they do not prevent the technique from being applied. For example, the fact that there are no tools for some sorts of techniques is something that should be put right.
Finally, as techniques are added to the classification, new classification criteria values could materialize, and as yet nonexistent, gaps could be discovered. For example, imagine that we added a technique to the classification whose input is interface (like the value suggested by Zhu et al.). In this
case, all of the branches of the classification tree would have to be expanded to cover the new value of the inputs criterion. As a result, new gaps would open up.
4.4 Classification Use for Selection Purposes
A key goal of engineering classifications is to support decision making. So, the classification proposed here should help testers to select what techniques to use in a particular project. Practitioners can use a decision tree for selection purpose. In some cases, the decision tree can exactly be the same as the classification tree, but in other cases, there could be differences in the order in which the classification criteria appear. This rearrangement can occur in any SE classifica-tion. A practitioner uses this tree to evaluate which of the alternatives best suit the project circumstances at each decision point. After going through all the decisions, the leaf node tells the practitioner which technique (or techniques) is the best for his or her project.
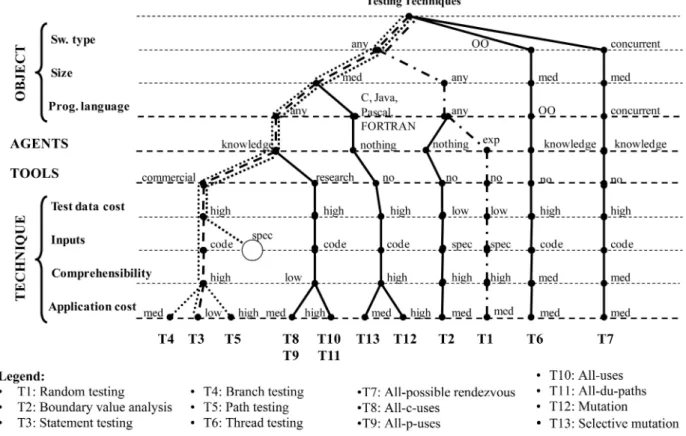
Fig. 5 shows the decision tree we have generated for practitioners. Note that this tree is not exactly the same as the diagram in Fig. 4, as the criteria have been rearranged in Fig. 5 to serve the purpose of selection. In our case, the decision tree has been arranged depending on what leeway a practitioner is likely to have for changing a criterion value during selection. The most restrictive criteria (context-dependent criteria that cannot be changed) have been placed at the top of the tree. The more flexible a criterion is, the lower down it appears in the tree. The features of the software object to be tested appear at the top, followed by the characteristics of the available testers, then the proper-ties of the test cases to be generated, available tools, and finally, the actual technique.
To study the usefulness (completeness, effectiveness, efficiency, usability, and user satisfaction) of this type of classifications, we ran an experiment with final-year students from the School of Computing of the Universidad Polite´cnica de Madrid. The experiment involved each individual subject selecting unit testing techniques for use in two software projects. We provide the main points of the experiment to make this paper self-contained. Further details can be found in [26].
With respect toclassification efficiency,the experiment showed that the learning and selection time is shorter using the classification and the time spent consulting the classification can be considered negligible against the learning and selection time. As regards classification usability, the subjects had fewer problems using the classification, and the problem frequency is lower with the classification. With regard to classification complete-ness, the main finding was that it should include all the criteria that originally appeared in the classification scheme for it to be useful to practitioners. For classification effectiveness, we found that the set of techniques from which the selection is made is smaller for the classification. Also it varies from subject to subject and subjects using the classification select fewer techniques. With respect to user satisfaction, the subjects can be said to like the classification and would be prepared to use it if given the opportunity
Finally, let us clarify, by means of an example, how a classification like this can be used for selection purposes. Suppose that a practitioner needs a technique to unit test software developed according to a structured paradigm with medium-sized units written in C. For this project, there are people available who have knowledge of and accredited
experience in using the techniques under consideration. The client specifically asked for a commercial testing tool to be used and specified that the technique should have a low application cost. Going through the decision tree along the path marked by the dashed line in Fig. 5 (software type: any, size: medium, programming language: any, agents: knowl-edge,tools: yes,test data cost: high,inputs: code, comprehen-sibility: high, and application cost: low), the best technique appears to be T3 (statement testing).
But what if not enough constraints had been set and there were a lot of preselected techniques? If the constraint on the technique’s application cost in our original example were relaxed, there would be three candidates: T3, T4, and T5 (statement testing, branch testing, and path testing, respec-tively). This is illustrated by the path marked by the dotted line in Fig. 5 (software type: any,size: medium,programming language: any, agents: knowledge, tools: yes, test data cost: high, inputs: high, comprehensibility: high, and application cost: high/medium/low). This is not a serious problem and would be solved either by selecting the technique that we like best, about which we have the best references on points not covered by the classification,5 or even describing the project and its constraints in more detail.
The opposite can also be true, i.e., if a lot of constraints are placed on the target technique, the result of applying the selection process may be empty. Imagine that we added a constraint to the last example, namely that source code cannot be used to apply the technique. Clearly, the path marked by the thick line in Fig. 5 (software type: any, size: medium, programming language: any, agents: knowledge, tools: yes,test data cost: high, andinputs: specification) does not lead to any testing technique with the required features. This is evidently a more serious problem. But it is a result of the variety of testing techniques there are at present rather than of the classification itself. The solution to this problem is to relax the project constraints, and thus, increase the possibilities of finding a candidate to fit the bill.
Relaxation of CASE tool use, for example, would take us along the path marked by the dotted and dashed lines in Fig. 5 (software type: any, size: any, programming language: any, agents: experience,tools: no,test data cost: low,inputs: specification, comprehensibility: high, and application cost: medium), ending in T1.
5
C
ONCLUSIONSClassifications serve three purposes: to provide a set of criteria that are able to systematically describe the objects being classified, to understand the relationships between the classified objects because they further clarify their features, and to identify knowledge gaps to suggest new lines of research. Additionally, they provide support for selecting the classified items in engineering fields.
In this paper, we suggest a classification for unit testing techniques that has the characteristics mentioned above. We also present a process for building SE classifications. The process consists of three steps: 1) identify the classification criteria, 2) analyze the information needed to classify the
objects, and 3) instantiate the set of classification criteria for each object and order the set. We have followed this process to classify 13 unit testing techniques according to the criteria associated with knowledge that is available and mature at present.
This process has been proven to be helpful for putting together a classification that covers and enriches unit testing technique classifications proposed by other authors in the past. Additionally, we discovered that some of the criteria proposed by other classifications have implications for other testing technique characteristics beyond what the criteria represent.
From the classification of techniques, we were able to discover how powerful classifications are for understanding techniques and their relationships. This way, we found that the classification presented here gives a plausible explanation of the success of testing techniques today. This explanation can be useful for researchers creating new techniques.
We also examined what gaps there are in the testing techniques classification. This study shows that gaps do exist, although not all potential gaps are useful. We disregarded those gaps that might not be real voids and highlighted the most critical gaps.
Finally, regarding the support that the classification provides for selection, we show how to use the classifica-tion for selecclassifica-tion purposes. Although the proposed classi-fication improves selection, the tester is still responsible for decision making.
A
CKNOWLEDGMENTSThe authors would like to thank June Amillo, Alessandro Sarcia, Santiago Gran˜a, and the TSE reviewers for their thorough and insightful comments on this paper. They have all unquestionably helped to improve this work.
R
EFERENCES[1] V.R. Basili, F. Shull, and F. Lanubile, “Using Experiments to Build a Body of Knowledge,”Proc. Third Int’l Performance Studies Int’l Conf.,pp. 265-282, July 1999.
[2] L. Bass, P. Clements, R. Kazman, and K. Bass,Software Architecture in Practice.Addison-Wesley, 1998.
[3] M.J. Baxter, Exploratory Multivariate Analysis in Archaeology.
Edinburgh Univ. Press, 1994.
[4] A. Bertolino,SWEBOK: Guide to the Software Engineering Body of Knowledge, Guide to the Knowledge Area of Software Testing, 2004 version, chapter 5. IEEE CS, 2004.
[5] R. Chillarege, “Orthogonal Defect Classification,” Handbook of Software Reliability Eng.,chapter 9, Mc Graw-Hill, 1996.
[6] B.S. Everitt, S. Landau, and M. Leese,Cluster Analysis,fourth ed. Arnold, 2001.
[7] R.L. Glass,Building Quality Software.Prentice Hall, 1992.
[8] R.L. Glass, “Questioning the Software Engineering Unquestion-ables,”IEEE Software,pp. 119-120, May/June 2003.
[9] R.L. Glass, V. Ramesh, and I. Vessey, “An Analysis of Research in Computing Disciplines,”Comm. ACM,vol. 47, no. 6, pp. 89-94, 2004.
[10] R.L. Glass, I. Vessey, and V. Ramesh, “Research in Software Engineering: An Analysis of the Literature,” Information and Software Technology,vol. 44, no. 8, pp. 491-506, 2002.
[11] F. Hayes, “True Engineering,”Computerworld,Aug. 2001.
[12] SWEBOK: Guide to the Software Engineering Body of Knowledge,2004 version, IEEE CS, 2004.
[13] M. Knight, “Ideas in Chemistry,”A History of the Science,Athlone Press, 1992.
5. The informational criteria that have been omitted from the classifica-tion scheme could be used here.
[14] P.S. Levy and S. Lemeshow,Sampling of Populations: Methods and Applications,third ed. 1999.
[15] T.S.E. Maibaum, “Mathematical Foundations of Software Engineering: A Roadmap,” Proc. Conf. Future of Software Eng.,
pp. 161-172, May 2000.
[16] N.A.M. Maiden and G. Rugg, “ACRE: Selecting Methods for Requirements Acquisition,”Software Eng. J.,vol. 11, no. 3, pp. 183-192, 1996.
[17] R.M. Needham, “Computer Methods for Classification and Grouping,”The Use of Computers in Anthropology,I. Hymes, ed., pp. 345-356, Mouton, 1965.
[18] J.D. Novak,Learning, Creating and Using Knowledge: Concept Maps as Facilitative Tools in Schools and Corporations.Lawrence Erlbaum Assoc., 1998.
[19] D.E. Perry, A.A. Porter, and L.G. Votta, “Empirical Studies of Software Engineering: A Roadmap,”Proc. Conf. Future of Software Eng.,pp. 345-355, May 2000.
[20] V. Ramesh, R.L. Glass, and I. Vessey, “Research in Computer Science: An Empirical Study,” J. Systems and Software, vol. 70, nos. 1/2, pp. 165-176, 2004.
[21] P.N Robillard, “The Role of Knowledge in Software Develop-ment,”Comm. ACM,vol. 42, no. 1, pp. 87-92, Jan. 1998.
[22] A. Rosenberg,The Philosophy of Science: A Contemporary Introduc-tion.Routledge, 2000.
[23] R.N. Shepard, “Representation of Structure in Similarity Data: Problems and Prospects,”Psychometrika,vol. 39, pp. 373-421, 1974.
[24] C. Tudge,The Variety of Life.Oxford Univ. Press, 2000.
[25] S. Vegas, “A Characterisation Schema for Selecting Software Testing Techniques.” PhD thesis, Facultad de Informa´tica, Uni-versidad Polite´cnica de Madrid, http://grise.ls.fi.upm.es/docs/ Sira_Vegas_PhD_Dissertation.zip, Feb. 2002.
[26] S. Vegas and V.R. Basili, “A Characterization Schema for Software Testing Techniques,”Empirical Software Eng.,vol. 10, pp. 437-466, 2005.
[27] S. Vegas, N. Juristo, and V.R. Basili, “A Process for Identifying Relevant Information for a Repository: A Case Study for Testing Techniques,”Managing Software Engineering Knowledge,chapter 10, pp. 199-230, Springer-Verlag, 2003.
[28] I. Vessey, V. Ramesh, and R.L. Glass, “A Unified Classification System for Research in the Computing Disciplines,”Information and Software Technology,vol. 47, no. 4, pp. 245-255, 2005.
[29] W.G. Vincenti,What Engineers Know and How They Know It.The Johns Hopkins Univ. Press, 1990.
[30] C.R. Woese, “Bacterial Evolution,” Microbiological Rev., vol. 51, pp. 221-271, 1987.
[31] H. Zhu, P.A.V. Hall, and J.H.R. May, “Software Unit Test Coverage and Adequacy,” ACM Computing Surveys, vol. 29, no. 4, pp. 366-427, Dec. 1997.
Sira Vegasreceived the BS and PhD degrees in computing from the Universidad Polite´cnica de Madrid, Spain. She is an associate professor of software engineering in the Computing School at Universidad Polite´cnica de Madrid. Her research interests include empirical software engineering and software testing.
Natalia Juristo received the BS and PhD degrees in computing from the Universidad Polite´cnica de Madrid, Spain. She is a full professor of software engineering in the Com-puting School at the Universidad Polite´cnica de Madrid. She has been the director of the UPM MSc in Software Engineering Program for 10 years. Her research areas include software usability, empirical software engineering, re-quirements engineering, and software process.
Victor R. Basili received the PhD degree in computer science from the University of Texas in 1970 and the honorary degrees from the University of Sannio, Italy, in 2004, and the University of Kaiserslautern, Germany, in 2005. He is a professor emeritus at the University of Maryland and chief scientist at the Fraunhofer Center-Maryland, where he was the founding director. He was the director of the Software Engineering Laboratory (SEL) at NASA/GSFC. He has worked on measuring, evaluating, and improving the software development process and product. Methods for improving software quality include the Goal Question Metric (GQM) Approach, the Quality Improvement Paradigm (QIP), and the Experience Factory (EF) organization.
. For more information on this or any other computing topic, please visit our Digital Library atwww.computer.org/publications/dlib.