Graduate Theses and Dissertations Graduate School
July 2018
A Comparative Study of Signal Processing
Methods for Fetal Phonocardiography Analysis
Venkata Akshay Bhargav Krishna VadaliUniversity of South Florida, [email protected]
Follow this and additional works at:https://scholarcommons.usf.edu/etd
Part of theElectrical and Computer Engineering Commons
This Thesis is brought to you for free and open access by the Graduate School at Scholar Commons. It has been accepted for inclusion in Graduate Theses and Dissertations by an authorized administrator of Scholar Commons. For more information, please [email protected].
Scholar Commons Citation
Vadali, Venkata Akshay Bhargav Krishna, "A Comparative Study of Signal Processing Methods for Fetal Phonocardiography Analysis" (2018).Graduate Theses and Dissertations.
by
Venkata Akshay Bhargav Krishna Vadali
A thesis submitted in partial fulfillment of the requirements for the degree of Master of Science in Electrical Engineering
Department of Electrical Engineering College of Engineering
University of South Florida
Major Professor: Ravi Sankar, Ph.D. Ismail Uysal, Ph.D.
Alexandro Castellanos, Ph.D.
Date of Approval: July 13, 2018
Keywords: maternal heart sounds, fetal heart sounds, wavelet source separation, spectral subtraction, empirical mode decomposition
DEDICATION
ACKNOWLEDGEMENTS
I would like to sincerely thank my advisor Dr. Ravi Sankar for his constant support, guidance, and time throughout my research.
I graciously acknowledge Dr. Prashanth Chetlur Aditya for steering me to this area of research and helping with its foundations. I would also like to recognize Ms. Shraddha Pandey and Mr. Sai Bharadwaj Appakaya for their guidance in the development of the signal processing algorithms.
I would like to recognize and acknowledge the importance of PhysioNet database for their reliable clinical datasets that enabled us to test the algorithms. I am very thankful to the Electrical Engineering Department and the Office of Innovative Education for providing me financial support that enabled me to complete the graduate program.
i
TABLE OF CONTENTS
LIST OF TABLES iii
LIST OF FIGURES iv
ABSTRACT v
CHAPTER 1: INTRODUCTION 1
1.1. Background 1
1.2. Existing Challenges in Electronic Fetal Monitoring 2
1.3. Motivation and Research Objectives 2
1.4. Thesis Organization 4
CHAPTER 2:REVIEW OF FETAL PHONOCARDIOGRAPHY 5
2.1. Introduction 5
2.2. Signal Morphology 6
2.3. FPCG Signal Composition 6
2.3.1. Fetal Heart Sounds (FHS) 7
2.3.2. Fetal Respiration (FR) 9
2.3.3. Fetal Movements (FM) 9
2.3.4. Maternal Heart Sound(s) (MHS) 10
2.3.5. Maternal Organ Sounds (MOS) 11
2.3.6. Additional Artifacts 12
2.4. Current State-of-the-Art 13
CHAPTER 3: SIGNAL PROCESSING METHODS 15
3.1. Introduction 15
3.2. Spectral Subtraction 15
3.3. Wavelet Decomposition 18
3.4. Adaptive Filtering 18
ii
CHAPTER 4: FPCG SIGNAL ANAYLIS AND RESULTS 23
4.1. Introduction 23
4.2. Data 23
4.3. Spectral Subtraction 24
4.4. Wavelet Decomposition 25
4.5. Adaptive Filtering 27
4.6. Empirical Mode Decomposition 28
4.7. Comparison Study 33
CHAPTER 5: CONCLUSIONS AND OUTLOOK TO FUTURE 35
5.1. Conclusions 35
5.2. Future Research 36
REFERENCES 37
APPENDIX A: COPYRIGHT PERMISSIONS 40
A.1. Permission to Use Published Content in Chapter 2, Section 2.3 40
A.2. Permission to Use Published Content in Chapter 3, Section 3.2 and
Chapter 4, Section 4.5 41
A.3. Permission to Use Published Content in Chapter 4, Section 4.4 44
iii
LIST OF TABLES
Table 4.1 Summary of spectral subtractions 24
Table 4.2 Estimated FHR and MHR from wavelet decomposition using spectral
subtraction 27
iv
LIST OF FIGURES
Figure 2.1 Clinically acquired FPCG. 5
Figure 2.2 FPCG signal representing cardiac cycle and events. 8
Figure 2.3 Time- frequency representation of simulated FHS. 9
Figure 3.1 Block diagram configuration of a spectral subtraction system. 15
Figure 3.2 Block diagram configuration of adaptive filter. 19
Figure 4.1 The output of spectral subtraction on a -4.4 dB signal. 25
Figure 4.2 Noisy FPCG, extracted FHS and MHS corresponding to various SNR. 26
Figure 4.3 Manually generated FHS, MHS and FHS+MHS (FPCG) signal. 27
Figure 4.4 Primary signal (FPCG), desired output (FHS) and estimated FHS. 28
Figure 4.5 Noisy FPCG (SNR= -4.4dB) signal and the corresponding spectrogram. 29
Figure 4.6 IMF’s for -4.4 dB FPCG signal. 30
Figure 4.7 Extracted FHS and spectrogram for -4.4dB FPCG signal. 30
Figure 4.8 Extracted MHS and spectrogram for -4.4dB FPCG signal. 31
Figure 4.9 Extracted FHS and spectrogram for -10.2dB FPCG signal. 31
Figure 4.10 Extracted MHS and spectrogram for -10.2dB FPCG signal. 32
Figure 4.11 Extracted FHS and spectrogram for -26.7dB FPCG signal. 32
v
ABSTRACT
More than one million fetal deaths occur in the United States every year [1]. Monitoring the long-term heart rate variability provides a great amount of information about the fetal health condition, which requires continuous monitoring of the fetal heart rate. All the existing technologies have either complex instrumentation or need a trained professional at all times or both. The existing technologies are proven to be impractical for continuous monitoring [2]. Hence, there is an increased interest towards noninvasive, continuous monitoring, and less expensive technologies like fetal phonocardiography.
Fetal phonocardiography (FPCG) signal is obtained by placing an acoustic transducer on the abdomen of the mother. FPCG is rich in physiological bio-signals and can continuously monitor the fetal heart rate non-invasively. Despite its high diagnostic potential, it is still not being used as the secondary point of care. There are two challenges as to why it is still being considered as the secondary point of care; in the data acquisition system and the signal processing methodologies. The challenges pertaining to data acquisition systems are but not limited to sensor placement, maternal obesity and multiple heart sounds. While, the challenges in the signal processing methodologies are dynamic nature of FPCG signal, multiple known and unknown signal components and low signal to noise ratio (SNR).
Hence, the objective of this thesis is to improve the FPCG based care by addressing the challenges in signal processing methodologies. A comparative evaluation was presented on various advanced signal processing techniques to extract the bio-signals with fidelity. Advanced signal processing methods, namely empirical mode decomposition, spectral subtraction,
vi
wavelet decomposition and adaptive filtering were used to extract the vital bio-signals. However, extracting these bio-signals with fidelity is a challenging task in the context of FPCG as all the bio signals and the unwanted artifacts overlap in both time and frequency. Additionally, the signal is corrupted by noise induced from the fetal and maternal movements as well as from the sensor and environment background.
Empirical mode decomposition algorithm was efficient to denoise and extract the maternal and fetal heart sounds in a single step. Whereas, spectral subtraction was used to denoise the signal that was later subjected to wavelet decomposition to extract the signal of interest. On the other hand, adaptive filtering was used to estimate the fetal heart sound from a noisy FPCG where maternal heart sound was the reference input.
The extracted signals were validated by obtaining the frequency ranges computed by the Short Time Fourier Transform (STFT). It was observed that the bandwidths of extracted fetal heart sounds and maternal heart sounds were consistent with the existing gold standards. Furthermore, as a means of additional validation the heart rates were calculated. Finally, the results obtained from all the methods were compared and contrasted both qualitatively and quantitatively.
1
CHAPTER 1: INTRODUCTION
1.1. Background
Congenital heart defects are the most common heart complications in birth-related deaths. It is understood that congenital heart diseases originate in early stages of pregnancy, as the heart is the first organ to be formed. Killan [3] in the 1600’s proposed that Fetal Heart Rate (FHR) could be used to predict the fetal well-being. During 19th century a great interest in knowing about the fetal heart rate was developed. As its potential in predicting and preventing fetal distress was realized. Therefore, regular monitoring of the fetal heart would help take necessary precautions during pregnancy, labor and delivery.
The first version of fetal stethoscope was developed by Pinnard in 1876. The early audio-visual techniques during 1920’s provided some information about the fetus’ heart activity but were limited because of the maternal heart component influence. Later, with the advances of technology, Doppler principle was applied for extracting the fetal heart component from a mixed signal. In 1968, the first Electronic Fetal Monitoring (EFM) tool was commercially available. This machine applied Doppler’s principle using an Ultra Sonic waveform. A study in during 1970’s reported that women who had continuous EFM had less chances of a perinatal mortality as opposed to selective EFM or no EFM.
EFM include various techniques like Electrocardiography (ECG), Phonocardiography (PCG), Pulse Oximetry, Ultrasound, Magentocardiogram (MCG) and Tocodynamometry. However, Ultrasonographic Doppler Cardiotocography (CTG) is the current gold standard that is used for fetal monitoring [4] [5]. CTG records fetal heart sounds using ultrasound as well as record
2
Maternal Uterine Contractions (MUC) using intrauterine pressure catheter. This gives physicians a chance to assess the fetal development and see if there is any fetal distress.
1.2. Existing Challenges in Electronic Fetal Monitoring
In clinical practices, CTG is the most widely used EFM technique. However, it exposes the fetus to radiation, which remains a main concern till date [5]. Also, CTG is mainly used in the third trimester, which defeats the idea of continuous fetal monitoring. It is also expensive and requires a trained professional at all times for its operation. Studies have also shown that long term and frequent monitoring of heart rate using CTG is not practical [2]. Heart Rate Variability (HRV) is very critical information which has been a useful biomedical marker for the evaluation of healthy conditions in adults. FHR is an extremely irregular series, hence a frequency analyses of a very limited time frame might not be a reliable way to measure HRV. In specific cases of high-risk pregnancy, clinical decisions based on CTG data have been shown to result in unnecessary medical interventions [6]. In addition, CTG is inappropriate due to the complexity of the instrumentation, especially when ambulatory fetal monitoring is required. For these reasons, there is an increased interest towards a passive alternative monitoring technologies.
1.3. Motivation and Research Objectives
Acoustic signals generated by the human body can be recorded by placing a transducer on the surface of the skin of maternal abdomen. Analysis and processing of these acoustic signals is known as Phonocardiogram (PCG). Fetal PCG (FPCG) is one such method that uses the same principle to monitor fetus’ health. The FPCG signal is a superimposition of various time-variant fetal and maternal, pressure and acoustic components. Fetal acoustic and pressure components comprise of Fetal Heart Sounds (FHS), Fetal Movements (FM), Fetal Respiration (FR). Whereas, maternal acoustic and pressure components comprise of Maternal Heart Sounds (MHS), Maternal
3
Digestive Sounds (MDS), Maternal Respiration (MR), Uterine Contractions (UC), and Maternal Motion (MM) additional components like Power Line Interference (PLI), Reverberation Noise (RN), Sensor Noise (SN) and Background Noise (BN). Finally, noise comprises of various components like Power Line Interference (PLI), Reverberation Noise (RN), Sensor Noise (SN) and Background Noise (BN).
Though FPCG is rich in information and has a very high diagnostic potential, it is currently being used only as a secondary diagnosis tool. There are few reasons as to why it is clinically unacceptable. All the bio-signals of FPCG and the unwanted artifacts are superimposed in both time and frequency domains. Simultaneous extraction of the signals of interest is difficult. The acoustic energy of the FPCG signal is considerably low. The features of the individual bio-signals are highly dependent on the position of the data acquisition system, maternal obesity, gestational age.
This study focuses on developing and comparing various signal processing algorithms to extract the FHS and MHS signals with extreme fidelity from FPCG signal. The proposed thesis framework aims at the following three research objectives:
1. State of the Art: A comprehensive review of the state of the art FPCG signal processing methodologies, FHS and MHS tracking from FPCG signal.
2. Denoising and Decomposition: To develop and implement non-linear signal processing algorithms to denoise and decompose the FPCG signal to extract the signal of interest.
3. Validation: Compare and contrast the extracted FHS and MHS from different algorithms. Compute FHR and the MHR for validating the signals quantitatively. Additionally, compute the STFT for a qualitative observation and obtaining the corresponding frequency ranges.
4
1.4. Thesis Organization
This chapter presents the motivation and the goal of this thesis along with the challenges to achieve those goals.
Chapter 2 gives an extensive understanding of the FPCG signal morphology. It talks about fetal and maternal heart electrical activity, blood circulation, fetal and maternal respiration and about various other additional artifacts that affect the FPCG signal. Various signal processing approaches that have been used in the past for FPCG signal analysis have been presented.
Chapter 3 covers various signal processing frameworks like Empirical Mode Decomposition (EMD), adaptive filtering and spectral subtraction. The math underlying these algorithms and their assumptions are briefly discussed. Reading this chapter would give the readers an understating of the aforementioned signal processing techniques.
Chapter 4 presents the results that were obtained. Data used for the testing of the algorithms developed was described. Moreover, presents the comparison of the quantitative results that were obtained from various signal processing techniques and a discussion of those results. This chapter compares and validates the work accomplished.
Chapter 5 summarizes the work done and suggests possible directions for future research work.
5
CHAPTER 2: REVIEW OF FETAL PHONOCARDIOGRAPHY
2.1. Introduction
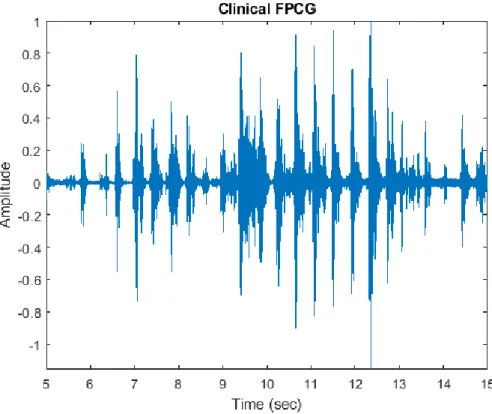
Auscultation, analysis and processing of vibratory signals particularly fetal heart sounds from the maternal body is known as fetal phonocardiography (FPCG). FPCG is a method that has been there for more than a century to monitor fetus’ health. Although, the quality of the data acquisition system (sensor) has been improved by a great amount, FPCG based point of care is facing a serious challenge when the originally designed signal processing framework is applied on the real time data.
Figure 2.1: Clinically acquired FPCG.
The data used in this thesis is collected through a single channel from a sensor, which is placed below the abdomen of the mother. This particular signal is rich in information and contains
6
vital bio signals like fetal heart sound (FHS), fetal respiration (FR), maternal heart sound (MHS)and maternal respiration (MR). As number of time-variant bio signals are collected by this particular sensor, it makes it hard to separate them in time domain or frequency domain as they are superimposed on each other. Figure 2.1 is a representation of a clinically acquired 10 seconds FPCG signal.
2.2. Signal Morphology
FPCG monitoring is a passive technique where no energy is transmitted to the fetus. The information obtained from FPCG is relatively the same as that obtained from various methods like pulse oximetry, MCG, ECG and ultrasound. Although, the diagnostic potential of FPCG is very high, its analysis is challenging as there are various time varying components convolved in both time and frequency.
2.3. FPCG Signal Composition1
The different components that result in the FPCG signal are time-varying vibratory components generated by the fetus, mother as well as the nature. A detailed explanation of all these components is given in this section.
The fetal heart is the first organ created. The fetal heart starts to beat by the 5th week of gestation [7]. Sino Atrial (SA) node, the pacemaker, in the fetus is fully developed by the end of 6th
week. Almost by the end of 8th week of gestation, the four chambered fully functional fetal heart is developed. However, this heart might not be able to function in full capability as an adult heart would function. The hemoglobin content in fetal blood is 50% more compared to the hemoglobin content in maternal blood, which helps the fetus to overcome instances where the oxygen content is low.
1The portions of this chapter, section 2.3 have been published in Journal of Biomedical Signal Processing and
7
Electrical impulses generated in the heart are generated by the SA node. The impulses travel from the SA node to the Atrio Ventricular (AV) node which is located just under the right atrium. There is a delay in the propagation from SA node to the AV node as the diameter of the fibers that carry the impulses is very small. During the propagation, the pressure in the atria increase resulting in pumping the blood into the ventricles. Later the impulses are propagated towards a large bundle of fibers called the Bundle of His or the AV bundle. This bundle is later divided into left and right bundles to larger group of fibers called the Purkinje fibers, which cover most of the ventricular region. As the impulses propagate towards the Purkinje fibers, the impulses help ventricles contract and thus squeeze the blood into the arteries. This complete cycle, known as a cardiac cycle, takes about 0.7-0.8 seconds. Usually the fetal heart cycle lasts shorter than that of the adults, due to the volume of blood the fetal heart can contain.
2.3.1. Fetal Heart Sounds (FHS)
The heart sounds are produced by the vibrations generated by the closure of the valve leaflets due to blood flow, which occur during isovolumic contraction and isovolumic relaxation. Four heart sounds are generated by the heart. Only the first two heart sounds S1 and S2 are detectable in a fetus.
S1, the first heart sound is produced because of the asynchronous closure of the mitral and tricuspid valves. Usually mitral valve closure precedes tricuspid valve closure. This sound is produced at the beginning of ventricular contraction or the isovolumic contraction. The papillary muscles in the ventricles contract when the ventricles start to contract. These papillary muscles are connected to the leaflets via heart strings. As the muscles contract the heart strings become tense allowing the blood to flow into the low-pressure area, the atria. Once the blood is pumped in to the atria because of the ventricular contraction, it is felt by the leaflets, thus allowing the valves to
8
snap shut. Hence, the S1 sound is the result of reverberation produced by the closure of mitral and tricuspid valves. S1 is a combination of two high frequency vibrations generated by the superimposition of mitral and tricuspid valves closure. This first heart sound lasts longer than that generated by the second heart sound. S1 lasts for an average of 100-200 milliseconds and the frequency components are in the range of 10-200 Hz. The valve closures are asynchronous and are often separated by 20-30 milliseconds of time delay. S1 sound usually coincides with the R peak corresponding to the ECG waveform. This is followed by the sound generated during the ejection of blood from right and left ventricles into aortic and pulmonary arteries.
Figure 2.2: FPCG signal representing cardiac cycle and events.
S2, is the second heart sound produced by the asynchronous closure of aortic and pulmonary valves. This sound is produced during at the beginning of ventricular relaxation or the isovolumic relaxation. Here, at this point, the pressure in the ventricles is less compared to the aorta and the pulmonary arteries, hence the blood tries to flow back. This is controlled by the closure of aortic and pulmonary valves. S2 is also a combination of a series of high frequency components produced by the superimposition of aortic and pulmonary valve closure. S2 usually is low in amplitude when compared to S1 sound. This particular sound has higher frequency
9
components than that of S1 sound as can be observed in Figure 2.3. But, this sound lasts for a lesser duration than S1. Figure 2.2 is a representation of the simulated signal and as shown in the figure that heart sound S2 has lesser amplitude compared to heart sound S1.
Figure 2.3: Time- frequency representation of simulated FHS. Data obtained from [8] [9].
2.3.2. Fetal Respiration (FR)
Fetus does not use the lungs for breathing when in womb. When the fetus is in the embryo it is in a state of apnea [10]. The oxygenation of blood is carried out by the circulation of blood through the placenta. This is a low frequency signal component as well. It is usually a band-limited signal in the band 0.3-1.5 Hz [5]. The FPCG signal is a superimposition of FHS and the FR both in time and frequency. Talbert et al. [11] found that when the FR is superimposed onto the FHS, FR affects the heart rate of the FPCG signal because FR causes a baseline drift in the FPCG signal.
10
2.3.3. Fetal Movements (FM)
Fetal movements are caused by the motion created by the fetus’ muscle activity. These initial movements are self-generated nerve impulses triggered by the spinal cord. There are other motions that are classified into fetal movements based on the waveforms duration. The movements caused by the head or limb movement usually last for 1-3 seconds. Whereas the brisk movements like hiccups, sighs and head startling last for a very brief movement of less than 1.5 seconds. However, there are certain movements which last greater than 4 seconds and these types are considered to be gross rolling. All of these are considered to be artifacts present in the phonocardiogram signal. These artifacts are not present in the initial weeks of gestation. They are observed during intrapartum, antepartum and labor.
2.3.4. Maternal Heart Sound(s) (MHS)
Many researchers in the literature have found that MHS are present in the FPCG signal. In some studies, the first heart sound was found to be dominant, whereas in some instances the second heart sound was identifiable as well. MacDonnell et al. [12] identified MHS to be originating from the umbilical cord. Chourasia et al. [13] observed the presence of MHS and interpreted it to be two tone signals generated by the maternal heart. Whereas, Nagel et al. [14] inferred MHS to be a pulse generated by the blood flow in the maternal arteries and has shown that MHS amplitude is relatively high compared to any other bio-signal component that is present in the FPCG signal. On the other hand, Zahoriana et al. [15] reported that the MHS was generated from the placental soufflé and it was in sync with the FHS.
MHS is a narrow band limited, periodic, non-stationary signal in the band of 8-40 Hz centered around 15-20 Hz [5]. The power of the MHS signal is highly relative to the location of data acquisition. MHS signal, when superimposed on the FHS signal, can visually disappear in the
11
time domain because of the MHS signal power. MHS signal essentially has a relatively higher amplitude in comparison to other bio signals present in the FPCG signal like the FHS, FR, maternal movements, maternal organ sounds and, of course, the noise. This makes it a really challenging problem to decouple the MHS and the FHS signal. Also, it has been observed that the harmonics of the MHS signal are coupled with the line noise creating unwanted peaks.
2.3.5. Maternal Organ Sounds (MOS)
The sounds produced by various maternal organs like the Maternal Respiration (MR), Maternal Digestive Sounds (MDS), Maternal Uterine Contractions (MUC), displacement of amniotic fluid and tissue are considered to be the known MOS, while there might be other pressure components contributing as well.
As understood, respiration is a slow varying low frequency component and therefore, MR is also a low frequency component varying slowly. Interestingly, Jimenez et al. [16] was successful in extracting the maternal respiration from the FPCG signal. They found the MR to be a signal band-limited in band 0.2-0.5 Hz. As discussed in section 2.3.3 how the FR is responsible in the base line drift of FPCG signal, MR also would be responsible if it overlaps with FHS as well FR in the frequency domain.
In addition to the MR, there is a high probability of the presence of the MDS in the FPCG signal which include the bowel movements as well. Also, the MUC which are recorded during the final weeks of gestation and labor, using an intrauterine pressure catheter. These contractions are also a low frequency signals generated by the contraction of the uterine muscles. The week of gestation is in direct correspondence with the intensity and the duration of the contractions. As the MUC is also low frequency signal, in the context of FPCG, Talbert et al. [17] have found that MUC have direct influence on the FHS especially in the frequency domain.
12
On the other hand, external disturbances like maternal movements, coughing or sneezing might have direct influence on the FPCG signal. These contribute to high amplitude impulses.
2.3.6. Additional Artifacts
The three main components that comprise of noise are Power Line Interference (PLI), Reverberation Noise (RN), Sensor Noise (SN) and Environment Background Noise (EN). All these noises are narrowband low frequency components.
PLI, though a narrow band signal has the harmonics of PLI are found to be in both low and high frequencies with a center frequency around 50-60 Hz. As it can be understood, PLI overlaps in frequency with the FHS as FHS signal is a band-limited signal in 20-80 Hz band. This overlap deteriorates the Signal to Noise Ratio (SNR) of the FPCG signal.
Whereas, the sensor being highly sensitive, a fractional movement of the sensor can cause a high amplitude peak to be recorded. These recorded waves are trapped in the sound guide and they resonate because of the reflection. This severely affects the SNR of the FPCG signal. Additionally, the background noise like the sounds originating from the speech, buzzing and ringing of the medical alerts and the ambient noise damage the SNR of the FPCG signal. Apart from all these noises, we have to consider the noise contributed by the transducer. All these noises together comprise of the sensor, reverberation and background noises. The sensor and the background noises are usually considered as white Gaussian broad band signals present throughout all the frequencies.
In summary, FPCG is a non-linear combination of various time varying signals which are hard to decouple in time domain or frequency domain, without compromising on the content. Also, the availability of different components in an acquired signal in a given setting is still a question that needs to be answered. The knowledge about FPCG signal and signal components is still an ongoing research.
13
2.4. Current State-of-the-Art
Most of the research in the FPCG context had been contributed for extraction of the major hearts sounds S1 and S2 from a FPCG signal that was recorded in a compromised setting where the FPCG signal is corrupted by noise. The signal processing approaches can be broadly categorized as:
1. Time – Frequency analysis 2. Spectrum estimation 3. Non-linear analysis
With respect to spectrum analysis, various researchers have used the classical techniques to represent the heart sounds. One of the most used techniques is calculating the Power Spectral Density (PSD) estimation by averaging or windowing the signal and computing the Fast Fourier Transform (FFT) for achieving better statistical stability of the obtained spectrum. But time-frequency was not successful in the context of FPCG as the signal components were super imposed in both time and frequency domains. However, time-frequency analysis can be used to quantify the results obtained by using some advanced signal processing algorithms. Also, when the SNR is low the classical methods do not produce the results as anticipated.
An alternative method is using the parametric modelling. The parametric modelling involves choosing an appropriate signal model and choice of hyper parameters. Autoregressive Moving Average (ARMA) models have shown some promising results when the signal has peaks and valleys. But, in the context of FPCG these might not play a major role as the signal is highly linear as well as dynamic in nature. One the other hand, Eigen decomposition is a non-parametric approach which is achieved using the Eigen vectors. The Eigen vectors provide an accurate spectral resolution regardless the SNR. Also, using these methods we can extract the
14
signal of interest which might be possibly corrupted by noise. Eigen decomposition provides better spectral estimation in comparison to the parametric estimations or the Fourier Transforms.
However, there is a need for more advanced signal processing algorithms as all the methods discussed so far may give inappropriate results if applied on signal with varying statistics (non-stationary) as in the case of the FPCG. Hence, there is a motivation towards precise model-based signal processing techniques, as they offer to provide more details or achieve a better localization even under very low SNR. The uncertainty of myocardial tissue motivates the use of stochastic signal processing models to extract the desired signal of interest from a non-stationary signal which is corrupted by noise ranging from ambient noise to various other bio signals, in the context of FPCG.
A brief overview of various signal processing methods that are used have been summarized. Although various signal processing methodologies ranging from conventional filtering to complex non-linear decomposition have been proposed, extracting all the bio-signals of the FPCG with high fidelity is still a challenge. In particular, the fidelity is compromised when good signal resolution is required in both time and frequency domains. While direct methods like filtering, spectral subtraction and others do not perform well due to stationary and non-deterministic characteristics of the FPCG, advanced signal processing schemes like blind source separation and adaptive filtering seem to require multichannel data to achieve positive results. Particularly, these techniques fail to retain the time domain characteristics of FHS such as FHR when a single channel FPCG data is processed [16].
15
CHAPTER 3: SIGNAL PROCESSING METHODS
3.1. Introduction
Over the years, various signal processing techniques ranging from basic filtering to advance signal processing techniques like wavelet transform were implemented on the FPCG signal. Yet, FPCG based monitoring is still a secondary method of monitoring despite the signal being rich in vital bio signals. FPCG signal his highly dynamic and is a non-stationary signal.
In this chapter, various advanced signal processing techniques namely spectral subtraction, wavelet decomposition, adaptive filtering and EMD have been presented with the focus being mainly on denoising and decomposition of FPCG signal.
3.2. Spectral Subtraction
Figure 3.1: Block diagram configuration of a spectral subtraction system.
Spectral Subtraction [20] is a method for restoration of magnitude spectrum of a signal observed in an additive noise through subtraction of an estimate of the average noise spectrum from the noisy signal. A simple representation of spectral subtraction has been presented in Figure 3.1. The noise spectrum is usually estimated and updated from the periods when the signal is absent and only the noise is present. The assumption is that the noise is a stationary process and that the noise
16
spectrum does not change significantly between the update periods. The noisy signal model in the time domain is given by
y(m) = x(m) + n(m) (1)
where y(m), x(m) and n(m) are the signal, the additive noise and the noisy signal respectively, and m is the discrete time index. In the frequency domain, the noisy signal model of the equation (1) is expressed as
Y(f) = X(f) + N(f) (2)
Y(f), X(f) and N(f) are the corresponding Fourier transforms of the noisy signal y(m), the original signal x(m) and the noise n(m), and f is the frequency variable. In spectral subtraction, the incoming signal y(m) is buffered and divided into segments of N samples length. Each segment is windowed using a Hann window and then transformed via discrete Fourier transform (DFT) to N spectral samples.
yw(m) = w(m)y(m)
= w(m)[x(m) + n(m)] = xw(m)+nw(m)
(3)
The equation describing spectral subtraction is as follows:
| ( )| | ( )| | ( )| ^ f N f Y f X = − (4) )| ( | ^ f
X is an estimate of original signal spectrum | X(f) | and |N(f)| is the time averaged noise spectrum. It is assumed that noise is wide sense stationary random process. The time averaged noise spectrum is obtained from the periods when the signal is absent and only noise is present as
17 | ) ( | 1 | ) ( | 1 0 f N k f N k i i
∑
− = = (5)In Eq. (5) | Ni(f) | is the spectrum of the ith noise frame, and it is assumed that there are k
frames in a noise – only period, where k is a variable. For restoration of a time-domain signal, the
magnitude spectrum estimate | ( )|
^
f
X is combined with the phase of the noisy signal, and then transformed into the time domain via inverse discrete Fourier transform.
∑
− = − = 1 0 2 ) ( ^ ^ | ) ( | ) ( N k km N j K j e e k X m x Y π θ (6)whereθY(K)is the phase of the noisy signal frequency Y(k). The signal restoration equation assumes
that noise is mainly due to the distortion of magnitude spectrum, and that the phase is largely inaudible. Owing to the variations of the noise spectrum, spectral subtraction may result in negative estimates of the magnitude spectrum. To avoid negative magnitude estimates the spectral subtraction output is post processed using a mapping function of the following form
�𝑋𝑋�(𝑓𝑓)�=��𝑋𝑋�(𝑓𝑓)� 𝑖𝑖𝑓𝑓�𝑋𝑋�(𝑓𝑓)�> 0.01�𝑌𝑌�(𝑓𝑓)� 0.01�𝑌𝑌�(𝑓𝑓)� 𝑜𝑜𝑜𝑜ℎ𝑒𝑒𝑒𝑒𝑒𝑒𝑖𝑖𝑒𝑒𝑒𝑒
(7)
The spectral substraction system includes following subsystems:
1. A silence detector, based on the energy and zerocrossings for detection of the periods of signal inactivity. The average noise is calculated based on input data and number of frames.
2. A discrete Fourier transform block is used to convert time domain to the frequency domain. 3. A post processor for removing processing distortions introduced by spectral substraction. 4. An inverse discrete Fourier transform block for transforming the processed signal back to time
18
3.3. Wavelet Decomposition
In this study, a wavelet based Multiresolution Analysis (MRA) has been implemented in order to extract the FHS and MHS from FPCG. In MRA, the given signal s (n), i.e., SNR enhanced FPCG is decomposed into various levels of approximation and detail coefficients. The approximation and detail coefficients obtained after the MRA were hard thresholded based on the bio signal of interest and reconstructed back into time domain. The chosen mother wavelet should provide a reasonably good frequency resolution to FHS and MHS, through compact support. The mother wavelet needs to be able to detect the presence of hidden discontinuities. In addition, the wavelet should also be orthogonal to avoid phase distortions from the transformation. All the requirements of the current study were satisfied by the Coiflet wavelet with five vanishing moments. In addition, qualitatively, correlation of Coiflet-5 wavelet to the heart sounds (fetal and maternal) is very high.
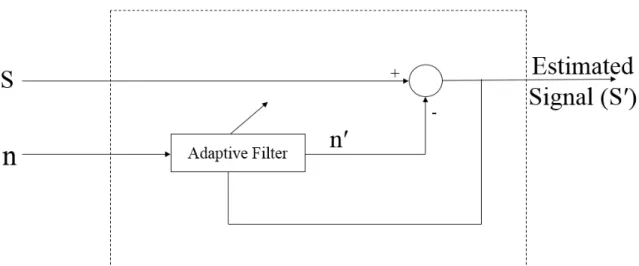
3.4. Adaptive Filtering
The method of estimating a signal of interest that is corrupted by noise passed through a filter to suppress the noise, leaving the signal characteristics relatively unchanged is called direct filtering. Direct filtering can be achieved by fixed or adaptive filters.
Fixed filters are time invariant filters with fixed weights. These filters are frequency selective such as low pass, high pass, or band pass based on the frequency range of the signal of interest and the noise is out of band. On the other hand, adaptive filters are time variant filters and the filter weights are not fixed. They are adaptively determined based on an optimization algorithm. As the time progresses, we have the optimal filter where the filter output is a replica of the desired response. Few advanced adaptive filters, like extended Kalman filter, have the ability
19
to track the signal of interest even if the signal is highly dynamic as well as non-stationary. A simple adaptive filter block diagram is shown in Figure 3.2.
Figure 3.2: Block diagram configuration of adaptive filter.
All the adaptive filters are considered to be digital filters. Adaptive filters can be implemented using two different methods: The Least Mean Squares (LMS) and the Recursive Least Squares (RLS). Both the algorithms try to minimize the cost function in a closed loop adaptive process. The most commonly used cost function is the mean square error of the error signal.
In this work, LMS adaptive filter has been used. It requires at least two signals, primary signal (S) and reference signal (n). The primary signal includes signal of interest as well as undesired signals. A reference input is given as an input to the adaptive filter which contains signals that are correlated to undesired signals in the input signal. Here, the undesired component is the MHS. The filter is controlled based on the weight vector. This filter uses stochastic gradient descent method to find the filter weights to minimize the cost function. The filter weights are adapted based on the error at the current time. The cost function for this filter is defined as the mean square error. We try to minimize the mean square error using steepest gradient descent by
20
taking the partial derivatives of the weight vector with respect to individual entries of the weight vector. This operation is performed using gradient operator. The cost function and the corresponding weight update equations are given by
Є2 = E [ e(n)2 ] (8)
W(i+1) = W(i) – (µ/2) * ∇ωЄ2 (9)
where W(i)is the weight vector till i iterations, µ is the step size,∇ω is the gradient operator and Є2 is mean squared error. The error term e at any time instant kis given by
e(i) = S(i) – n′(i) (10)
where S(i) is the primary input and n(i) is the reference input. Therefore, for the error to be minimum the weight vector W should be
Woptimal = R-1 * P (11)
where R is the auto correlation of the reference signal and P is the cross correlation between the reference and the input signal given by
R = E [ n(k) * nt(k) ] (12)
P = E [ n(k) * St(k) ] (13)
Substituting equations 10-13 in equation 9 will yield us
W(i+1) = W(i) + µ * n′(i) * e(i) (14)
This equation is the heart of the adaptive LMS algorithm. The optimal weights are obtained from the steepest gradient descent with a step size µ. One of the major hyper parameters which needs to under check is the step size as it decides the weights. The weights obtained from equation 11 are might not necessarily converge to the optimal weights. But, after a while we can observe that the mean of the obtained weights equal to the mean of the optimal weights. The challenge now would be to keep the variance in check. We would want to obtain the weights with minimum
21
variance. The weights with minimum variance can be obtained if the step size is always between 0 and 2/Tr[R]. Interested readers can find detailed proof of this from [21].
3.5. Empirical Mode Decomposition (EMD)2
EMD is used to decompose a signal into a series of band-limited IMFs. Each IMF signal band is associated with energy corresponding to different time scales intrinsic to the original signal [19]. The algorithm iteratively extracts the high frequency components, which are called IMFs. The below stated algorithm is then again applied on the low frequency component of the previous iteration until it reaches a constant value.
The original input signal s(n) is initially segmented into data frames di(ns), where i is the
frame index, ns is the number of samples in the given data frame. Following procedure is adapted
from [8] to obtain the IMFs:
1. Input to the algorithm is a data frame di(ns) of size ns x 1 from the s(n).
2. Initially, all the local maxima max(ns) and minima min(ns) of the given input signal di(ns) were
calculated. Interpolated these maximas and minimas envelopes using the cubic spline function. 3. Next, the mean m(ns) of the envelopes was calculated using (max(ns)+ min(ns))/2.
4. The mean m(ns) was then subtracted from di(ns) to generate the IMF with zero local mean using
h(ns) = di(ns) - m(ns).
5. hj(ns)= di(ns)- h(ns), where j is the iteration number.
6. The hj(ns) is identified as an IMF if it meets the following three conditions:
i. Total number of extrema and zero crossing must be equal or differ at most by one; ii. The number of maxima or minima points should not be less than 2.
iii. The standard deviation (SD) of hj(ns) should be at least greater than the threshold value.
22
The algorithm iterates from steps 1 to 6 and the new di(ns) = di(ns)-hj(ns) for further
processing till the conditions defined in step 6 are not met.
The primary advantage of using the EMD algorithm is that the basis function for the decomposition is derived adaptively from the signal. As a result, a better representation for the signal of interest is obtained. The output of the EMD are the Intrinsic Mode Functions (IMF) from which intrinsic to time different time scales of the original signal.
23
CHAPTER 4: FPCG SIGNAL ANALYSIS AND RESULTS
4.1. Introduction
Phonocardiography signal is a result of fetal cardiac cycle consisting of first heart sound (S1) which results from closing of mitral and tricuspid valves and second heart sound (S2) which results from closing of pulmonary and aortic valve. Both S1 and S2 consist of series of low frequency vibrations that fall around same frequency band.
Consider the following frequency domain analysis. Employing a conventional digital band pass signal for denoising FPCG would compromise one or the other above-mentioned major components leading to signal distortion, compromises in useful information and leaves noise in the pass band. Hence, this thesis presents advanced signal processing algorithm for noise cancellation as well as signal decomposition.
4.2. Data
Various datasets have been used in this research work. The dataset that was used for EMD and Spectral subtraction as well as Wavelet decomposition was obtained from PhysioNet [8] database which was contributed by Ruffo and Cesarelli et al. [4] [22]. The simulated FPCG signals that were presented in the PhysioNet database were designed to capture the physiological and pathological aspects of the fetal and maternal states. As a result, the produced FPCG waveform can effectively represent the real world FHS and MHS waveforms and also the artifacts due to maternal heart sounds, maternal body organs sound, fetal movements, surrounding environment and additive white Gaussian noise. The FPCGs generated from the model are concatenations of the segments comprising of the simulated fetal heart sounds, maternal heart sounds and noise of
24
different power levels. As a result, the FPCG signals of about 480 seconds duration are generated with different SNR ranging from -26.7 dB to -4.4 dB, each with the sampling frequency of 1 kHz. The maternal reference signal as well as the mixed (fetal plus maternal) signal that were given as inputs to the LMS filter were generated using [4] [22]. The respective signals were generated by taking mean MHR to be 60 while the mean FHR to be 80. FHR was taken to be 80 to test the algorithm performance for scenarios of maternal and fetal heart rates being close. Both the signals were generated for a duration of 30 seconds with a sampling frequency of 1 kHz.
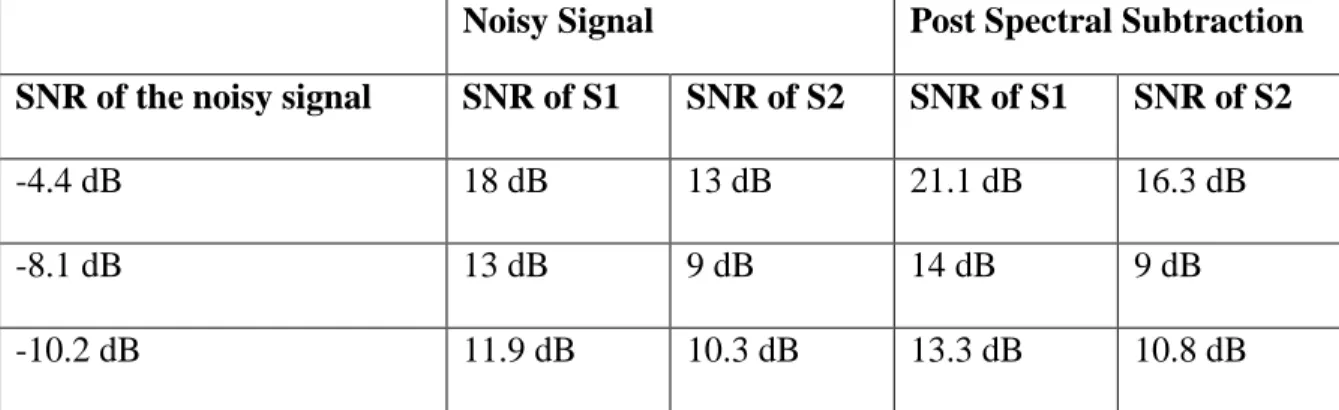
4.3. Spectral Subtraction
Spectral subtraction [23] is performed on simulated Fetal PCG signals obtained from Physionet database [8] [4] [22]. This process was performed on a 6 second data sampled at 1000 Hz and a 1000 sample short time window and 600 sample overlap. The frame was manually selected so that no artifacts and unusual noise are not present. Figure 4.1 summarizes the spectral subtraction on a -4.4dB signal.
The following table provides a comparative summary of spectral subtractions on the signals with different SNRs.
Table 4.1: Summary of spectral subtractions
Noisy Signal Post Spectral Subtraction
SNR of the noisy signal SNR of S1 SNR of S2 SNR of S1 SNR of S2
-4.4 dB 18 dB 13 dB 21.1 dB 16.3 dB
-8.1 dB 13 dB 9 dB 14 dB 9 dB
25
Figure 4.1: The output of spectral subtraction on a -4.4dB signal.
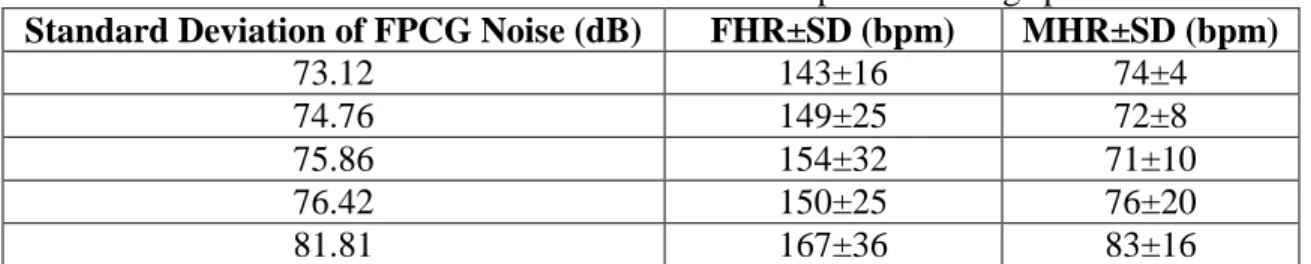
4.4. Wavelet Decomposition3
Post noise cancellation, the estimate S(n) was subjected to a six level Multiresolution Analysis (MRA) using fifth order Coiflet wavelet. The FHS and MHS were extracted as independent sources by performing a hard threshold on MRA coefficients, simultaneously retaining details and approximation coefficients of level six (D6 and A6) and reconstructing them individually back into time domain. Figures 4.2.A1 and 4.2.A2 obtained using FPCG signal with noise power 73.12 dB. Figures 4.2.B1 and 4.2.B2 obtained from FPCG signal with noise power 76.42 dB. Figures 4.2.C1 and 4.2.C2 obtained from FPCG signal with noise power 81.81 dB. The last digit 1 and 2 in the figure numbers correspond to FHS and MHS signals obtained after MRA decomposition for six seconds of SNR enhanced FPCG.
From Figures 4.2.A1 – 4.2.C2, it can be observed that, qualitatively the developed framework denoised the out-of-band noises and efficiently resolved the FHS and MHS
26
interference from a single channel FPCG. However, in order to provide additional validation, mean Fetal and Maternal Heart Rates (FHR, MHR) along with their standard deviations (SD) were computed in beats per minute (bpm) for the analyzed FPCG dataset. Table 4.2 presents the results of the estimated FHR and MHR.
27
Table 4.2: Estimated FHR and MHR from wavelet decomposition using spectral subtraction.
Standard Deviation of FPCG Noise (dB) FHR±SD (bpm) MHR±SD (bpm)
73.12 143±16 74±4 74.76 149±25 72±8 75.86 154±32 71±10 76.42 150±25 76±20 81.81 167±36 83±16 4.5. Adaptive Filtering
Both the primary input and the reference input were given to the system, where the primary input was the simulated FPCG signal and the reference input was the MHS signal. The FPCG signal that was simulated was a result of addition of simulated FHS and MHS signal, as can be seen in Figure 4.3.
Figure 4.3: Manually generated FHS, MHS and FHS+MHS (FPCG) signal.
As seen in Figure 4.4, the estimated FHS is in red and has a very high correlation with the actual simulated FHS signal. However, there is a lot of ringing which is evident in the estimated signal. The ringing can be accounted from the number of filter weights we are taking as the
28
reference input is buffered. The filter weights seemed to play a major role in the fidelity of the estimated signal. The estimated signal resulted in the primary signal when the number of weights were less than 100. But later when the number of filter weights were changed to 800, they seemed to give better results in comparison to the previous outputs. However, as the number of weights were increased from 800 to 1200 in steps of 100, the estimated FHS seemed to have better fidelity when the number of weights was 1000. The results presented were obtained by taking the step size µ to be 0.01 and the number of filter weights to be 1000. The signal that was subjected to the adaptive filter contained 40000 samples. The sampling rate was 1 kHz, essentially meaning 40 seconds of data. The weights were updated for every sample, which can be accounted for the additional ringing observed in the estimated signal.
Figure 4.4: Primary signal (FPCG), desired output (FHS) and estimated FHS.
4.6. Empirical Mode Decomposition
To evaluate the performance of proposed algorithm, simulated FPCG signals with SNR conditions -4.4 dB, -10.2 dB and -26.7 dB were used. The FPCG signal s(n) of length 1x477999 were segmented into the frames d(ns) of size 1x6000 corresponding to 6 seconds of data. The
29
segment length of 6 seconds was selected in order to capture the slow varying MHS and FHS. For each frame, 19 IMFs were extracted for a threshold, SD of 0.7. This threshold was found to provide the optimal energy distribution of FHS and MHS for efficient signal extraction. From the obtained IMFs, the energies across 4th and 5th IMFs were found to represent the FHS signal; and the 6th and 7th IMFs resembled MHS signal.
Figure 4.5 is the representation of -4.4 dB FPCG signal, when the same signal is subjected to EMD, IMFs shown in Figure 4.6 are obtained. As can be seen in Figure 4.6, FHS energy is mainly distributed in IMF’s 5 and 6. These IMFs were added and were superimposed on the original signal as depicted in Figure 4.7. While Figure 4.8 is obtained when IMFs 7 and 8 were added as the energy of MHS is seen to be distributed in those IMFs. The corresponding spectrograms are also shown in those figures. The periodicity in the extracted FHS and MHS signal can be distinctly seen in Figure 4.7 and 4.8. For additional validation, the STFT was computed on the extracted FHS and MHS signals.
30
Figure 4.6: IMF’s for -4.4dB FPCG signal.
31
Figure 4.8: Extracted MHS and spectrogram for -4.4dB FPCG signal.
Similarly, the -10.2dB signal was also subjected to EMD. The results obtained are presented in the following Figures 4.9 and 4.10.
Figure 4.9: Extracted FHS and spectrogram for -10.2 dB FPCG signal.
32
Figure 4.10: Extracted MHS and spectrogram for -10.2 dB FPCG signal.
When the -26.7dB was subjected to EMD the results obtained were presented in Figures 4.11 and 4.12.
33
Figure 4.12: Extracted MHS and spectrogram for -26.7 dB FPCG signal.
All the extracted FHS and MHS very validated using the classical time-frequency analysis, Spectrogram. Spectrograms are computed by calculating the FT by windowing the signal. It can be observed from Figure 4.5 that in the noisy FPCG, both FHS and MHS cannot be differentiated and power across all the other frequency bands was very high and is all distributed. However, we can see from Figures 4.7, 4.9 and 4.11 that power is only present in the frequency bands ranging from 30-110 Hz. From the literature it is clear that the FHS signal lies in that range [5]. Similarly, processing the noisy FPCG data using the EMD, MHS was extracted and the spectrogram of it is represented in Figure 4.8, 4.10 and 4.12. It can be observed that the power lies in the frequency bands 10-60 Hz which is in consistency within the gold standard [24]. For additional validation the FHR and the MHR were computed manually and are presented in Table 4.3.
Table 4.3: Estimated FHR and MHR from EMD.
Standard Deviation of FPCG Noise (dB) FHR±SD (bpm) MHR±SD (bpm)
73.12 150±13 74±16
74.76 153±17 78±11
75.86 142±16 81±25
76.42 156±17 79±12
34
The accepted FHR range is 120-170 BPM [5]. As can be seen in Table 4.3, all computed FHR’s fall in the acceptable range. Similarly, the accepted range for MHR is 60-100 BPM and all the computed MHR’s fall in the said range.
4.7. Comparison Study
Different advanced signal processing methods like the EMD, wavelet decomposition and spectral subtraction have shown some promising results when applied on the simulated data. EMD has outperformed all the above-mentioned methods in terms of computation power required. On the other hand, spectral subtraction has provided some outstanding results even with a very low SNR. When wavelet decomposition was applied on the denoised signal from spectral subtraction the results obtained were exceptional. As the SNR was deteriorating the confidence with which the extracted signal was obtained was decreasing. However, the results obtained through EMD where phenomenal even though the SNR was as low as -26.7. EMD was successful in denoising and decomposing the signal in a single step and was robust to noise. Whereas, spectral subtraction and wavelet decomposition have to be applied in conjunction which are computationally expensive and can perform better only when SNR is high. Additionally, all the computed FHR and the MHR were in the acceptable heart rate ranges.
In addition, adaptive filtering was theoretically tested. It induced certain ringing to the signal when a clean signal was given as the input. Adaptive LMS algorithm was evaluated where the cost function was mean squared error. It performed reasonably well for the estimation of the FHS from a noiseless FPCG was given as input and MPCG was given as the reference input.
35
CHAPTER 5: CONCLUSIONS AND OUTLOOK TO FUTURE
5.1. Conclusions
In this thesis, various advanced signal processing methods were developed to separate fetal and maternal bio-signals from a single channel FPCG signal. Spectral subtraction, EMD and wavelet decomposition were tested for varying SNRs ranging from -4.4dB to -26.7dB. EMD, spectral subtraction with wavelet decomposition were successful in extracting both FHS and MHS with extreme fidelity. On the other hand, adaptive filtering algorithm was tested for the data that was manually simulated without any noise. The results were finally quantitatively and qualitatively validated by computing the heart rates and spectrograms, respectively.
It was observed that EMD is robust to noise. Even when the SNR ratio was decreasing the algorithm continued to give better results when compared to wavelet decomposition used in combination with spectral subtraction. However, when the SNR was high, wavelet decomposition in conjunction with spectral subtraction gave better results. This can be explained by the fact that wavelet decomposition incorporates decomposition of only the low frequencies components of the FPCG signal. Whereas in EMD the signal iteratively explores from high frequencies to low frequencies while retaining the signal information. An additional reason is IMF’s being intrinsic to the time scales of the original signal.
On the other hand, adaptive LMS filtering technique, has been studied and developed. The algorithm has been implemented changing the step size as well as the number of filter weights. There was a ringing observed to decrease in the estimated signal when the number of filter weights was reduced. However, the estimated signal was not as expected.
36
In conclusion, various advanced signal processing algorithms have been compared and contrasted. All the results were validated by computing the spectrogram as well as computing the heart rates. It was found that EMD was robust to noise while, spectral subtraction in combination with wavelet decomposition was successful in extracting signal of interest with extreme fidelity when SNR was high.
5.2. Future Research
Although EMD and wavelet decomposition algorithms were efficient enough to extract the FHS and MHS from the synthetic FPCG signal, the influence of in-band noise was evident in the spectrogram making it difficult to interpret the frequency range of MHS signal. However, the proposed framework needs to be extended to clinically acquired FPCGs. In the context of adaptive filtering, other major techniques like the RLS algorithm needs to be applied. Also, as a part of analysis, the feasibility of extracting other vital bio signals like the respiration and the MUC should be assessed. Additionally, the computation of the maternal and the fetal heart rate needs to be automated and validated using the clinical data.
In addition to extract other vital bio signals, the current study can be refined to detect the short-term variability in the Fetal Heart Rate with better confidence compared to the existing gold standards like the cardiotocographs.
37
REFERENCES
[1] Centers for Disease Control and Prevention, "Emergency Department Visits," National Center for Health Statistics, 2017.
[2] M. Howard Herrell, Sonic Elephant, [Online]. Available: http://www.ob-efm.com/efm-basics/history/.
[3] M. Cesarelli, M. Ruffo, M. Romano and P. Bifulco, "Simulation of foetal
phonocardiographic recordings for testing of FHR extraction algorithms," Comput Methods Programs Biomed, vol. 107, no. 3, pp. 513-523, 2012.
[4] P. C. Adithya, R. Sankar, W. Moreno and S. Hart, "Trends in Fetal Monitoring through Phonocardiography: Challenges and Future Directions," Biomedical Signal Processing and Control, vol. 33, pp. 289-305, 2017.
[5] D. M. Holburn and T. D. Rowsell, "Real time analysis of fetal phonography signals using the TMS320," in IEE Colloquium on Biomedical Applications of Digital Signal
Processing, 1989.
[6] R. M. Grivell, Z. Alfirevic, G. M. Gyte, D. Devane and R. M. Grivell, "Antenatal cardiotocography for fetal assessment," he Cochrane Database of Systematic Reviews, 2015.
[7] Mosby's Medical Dictionary, " 8th edition," 2009.
[8] M. DAVIS and E. POTTER, " INTRAUTERINE RESPIRATION OF THE HUMAN FETUS," JAMA, vol. 131, no. 15, p. 1194–1201, 1946.
[9] D. Talbert, W. Lyn, J. Frank, N. Abraham, N. Colley and S. David, "Wide bandwidth fetal phonography using a sensor matched to the compliance of the mother’s abdominal wall," IEEE Transactions on Biomedical Engineering, vol. 33, no. 2, pp. 175-181, 1986. [10] J. MacDonnell, "Knowledge based interpretation of fetal phonocardiographic signals,"
Transactions of the IEEE, 1990.
[11] V. Chourasia and A. Tiwari, "Development of a signal simulation module for testing of phonocardiography based prenatal monitoring systems," in Annual IEEE India Conference, Gujarat, 2009.
38
[12] J. Nagel, "New diagnostic and technical aspects of fetal phonocardiography," Sci. Direct, vol. 23, no. 9, 1986.
[13] A. Z. M. K. S. Zahoriana, "Dual transmission model and related spectral content of the fetal heart sounds," Computional Methods Programs Biomedical, vol. 08, no. I, pp. 20-27, 2012.
[14] J. G. A. and J. J. C., "Extracting sources from noisy abdominal phonograms: a single-channel blind source separation method," in 4th IET International Conference on Advances in Medical, Signal and Information Processing, 2009.
[15] D. Talbert, W. Lyn, J. Frank, N. Abraham, N. Colley and S. David, "Wide bandwidth fetal phonography using a sensor matched to the compliance of the mother’s abdominal wall," IEEE Trans. Biomed. Eng. 33, vol. 2, no. 7, 1986.
[16] V. A. B. K. Vadali, S. Pandey and P. C. S. R. Aditya, "Fetal PHonocardiography Decomposition Framework," in IEEE SoutheastCon, Tampa, 2018.
[17] B. Z. Wu and N. E. Huang, "A study of the characteristics of white using the empirical mode decomposition method," Proc. R. Soc.London, vol. vol. A, no. no. 460, p. 1597– 1611, 2004.
[18] S. V. Vaseghi, Advanced Signal processing and Digital Noise Reduction, NY: John Wiley & Sons, Inc.,, 1996.
[19] G. AL, A. LAN, G. L, H. JM, I. PCh, M. RG, M. JE, M. GB, P. C-K and S. HE,
"PhysioBank, PhysioToolkit, and PhysioNet: Components of a New Research Resource for Complex Physiologic Signals.," Circulation , vol. 101, no. 23, pp. e215-e220, 2000. [20] R. M, C. M, R. M, B. P and F. A, " An algorithm for FHR estimation from foetal
phonocardiographic signals," Biomedical Signal Processing and Control , vol. Jan, no. 5, pp. 131-141, 2010.
[21] M.Cesarelli, M.Ruffo, M.Romano and P.Bifulco, "Simulation of foetal phonocardiographic recordings for testing of FHR extraction algorithms," CMPUTER METHODS AND
PROGRAMS IN BIOMEDICINE, vol. I, no. 07, pp. 513 - 523, 2012.
[22] S. V. Vaseghi, Advanced Signal processing and Digital Noise Reduction, NY: John Wiley & Sons, Inc.,, 1996.
[23] A. Goldberger, L. Amaral, L. Glass, J. Hausdorff, P. Ivanov, R. Mark, J. Mietus, G. Moody, C.-K. Peng and H. Stanley, "Components of a New Research Resource for Complex Physiologic Signals," PhysioBank, PhysioToolkit, and PhysioNet, vol. 101, no. 23, pp. e215-e220, 2000.
39
[24] M. Portnoff, "Magnitude-phase relationships for short-time Fourier transforms based on Gaussian analysis windows," IEEE International Conference on Acoustics, Speech, and Signal Processing, vol. 4, pp. 186-189, 1979.
40
APPENDIX A: COPYRIGHT PERMISSIONS
41
A.2. Permission to Use Published Content in Chapter 3, Section 3.2 and Chapter 4,
44

![Figure 2.3: Time- frequency representation of simulated FHS. Data obtained from [8] [9]](https://thumb-us.123doks.com/thumbv2/123dok_us/10119809.2912550/19.918.170.748.234.737/figure-time-frequency-representation-simulated-fhs-data-obtained.webp)