C
LOUD-
BASEDS
OFTWAREP
LATFORM FORD
ATA-D
RIVENS
MARTG
RIDM
ANAGEMENT Yogesh Simmhan, Saima Aman, Alok Kumbhare, Rongyang Liu, Sam Stevens, Qunzhi Zhou and Viktor Prasanna, University of Southern California, Los Angeles, USAABSTRACT
There is a global effort to incorporate pervasive sensors, actuators and data networks into national power grids. This Smart Grid offers deep monitoring and controls, but needs advanced analytics over millions of data streams for efficient and reliable operational decisions. This article focuses on Cloud technologies used in a scalable software platform for the Smart Grid Cyber-Physical System. Dynamic Demand Response (D2R) is a challenge application that we target on the USC campus
microgrid to perform intelligent demand-side management and relieve peak load. Our platform offers an adaptive information integration pipeline to ingest dynamic data; a secure repository for researchers to share knowledge; scalable machine-learning models trained over massive datasets for agile demand forecasting; and a portal to visualize consumption patterns. Our design incorporates hybrid Clouds, including IaaS, PaaS, public and private, which suit the unique component needs for on-demand provisioning, massive scaling, and manageability, and helps us expand from the microgrid to the Los Angeles power grid.
1.
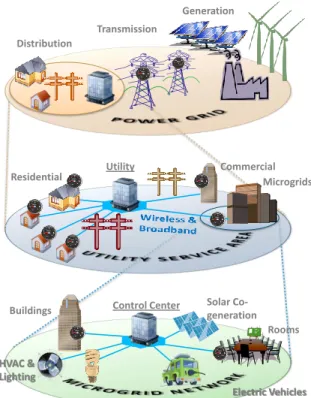
THE SMART GRID CYBER-PHYSICAL SYSTEMEnergy security and environmental sustainability are global concerns with immense societal impact. Significant energy assets go toward electricity generation, and the power sector is expected to grow worldwide [1]. Electricity is a pervasive service whose reliable supply is essential for the modern civilization, and its efficient generation and consumption is becoming equally important. Belying its vital importance, the power grid’s infrastructure improvements have not kept pace with time – the US Power Grid is the largest interconnected “machine” in the world, and nearly a century old. However, technology changes are starting to permeate through the entire grid, from generation to transmission to distribution (Figure 1). Renewables like wind and geo-thermal are being included into the generation mix, not just by the power utilities but also by their consumers through rooftop solar panels. Long distance transmission networks are being instrumented with Phasor Measurement Units to detect grid instability within milliseconds and take corrective actions to prevent cascading failures. Smart meters are being deployed at consumer premises to monitor real-time power consumption and securely communicate them back to the utility over wireless or broadband networks. These same meters can also receive signals from the utility that provide dynamic power pricing and incentives for reducing load during peak periods. Building and Home Area Networks can sense and control “smart” home appliances like washing machines, air conditioning units and electric vehicles’ charging to balance convenience against energy efficiency. As a consequence, the modern power grid is transforming into a Cyber-Physical System (CPS), where physical infrastructure and computational cyber-infrastructure must coordinate to ensure an efficient and reliable power grid [2]. However, this transformation is not without challenges. Existing grid operations require a human-in-the-loop to a surprising degree. Renewables such as wind and solar are inherently unreliable and cause the electricity supply to be increasingly susceptible to the vagaries of nature. On the demand-side, intelligent appliances, adoption of
electric vehicles, and rooftop solar panels make the consumer load profile variable. Any demand-supply mismatch causes grid instability unless rapidly rectified. In the absence of computational and analytics support for automated decisions, the human grid operators are ill equipped to examine and utilize millions of data and control points for managing the dynamism in energy patterns. Making the power grid smart [3] depends on the ability to wrangle the unprecedented influx of sensing data to draw insights into the system behavior and automate the available controls. This is, interestingly, a
“Big Data” challenge that requires advanced
informatics techniques and cyber-infrastructure. Energy use events streaming from millions of smart meters, sampled at 15 mins, need to be collected and correlated with a consumer’s historical profile. Data mining and pattern matching are necessary for online detection of critical situations and
to correct them with low latency to ensure grid stability. Analytical and computational models can help predict the power supply and demand within a service area to take preemptive actions for curtailing demand by notifying and incentivizing consumers. These efforts are multi-disciplinary, and require power engineers, data analysts, behavioral psychologists, and microgrid managers to collaboratively share knowledge for optimal operations, with the active participation of consumers. In this article, we describe our experiences building a Cloud-based software platform for data-driven analytics that takes us a step toward the Smart Grid vision. Our efforts are part of the Los Angeles Smart Grid Project, sponsored by the US Department of Energy and the Los Angeles Department of Water and Power, underway since 2010. In particular, we address dynamic demand-response optimization (D2R), where supply-demand mismatch has to be detected, and corrected by
initiating demand-side management [4]. D2R is a unique challenge application, and we have
developed data-driven predictive models to forecast future demand and decide curtailment strategies to reliably achieve load reduction by consumers. Our software platform supports D2R
activities through a semanticinformation integration pipeline to ingest real-time data from sensors and dynamic data sources; a secure repository for researchers and engineers to collaborate and share data and results; scalable machine-learning models that are trained over massive historical datasets to predict demand; and a web portal and mobile app to visualize current and historical energy consumption patterns. While the platform is being deployed for demonstration in the University of California’s (USC) Campus Microgrid, our goal is to ensure that it can expand to the city of Los Angeles. As a result, the platform is built to scale using a host of Cloud technologies.
FIGURE 1. The Smart Grid Cyber Physical System. From generation to transmission to distribution, with monitoring capability. Microgrids in the utility’s service area enhance sensing and actuation over inter/intranets.
Generation Transmission
Distribution
Microgrids Residential Utility Commercial
Control Center Rooms Buildings HVAC & Lighting Solar Co-generation Electric Vehicles
2. D2R IN THE USCCAMPUS MICROGRID
The Los Angeles Smart Grid Project is a five year research and demonstration project into transforming the largest municipal utility in the US into a Smart Grid. Besides deploying smart meters to 50,000 customer premises, it will explore, develop and demonstrate effective tools and technology for the power grid. Specifically, our group is investigating the informatics possibilities and software challenges in bringing about this advance.
The Los Angeles Department of Water and Power (LADWP) serves 4.1 million consumers and accounts for nearly 1% of the total US electric energy consumption [5]. LADWP has a net generation capacity of 7,100 MW, of which renewable energy will account for 33% by 2020. Over 60% of this renewables mix is from intermittent sources like wind and solar. Wind power plants have unpredictable production variability, and are usually not aligned with the daily consumer usage cycle, where peak loads occur mid-day. Solar photovoltaic generation is more aligned with the daily load, but their output can change rapidly with cloud cover, dropping by 50% within a minute. Demand response optimization (DR) is an approach to reduce customers’ consumption, in response to a peak energy signal from the utility, by shifting, shaving and shaping electricity load. It contrasts with energy efficiency by soliciting curtailment on-demand only during periods of supply-demand mismatch. Peak loads may be caused by a drop in the supply from renewable generation or an increase in the demand due to, say, a heat-wave in a region. Current grid technology limits DR to static strategies, such as time-of-use pricing and day-ahead notification based on historical averages. But Smart Grid infrastructure offers instantaneous communication capability between the utility and the customer, and automated controls at residences and buildings that enable dynamic demand response optimization (D2R) for near real-time detection, notification and response.
However, besides the hardware infrastructure, the key to successful D2R is intelligent decision
making on when, by how much, and whom to target for reliable and accurate curtailment, and this requires advanced data analytics. The benefits of D2R are considerable. It increases the reliability of
the grid by using the customers as a virtual energy source during peak periods (negative demand →
positive supply); by lowering the peak, it avoids the need to build power plants for standby capacity; it limits the environmental impact since the cleanest energy is to avoid using energy; and it helps integrate renewables by using demand-side management to address supply fluctuations. While LADWP upgrades their Smart Grid infrastructure, the USC campus microgrid serves as a testbed to develop and validate end-to-end D2R technologies. The microgrid encompasses 100
diverse buildings used by a community of over 50,000 students, staff and faculty, and is the largest power private consumer for LADWP. The microgrid is also highly instrumented. Every building has a smart meter, and equipment sensors to monitor, say, Heating, Ventilation and Air Conditioning (HVAC) unit’s airflow and set point temperature. The microgrid also has direct controls over these equipment from the Energy Control Center to initiate direct load curtailment programs. These use the campus Ethernet as the communication backbone. This comprehensive microgrid ecosystem, including the infrastructure and the energy “consumers”, makes the USC campus a living laboratory for power engineers, behavioral scientists, analysts and facility managers to study best practices for D2R, with the goal of scaling to LADWP. In particular, it offers a real-world environment for us to
3. D2RSOFTWARE PLATFORM ON CLOUDS The two key ingredients for
successful and agile D2R
operations are demand forecasting and curtailment strategy selection, both of which act as a closed loop system on the microgrid. In a data-rich Smart Grid, these decisions are guided by data analytics and mining that must scale with the number of buildings and customers, and
the temporal granularity of decision making. Further, the research aspects of our project require that we learn from the operational impact of D2R and offer techniques for diverse conditions.
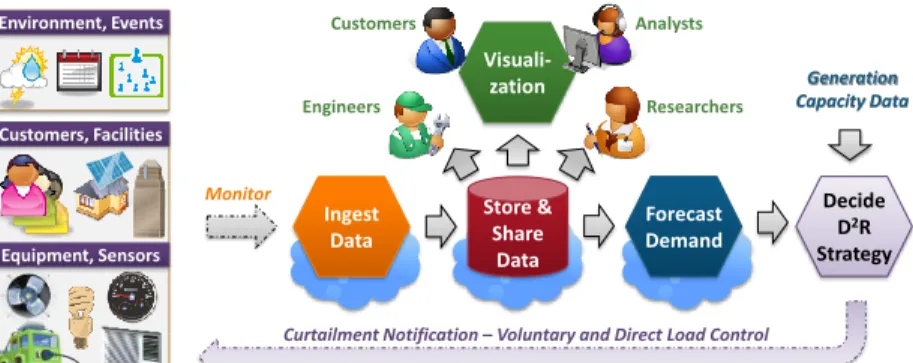
Figure 2 shows the lifecycle of D2R operations within the USC campus microgrid and components of
our software platform that support it. Most of these components, shown with a blue cloud backdrop, are hosted on Clouds [6]. We also use different flavors of Clouds, including public and private Clouds, as also Infrastructure as a Service (IaaS) and Platform as a Service (PaaS). The choice of the Cloud flavor for each component is based on their specific needs, which include elastic resource acquisition, platform manageability, data reliability, and scalable programming abstractions. As a consequence, our software platform is seamlessly layered on top of hybrid Cloud and cluster infrastructure. Here, we provide an overview of the platform architecture and the D2R lifecycle.
First, data has to be acquired from thousands of equipment sensors and smart meters in campus buildings through the USC energy control system. These include instantaneous data sampled and streamed periodically, as well as historical data aggregated over several years that need to be bulk-loaded. Behavioral research and end-use analysis require not just sensor data but also the context for energy use. This entails collecting information on ambient weather, organizational structure, building construction, scheduling of facilities, office space assignment, and consumer surveys. These slow changing datasets need to be updated periodically, and the sources themselves may change over time. As a result, an automated data ingest pipeline has to support dynamic data acquisition at variables rates and volumes, and be adaptive to current data sources and operational needs. We have developed the Floe continuous dataflow engine, to compose and orchestrate a modular semantic information integration pipeline for the microgrid [7], that uses private Cloud infrastructure for on-demandresource elasticity (Section 4).
Data acquired by the pipeline has to be stored and shared with different D2R applications. These
applications vary from operational analytics for initiating D2R curtailment strategies, to researchers
mining and exploring data for correlations, to consumers visualizing and gaining knowledge on their energy profile. The need for data collaboration has to be balanced against the concerns of data security, since survey data and even fine-grained sensor data may reveal intrusive details about people and their activities. We use public Cloud storage platforms that offer a manageable and FIGURE 2. D2R Lifecycle in USC Campus Microgrid using our Cloud-based
Software Platform. It forms an observe, orient, decide & act (OODA) loop.
Customers, Facilities Forecast Demand Ingest Data Store & Share Data Visuali-zation Decide D2R Strategy Generation Capacity Data Equipment, Sensors Environment, Events Engineers Analysts Researchers Customers Monitor
reliable data hosting solution for distributed access and co-location with compute resources for analytics. Also, we also address data sharing and privacy issues posed on untrusted public Clouds through our Cryptonite secure data repository, details of which are discussed elsewhere [8].
Data-driven forecasting models are essential for D2R, and there are two key classes of these. Demand
forecasting models predict the energy consumed (in KWh) at different spatial and temporal granularities, say, at intervals of 15 mins for individual or aggregate buildings during the next few hours or the day after. Curtailment forecasting models offer predictions on potential energy reduction (negative KWh), at intervals of 15 mins relative to a baseline demand, when using different strategies on buildings or consumers at specific time periods. Once both these predictions are available, D2R strategy selection can be performed as an optimization problem. These
data-driven models are trained using historical data on the microgrid behavior, and utilize large dimensions of features that are direct and indirect indicators of energy demand or reduction. In particular, our demand forecasting models use regression tree machine learning and ARIMA1
time-series to offer high accuracy for D2R. However, model training is computationally costly and
data-intensive. Our OpenPlanet regression tree learning application [9] uses the Hadoop MapReduce platform for performing these analytics, and is optimized to scale on private Cloud infrastructure
(Section 5).
Lastly, there are two types of information dissemination in the microgrid with their individual goals: to learn and to act. Sharing details of their energy footprint with consumers on campus helps them feel like an active partner in responsible energy usage. We achieve this through a Smart Grid portal and a companion Android mobile app that provide visualization of current and historical energy use in the campus microgrid. The content for the visualization is served by our data repository. This learning is complemented by “action” notifications that are propagated to individual consumers, using both mailing lists and push notification to the mobile app, during periods of D2R curtailment. The actual customers and buildings to target during a peak load period
is determined by the D2R strategy selected using analytics.
4. DYNAMIC INFORMATION INTEGRATION PIPELINE
Scientific workflows and dataflows provide a convenient abstraction for composing data transformation pipelines and in silico experiments using interconnected building-block tasks [10]. These are then run on local workstations or remote cyber-infrastructure using workflow engines that orchestrate the task execution and data exchanges between them. Despite their growing popularity and ease of use, existing workflow engines have limited support for processing continuous data streams with the same flexibility and efficiency as processing files. Support for both bulk data files and dynamic streaming data, which scales to thousands of sensor streams with low latency processing, is essential for composing data acquisition pipelines for the Smart Grid CPS. Further, these pipelines when running in an operational setting are in an “always on” mode. Hence any change to the pipeline’s composition has to done in-place, without loss of in-flight data. This form of application dynamism is, again, not considered by contemporary workflow systems.
We have developed the Floe dataflow framework that offers novel data abstractions for composing hybrid dataflows that include file and stream processing, and is designed to operate continuously (Figure 3, bottom). User’s dataflows are designed as acyclic graphs whose nodes are the application logic, or pellets, and the directed edges represent data transferred between them. Floe uses decentralized orchestration so that data is directly exchange between pellets without passing through a central coordinator. This reduces the latency of message or file transfers, and removes bandwidth bottlenecks. The framework
manages pellet-to-pellet message channels and triggers pellet execution. Pellets can iterate over incoming messages or have it pushed to them as a call-back. Data parallelism is intrinsic; users can simply flag pellets to operate sequentially or concurrently on incoming messages.
The Floe coordinator is responsible instantiating the Floe graph, including pellets and their dataflow wiring, on computational resources allocated by the Floe resource manager. The coordinator starts the execution and monitors the status of the continuous dataflow. One of the novel features of Floe is the ability for users to dynamically recompose the dataflow graph at runtime. Currently, this is limited to in-place updates of the pellet. This allows users to “upgrade” their pellet’s application logic without interrupting the continuous dataflow execution. The coordinator silently pauses and resumes the dataflow to perform this dynamic application update. Floe is designed from the ground-up to operate on Cloud infrastructure, besides traditional cluster environments. The framework can implicitly scale-out and scale-in on elastic Cloud virtual machines (VMs) based on current processing needs. It also supports multi-core processing, and can scale-up and scale-down the number of cores used within a VM. The manager acquires and releases VM instances from the Cloud service provider. Individual pellets have exclusive use of one or more CPU cores on a VM, and pellets are sandboxed from each using Java 7’s ForkJoinPool. The framework
can dynamically change a pellet’s core allocation at runtime to meet user-specified quality of service (QoS) metrics such as message latency time or CPU usage thresholds. For data parallel pellets, the framework can additionally tune the concurrency level by increasing the thread parallelism. These optimizations are done automatically and are transparent to the user.
The Smart Grid information integration pipeline [7] is composed as a Floe graph (Figure 3, top). The pipeline has four logical stages that handle datatransport from remote data sources, dataparsing to interpret the structure and semantic annotation to enrich the data context, and data storage to persist the information to a data repository. The pipeline itself is composed modularly so that a suite of pellets are available for each stage, and they can be combined together to support different FIGURE 3. Floe Framework design on Cloud infrastructure
(bottom). Semantic Information Integration Pipeline is composed and executed using it (top).
Sensor Transport Event Parser File Transport Web Transport Document Parser Semantic Annotate Data Store Insert Data Store Update
Cloud Infrastructure Provider Allocate Launch Acquire/Release Initiate Compose Floe Framework
types of data sources over time. For example, the sensor transport pellet can frequently pull events from sensors over the building control system network, the document parsing pellet can interpret CSV an Excel files and disaggregate them into individual data items, the semantic event annotation pellet can relate events from sensors with the buildings where the sensors are deployed and the department that is housed in the building to create semantic RDF triples2, and the SPARQL3 insert
pellet can store the RDF triples to a semantic database. The pipeline is one homogeneous dataflow and simultaneously supports multiple data sources. So event data that may come from different transport pellets, say real-time sensor events and an FTP file with archived events, will all eventually flow through the same semantic event annotation pellet.
The Floe framework is used to execute the pipeline on a private Eucalyptus IaaS Cloud on the USC. The Cloud has 16 nodes with 8 Opeteron CPU Cores connected though gigabit Ethernet. The framework deploys the pipeline on VMs dynamically acquired from Eucalyptus and scales the pellets up and down on a VM to adapt to changing sensor data sampling rates and to bulk data loads that occur every day. The pipeline runs round the clock and is used to load the semantic data repository that support the Smart Grid portal and mobile apps.
Semantic ontologies play a key role in our information architecture. The diversity of data sources and types from multi-disciplinary groups in the microgrid means that not everyone is an expert on all available information, but will potentially need to use it for research or operations. We integrate multiple ontologies on power and sensor systems, earth and environmental sciences, infrastructure and organizations, and spatio-temporal concepts, along with concepts unique to Smart Grids such as curtailment strategies and prediction models into a single interconnected ontology. Data items from different sources are mapped to concepts in this ontology by the semantic annotation pellets and that implicitly provides more context for that data item. So an energy consumption event coming from the D55Watts sensor is conceptually connected to the KAP building in which it is deployed, and further related to the Civil Engineering department that uses the building, and onto a consumer Alice who is in the department and signed up to participate in energy curtailment. This offers a powerful and holistic knowledge platform from which to extract features and model system and consumer behavior for D2R activities.
5. SCALABLE DEMAND FORECASTING
Demand forecasting at utilities has typically been done for the entire service area or at the substation level since power load data from SCADA4 monitoring systems were only available at that
spatial granularity. These forecasts either use statistical averages over historical demand, which are simple but less accurate, or computational power flow models that have better accuracy but are complex, requiring a thorough understanding of the system interactions. The advent of smart meters that provide energy use data from millions of individual consumers at temporal resolutions of once every 15 mins offers the possibility of more fine-grained forecasting. However, statistical averages are highly sensitive to variations as the granularity reduces and it is not sustainable to hand-craft computational models for individual consumers. Figure 4(a) shows the one year
2 Resource Description Format (RDF), www.w3.org/RDF
3 SPARQL Protocol and RDF Query Language (SPARQL), www.w3.org/TR/rdf-sparql-query 4 Supervisory Control And Data Acquisition (SCADA)
aggregate energy use for the USC campus, at 15 min intervals (96 intervals per day). The plot exhibits the temporal variability of energy use, with peaks at midday and base load at nights, and also seasonal highs in late fall and lows during the summer break.
Data-driven modeling has proved viable as the fourth pillar of science [11], and we leverage its potential for demand forecasting in smart power grids. In particular, we have explored machine learned models that utilize not just the historical energy demand time-series but also information about indirect influencers of energy. In the data-rich campus microgrid environment, features such as building area, year of construction, number of occupants, classroom schedules, ambient temperature, HVAC setpoint temperature, external weather, and the academic calendar affect energy use in that building. Our machine learning models are trained on historical datasets that contain these features and the corresponding energy use at 15 min intervals for each feature vector. Based on our investigations, we have adopted Regression Tree modeling for our forecasting [12]. Upon training, this model gives a decision tree structure where each node is a decision point based on one feature (e.g. Outside Temperature > 75’F), and navigating down the tree through different nodes (e.g. Building Net Area < 8000, Day of the Week ∈ <Mon, Wed>) leads to a leaf which is as a linear regression function that can be evaluated to a numerical KWh value. So given a time period in the future with a set of feature vectors for every 15 min interval it contains, the decision tree can predict an energy demand value for each vector. In addition to the regression tree model which is used for medium (1-7 days in advance) and long term (1-12 months in advance) predictions, we also use the ARIMA time-series model for near term (1-24 hours in advance) predictions. ARIMA is also trained on historical energy demand, but does not use additional features. Figure 4(b) shows energy use predictions made for five days by the regression tree (48 hours in advance) and ARIMA (6 hours in advance) models that we train for a single campus building. When compared against the actual observed demand during the period, we see CV-RMSE errors of 6.0% and 6.7% for the two models. ARIMA is good at following trends but falters when switching between weekdays and weekends. Regression Tree predicts more ahead in time but is less smooth, though its overall error is smaller.
FIGURE 4(a). Surface plot of campus energy use at 15 min intervals in one year. Daily phases & seasonal variations across semesters are seen.
FIGURE 4(b). Energy use observation and forecasts for a campus building for five days. ARIMA forecasts are done 6
hours ahead while Regression Tree is 48 hours ahead. 0 2 4 6 8 10 Ene rg y C o ns um pt io n (K W h )
Day & Time Intervals (Hours)
Observed ARIMA (–6 hours) Reg. Tree (–48 hours)
Data-driven models have several benefits, the biggest of which is the convenience of automatically building a model without in-depth technical knowledge on the system. The models can also be easily kept up to date by retraining them over new data that is collected. Further, it allows data analysts to try different combinations of features to find the ones that most significantly impact the energy demand. This can help scope data collection, or alternatively provide insights on reducing energy use. These models can also be constructed for different spatial and temporal granularities to trade-off against accuracy, and for different operational needs. In the campus microgrid, we train models for individual buildings, specific categories of buildings and the whole campus, and at 15 min intervals and 24 hour intervals. We observe that there is no “one size fits all” global model, and instead a collection of models are used for different purposes.
Making predictions using Regression Tree models is quick. But model training is data and compute intensive, and further exacerbated when feature parameter sweeps are to be done to train and select the best model on a daily or weekly basis. For e.g., 5 years of training data for 100 campus buildings has about 17 million feature vectors, and training one model takes 7 hours on a single quad-core server with 8 GB RAM due to memory pressure. Keeping in mind the need to scale to a city with 1.4 million customers, we use the Hadoop MapReduce platform on a private Cloud infrastructure. OpenPlanet is our implementation of the PLANET distributed regression tree algorithm [9]. OpenPlanet is designed as an iterative MapReduce application with up to three concurrent MapReduce jobs per iteration. Each iteration builds one level of the regression tree by splitting the feature vectors at each node at that level into two data partitions based on one feature condition such that it maximizes their variance. The iterations continue till the data partitions reduce to a certain size, after which we switch to the Weka Java machine learning library to complete the remaining subtrees.
OpenPlanet incorporates several optimizations that improve its performance and scalability on elastic Cloud resources. The point where we switch from the MapReduce iterations to Weka is important. Weka builds the regression (sub)tree completely in-memory unlike MapReduce which does large scale I/O reads for each level of tree building. So, the more of the tree that can be built using Weka, the better the performance. We use this intuition to tune the switch condition such that the data partition size is just small enough to fit within the available physical memory on a machine. The second optimization seeks to improve the utilization of MapReduce worker slots, which are a multiple of the number of CPU cores. MapReduce workers operate on independent blocks of data and we observe that the default block size of Hadoop does not create sufficient blocks to keep all workers active. As a result, OpenPlanet does not scale with the number of compute nodes due to idle workers. We address this by tuning the block size to ensure there are enough blocks for all workers. These two optimizations help us achieve a 75% improvement in training time.
We train models for the microgrid using OpenPlanet running on the FutureGrid cyber-infrastructure, which offers on-demand deployment and configuration of Hadoop on a private Cloud environment. When a data analyst wishes to train a model, our D2R software platform creates
a Hadoop environment on FutureGrid, transfers the OpenPlanet binaries and training data from a USC server to the FutureGrid machines, and initiates the OpenPlanet application. Trained models are moved back to the USC server and predictions are done locally for operations and analysis.
6. CONCLUSION
We are at year three of this five year effort to investigate a software platform for D2R in Smart Grids.
Cloud computing has proved essential in our design. However, our experience shows that picking the right Cloud abstraction for individual components in the architecture is necessary to trade-off the associated benefits and the overheads. Limitless resources in distributed data centers offered by commercial Cloud providers eases data sharing and analytics on-demand, but comes with a real monthly bill. Private Clouds offer physical security over personal data, yet manageability of the hardware remains a concern. IaaS Clouds offer fine controls over elastic resources, but present a technical challenge (research opportunity?) in designing frameworks that efficiently utilize their capabilities. PaaS Clouds such as Hadoop reduce the time to build scalable applications but squeezing good performance still requires extensive tuning. In light of these, complex software systems will often need to operate on hybrid Cloud infrastructure.
Our software platform recently won the IEEE International Scalable Computing Challenge (SCALE) for 2012, in recognition of applying scalability principles to the Smart Grid domain with real-world impact. But there are further opportunities for novel Cloud research that Cyber-Physical Systems (CPS) like Smart Grids pose. Application resilience is one such topic that we are pursuing in the context of Floe. CPS requires mission critical applications that must run continuously, reliably, predictably, and at scale. The commodity hardware and multi-tenancy of Clouds means that the infrastructure behavior is non-uniform and suffers from sporadic faults. Programming frameworks that are robust to such dynamism are essential to build and run CPS applications on Clouds. We are also examining additional data analytics and optimization techniques for performing curtailment predictions and strategy selection to close the D2R loop. Scalability and responsiveness will remain
a key factor here as we transition into operationalizing the platform within the microgrid.
The impact of our work goes beyond demand response optimization, and demonstrates to the Smart Grid domain – still in its infancy – the value of Cloud computing and data-driven analytics for efficient, intelligent and sustainable management of the power grid infrastructure. In addition, our software platform is generalizable to other CPS domains such as Smart Transportation that exhibit similar characteristics.
ACKNOWLEDGMENTS
This material is based upon work supported by the United States Department of Energy under Award Number DEOE0000192, the Los Angeles Department of Water and Power (LA DWP), and the National Science Foundation under Award CCF-1048311. The views and opinions of authors expressed herein do not necessarily state or reflect those of the United States Government or any agency thereof, the LA DWP, nor any of their employees. We thank FutureGrid for resources provided under NSF Award 0910812.
REFERENCES
1. International Energy Outlook Report, U.S. Energy Information Administration (EIA), 2011
2. The New Frontier of Smart Grids, Xinghuo Yu, C. Cecati, T. Dillon, Simões, M.G., IEEE Industrial Electronics Magazine, 2011.
3. Putting the 'Smarts' Into the Smart Grid: A Grand Challenge for Artificial Intelligence, Sarvapali D. Ramchurn, Perukrishnen Vytelingum, Alex Rogers, Nicholas R. Jennings, Communications of the ACM, Vol. 55, No. 4, April 2012, Pages 86-97
4. Automated Demand Response: The Missing Link in the Electricity Value Chain, A. McKane, I. Rhyne, A. Lekov, L. Thompson, and M.A. Piette, ACEEE Summer Study on Energy Efficiency in Buildings, 2008 5. 2012 Power Integrated Resource Plan with Appendices (Draft), Los Angeles Department of Water and
Power, October 5, 2012.
6. Towards Data-driven Demand-Response Optimization in a Campus Microgrid, Simmhan, Y.; Prasanna, V.; Aman, S.; Natarajan, S.; Yin, W. & Zhou, Q., in ACMWorkshop On Embedded Sensing Systems For Energy-Efficiency In Buildings, 2011.
7. Semantic Information Modeling for Emerging Applications in Smart Grid, Q. Zhou, S. Natarajan, Y.
Simmhan and V. Prasanna, in International Conference on Information Technology : New Generations, 2012 8. Cryptonite: A Secure and Performant Data Repository on Public Clouds, A. Kumbhare, Y. Simmhan and V.
Prasanna, in IEEE International Cloud Computing Conference, 2012
9. Scalable Regression Tree Learning on Hadoop using OpenPlanet, W. Yin, Y. Simmhan and V. Prasanna, in
International Workshop on MapReduce and its Applications (MAPREDUCE), 2012
10. Workflows and e-Science: An overview of workflow system features and capabilities, E. Deelman, D. Gannon, M. Shields, and I. Taylor, Future Generation Computer Systems, Vol. 25, No. 5, May 2009, 528–540. 11. The Fourth Paradigm: Data-Intensive Scientific Discovery, Edited by Tony Hey, Stewart Tansley, and
Kristin Tolle, Microsoft Research, 2009
12. Improving Energy Use Forecast for Campus Micro-grids using Indirect Indicators, S. Aman, Y. Simmhan and V. K. Prasanna, in International Workshop on Domain Driven Data Mining, 2011.
BIOGRAPHIES
Yogesh Simmhan is a Research Assistant Professor of Electrical Engineering and Associate Director of the Center for Energy Informatics at USC. He leads the research efforts into building a scalable software platform to support Smart Grids and is exploring its broader applicability to cyber-physical systems. His interests are in distributed data and computing systems, and spans Cloud and Distributed Computing, distributed data and metadata management, and dataflow programming abstractions.
Saima Aman is a Doctoral student in the Computer Science department at USC. Her interests are in machine learning and data mining as applied to the Smart Grid domain.
Alok Kumbhare is a Doctoral student in the Computer Science department at USC. His interests are in resilient workflow frameworks for mission critical applications on Clouds infrastructure, with application to cyber-physical systems.
Rongyang Liu is a Masters student in the Electrical Engineering department at USC. His interests are in optimization algorithms and computer architecture.
Sam Stevens is a Masters student in Green Technology at USC. His interests are in portal and mobile applications that can benefit sustainable energy management.
Qunzhi Zhou is a Doctoral student in the Computer Science department at USC. His interests are in semantic web and complex event processing.
Viktor Prasanna is Charles Lee Powell Chair in Engineering, Professor of Electrical Engineering and Professor of Computer Science, and the director of the Center for Energy Informatics at USC. He is the principal investigator leading the demand response optimization efforts of the Smart Grid project. His research interests include High Performance Computing, Parallel and Distributed Systems, Reconfigurable Computing, Cloud Computing and Embedded Systems.