Universit ¨at Karlsruhe (TH)
Institut f ¨urBetriebs- und Dialogsysteme Lehrstuhl Systemarchitektur
Using Operating System Instrumentation and
Event Logging to Support User-level
Multiprocessor Schedulers
Jan St ¨oß
Diplomarbeit
Verantwortlicher Betreuer: Prof. Dr. Frank Bellosa Betreuender Mitarbeiter: Dipl.-Inf. Volkmar Uhlig
Hiermit erkl¨are ich, die vorliegende Arbeit selbstst¨andig verfaßt und keine anderen als die angegebe-nen Literaturhilfsmittel verwendet zu haben.
I hereby declare that this thesis is a work of my own, and that only cited sources have been used.
Karlsruhe, den 24. M¨arz 2005
Abstract
This work presents a novel approach to support multiprocessor scheduling at user-level. We propose to use system instrumentation and event logging to obtain run-time information relevant for scheduling, from different system sources such as the hardware, operating system components, or application programs.
We instrument the system components with event log handlers that record schedul-ing data in designated log files held in memory. The user-level scheduler can analyze and evaluate these log files to base its processor allocation policies on. Our approach allows for flexible, efficient, and scalable accumulation of scheduler-relevant run-time characteristics; it was designed to be applicable both to user-level components, and to the safety-critical operating system kernel. To demonstrate our approach, we have developed a prototype logging infrastructure within a real-world, microkernel-based, component operating system. We successfully extract several run-time scheduling characteristics from different components, including timing properties and commu-nication patterns from the microkernel, and shared-memory usage from a user-level device driver subsystem. Measurements indicate an undramatic overhead for logging, with baseline logging costs between about 26 and 275 clock cycles on an Intel 2.2 GHz Xeon Processor, and application-level overhead on driver throughput of about 3.8 percent for logging kernel-based communication, and about 10.5 percent for logging shared memory usage.
Acknowledgments
First, and foremost, I want to thank my advisors, Volkmar Uhlig and Prof. Dr. Frank Bellosa. Without their assistance, encouragement, and expertise, this work would not have been possible.
I would like to thank all members of the System Architecture Group at Karlsruhe, for providing a productive, inspiring, and collegial work environment. Further I want to thank Pedram Azad and Gerd Liefl¨ander for proofreading my thesis, and Joshua LeVasseur for patiently answering my questions about his driver framework. Thanks go also to Sebastian Biem¨uller, for his help in aesthetic questions.
Special gratitude is reserved for my parents, Anne and Karl-Hans St¨oß, for all their selfless support throughout my life and my studies. Finally, I want to thank Katrin Schulz, for her patience, for her support, and for bringing joy to my life.
Contents
Abstract v Acknowledgments vii 1 Introduction 3 1.1 The Problem . . . 4 1.2 Approach . . . 5 2 Related Work 7 2.1 Run-time characteristics used in Parallel Scheduling . . . 72.1.1 Usage of the Processor . . . 8
2.1.2 Usage of Processor-associated Resources . . . 8
2.1.3 Usage of Shared Resources . . . 9
2.1.4 System Load Indicators . . . 10
2.2 Approaches to Support Parallel Scheduling . . . 10
2.2.1 Kernel-Level Schedulers . . . 10
2.2.2 Application-Level Schedulers . . . 10
2.2.3 Two-Level Schedulers . . . 11
2.2.4 Extensible Kernels . . . 12
2.3 Tracing and Performance Monitoring Tools . . . 13
2.4 Summary . . . 13
3 Design 15 3.1 Requirements and Goals . . . 15
3.2 Proposed Scheme . . . 15
3.3 Logging and Instrumentation . . . 17
3.3.1 Log Events . . . 19
3.3.2 Component Instrumentation . . . 20
3.4 Log Control and Data Specification . . . 21
3.5 Log Data Accounting . . . 23
3.5.1 Accounting Domains and Logging . . . 24
3.5.2 Accounting Domain Management . . . 24
3.6 Log Data Aggregation . . . 26
3.6.1 Clustering Data . . . 26
3.6.2 Omitting Data . . . 27
3.7 Log Data Access and Scalability Considerations . . . 29
3.7.1 Scalability Requirements . . . 30
3.7.2 Data Accumulation . . . 30 1
2 CONTENTS 3.7.3 Data Sharing . . . 31 3.7.4 Memory Provision . . . 31 4 Implementation 33 4.1 Overview . . . 33 4.2 Environment . . . 34 4.2.1 The L4 microkernel . . . 34
4.2.2 The L4Ka Virtualization Environment . . . 34
4.3 Instrumentation of the microkernel . . . 35
4.3.1 Workload Characteristics Accruing in L4 . . . 35
4.3.2 Dynamic Instrumentation of Log Events . . . 40
4.3.3 The Log Handler . . . 42
4.3.4 Accounting Domains . . . 46
4.3.5 Data Aggregation Techniques . . . 48
4.3.6 Log Data Access . . . 49
4.4 Instrumentation of Applications and Device Drivers . . . 51
4.4.1 Scheduling Characteristics Accruing at User-Level . . . 52
4.4.2 Accounting Domains . . . 53
4.4.3 Log Control and Data Access . . . 54
4.5 Implementation of the Scheduler . . . 54
4.5.1 Configuring the Log Facility . . . 54
4.5.2 Parsing Log Buffers . . . 55
4.5.3 Deriving Scheduling Information . . . 56
5 Evaluation 59 5.1 Experimental Environment . . . 59
5.2 Baseline Log Performance . . . 59
5.2.1 Logging Overhead . . . 60
5.2.2 Log Analysis Overhead . . . 62
5.3 Application-Level Performance . . . 64
5.3.1 Memory Requirements . . . 66
5.3.2 Device Driver Throughput . . . 67
5.3.3 Correlation of IPC and Shared Memory Usage . . . 67
6 Conclusion 69
Chapter 1
Introduction
Moving resource management out of the operating system kernel has several advan-tages over an kernel solution. Application-controlled management of resources in-creases the flexibility of a system, by making room for domain-specific solutions and adaptations. Also, it enhances robustness and safety, since it reduces the privileged and mandatory part of the system. While user-level resource management is a promising approach for other resources, too, it is particularly interesting within the context of multiprocessor scheduling.
It is one of the core responsibilities of a multiprocessor operating system to allocate the available processors among the concurrent activities and programs. The decision how processor allocation should take place depends on a variety of system parameters – be it architectural properties, like the costs of inter-processor communication, be it workload characteristics, like processor service demands of applications, or be it user-specified classifications, like the desired priority of a particular activity. With the diver-sity of computer hardware, application workloads, and users’ expectations comes along a diversity of scheduling strategies and implementations. In fact, there exists a plethora of such approaches, suitable for different environments and circumstances [23]. With a scheduler subsystem that is integrated within the kernel and therefore hard to replace, a system will inherently be limited to a subset of policies, as it will be applicable only to specific environments. Making the scheduling logic extensible, by moving it out of the kernel, can therefore greatly enhance the system’s adaptiveness and tailorability to different environments. Moreover, keeping the scheduler in a deprivileged compo-nent ensures, that a faulty or malicious scheduler implementation is confined within a protection domain, and can not compromise the entire system.
However, such a modular scheduler architecture poses a new challenge on sys-tem design. Scheduling is principally based on information. While some of the de-ciding factors are more of static nature, like for example user-specified priorities, or static application characteristics, many of them accruedynamically, that is, at run time of the system. In contrast to static information, dynamic scheduling properties must be gathered and evaluated while the system runs. A subsystem running in privileged mode principally has access to all system and hardware data. Kernel-level schedulers can therefore easily obtain the information they require to perform their policies and decisions. However, for a scheduler running at user mode, with restricted access to protected data, accumulation and extraction of scheduling information becomes a very challenging task.
From the perspective of a user-level scheduler, the required information is dis-3
4 CHAPTER 1. INTRODUCTION
tributedamong different parts of the system. Sources for scheduler-relevant informa-tion may be the processor hardware, operating system components, or the applicainforma-tion workload. Moreover, the deprivileged scheduler does not necessarily have direct access to the required scheduling information, since this information resides in unaccessible hardware registers, or different protection domains. Furthermore, the characteristics arediverse, and plentiful; also, the scheduler may not require knowledge of all of them at the same time. For instance, while the cache-miss ratio reported by the processor can be a helpful information for an affinity-based scheduler [12], it may be completely useless for a different scheduling strategy such as co-scheduling [51]. Finally, some of the characteristics aredynamic, and may accumulate at a high rate; this is caused by changes in the application workload, and by other varying system behavior. Also, due to the timeliness of scheduling decisions, much of the accumulating information can become obsolete very quickly.
1.1 The Problem
There exist several approaches to support parallel scheduling in operating systems; however, either they fulfill only part of the requirements that arise from the nature of scheduling information, or they suffer from other limitations and inflexibilities. Pure kernel-based schedulershave the required scheduling information right at hand. How-ever, they usually offer only a limited set of scheduling policies [5,9,48,57]. Moreover, with a scheduler entangled with the rest of the kernel, even adjusting a scheduling pol-icy can become a complex and daunting task. Application-level schedulers, such as user-level thread libraries [3], offer the desired flexibility with respect to the policies; they are free to implement an arbitrary policy, and extending a current implementation is a rather easy task, with minimal implications on the rest of the system. Nevertheless, they are inherently inflexible with respect to theirscope, since they are bound to a spe-cific application domain. Also, application-level schedulers may exhibit poor perfor-mance, due to the lack of coordination between user- and kernel-specific semantics [4]. Two-level schedulersattempt to combine the advantages of pure kernel- or application-specific schedulers [4, 47, 62]. These approaches basically employ a kernel-and an application-level scheduler, and a means to propagate scheduling-relevant information and events in between. These approaches generally relieve the system from drawbacks the pure variants suffer from. However, either they provide propagation mechanisms that fail in cases of fluctuating or frequently accumulating scheduling characteristics, or they focus only on conveying scheduling data, but do little to address the problem of obtaining the data. Finally, alsoextensible kernelsoffer the opportunity to overcome the inflexibility of kernel-based schedulers. Extensible kernels allow applications to de-fine operating system functionality themselves, which is typically achieved by means of downloading application-specific code into the kernel [13, 22, 54]. Thus in princi-pal, extensible kernels combine the advantage of kernel-based schedulers, which have direct access to scheduling information with the advantage of user-based schedulers, which allow for application-specific policies. However, extensible kernels suffer from a variety of hard problems related to safety, and require sophisticated countermeasures to address these problems [20].
1.2. APPROACH 5
1.2 Approach
The weaknesses of current approaches have motivated us to introduce a new mech-anism which is more suitable to address the requirements of user-level schedulers in the face of distributed, diverse, and varying scheduling characteristics. In this work, we present a novel approach to support multiprocessor schedulers at user-level. We propose to usesystem instrumentationandevent logging, in order to obtain run-time information relevant for scheduling.
Inspired by the efficiency and flexibility of performance monitoring tools, we lever-age instrumentation techniques to enhance the system components with handlers that record scheduling-relevant data into designated log files held in main memory. By making sure that the instrumentation handlers are safe and well-defined, we retain ap-plicability of our approach even to crucial system components such as the operating system kernel, allowing thereby for a unified infrastructure for collecting scheduling data. The asynchronous nature of event-logging and its broadband interface render our approach an efficient solution even in cases of fluctuating or high-volume scheduling data. In addition to the basic logging mechanisms, we provide several concepts for flexible and efficient management of our logging infrastructure. Among these concepts are a method to dynamically enable and disable logging on a per-characteristic base, and an interface to dynamically specify the scheduling data emitted to the log files. We also introduce the new concept ofaccounting domains, which allows schedulers to account scheduling data to different entities in the system. Our log infrastructure is de-signed to permit efficient access to log buffers, both by schedulers and the instrumented component, and to scale well with the number of processors.
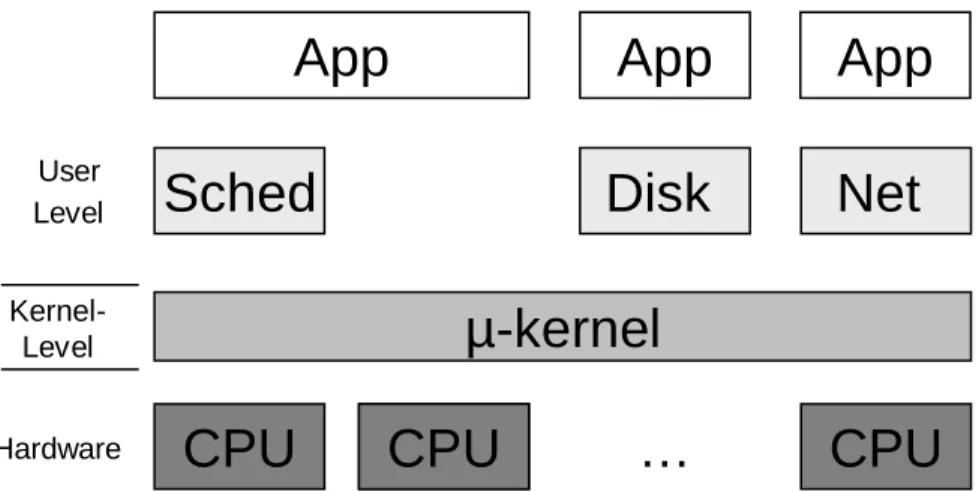
To evaluate accumulation of workload characteristics via logging, we have imple-mented a prototype logging facility within a real-world, microkernel-based, component operating system. Our environment is based on the L4 microkernel and the L4Ka Virtu-alization Environment. We have successfully instrumented the microkernel, the appli-cation workload, and a user-level device driver subsystem providing services to the ap-plications. From these components, we extract several run-time scheduling characteris-tics, including timing properties and inter-process communication (IPC) patterns from the microkernel, and shared-memory usage from a user-level device driver subsystem. Measurements indicate a rather undramatic baseline overhead, with zero overhead for disabled scheduling characteristics, and logging costs ranging between about 26 and 275 clock cycles on an Intel 2.2 GHz Xeon Processor. Application-level benchmarks on driver throughput indicate worst-case logging penalties of about 3.8 percent logging for IPC usage, and about 10.5 percent for logging shared memory usage. Throughput measurements were done in a scenario not bound to I/O processing, with a device driver operating on a RAM disk.
The rest of this thesis is structured as follows: Chapter 2 reviews background ma-terial and related work in the context of our approach. Chapter 3 will present and discuss the design concepts and ideas behind our system. It is followed by a detailed presentation of our prototypical implementation in Chapter 4, and an evaluation of our prototype in Chapter 5. Chapter 6 summarizes our approach and presents our conclu-sions.
Chapter 2
Related Work
The following chapter presents background material and related work in the context of our approach. The chapter is subdivided into three parts. In the first section, we review run-time characteristics commonly used within the context of multiprocessor schedul-ing. In the second section, we will discuss contemporary approaches to supporting job scheduling on multiprocessors. In the third section, we will present research done in the area of tracing and performance monitoring. Although having a different background and goal, our work coincides with such tracing and monitoring facilities in several key aspects.
2.1 Run-time characteristics used in Parallel
Schedul-ing
Following the taxonomy introduced in [17], the general scheduling function can be defined as a mechanism that allocates processing resources to consumers, based on a scheduling policy. We can consequently define multiprocessor scheduling as a mecha-nism that allocatesmultipleprocessing resources to consumers, based on a given policy. Scheduling principally relies on information. As the problem of allocating processors to consumers, most of the measures and characteristics relevant for multiprocessor scheduling are naturally related with the processors, or the consumers, or both. Fur-thermore, many scheduling characteristics are relevant on aÄper-consumer base, that is, they attribute the processor consumer with regard to upcoming scheduling decisions. Some of the deciding factors of scheduling are of static nature, such as predefined job classifications or priorities. However, a major part of the characteristicsaccrue dynam-ically, during run time of the system. Our work focusses on those run time characteris-tics; we have classified them into four major categories: (i) usage of the processor, (ii) usage of processor-associated resources, (iii) usage of shared resources, and (iv) sys-tem load indicators. In general, the first three categories cover the properties that are relevant on a per-consumer base; we therefore use termusageinstead of characteristic. To denote the consumers of the various resources, we will use the termresource prin-cipalshence. In contrast, system load indicators are typically global system properties, and at most they reflect resources that have been consumed by all principals, or by none. In the following, we will review relevant scheduling policies grouped by those four categories, and detail how the policies extract the required characteristics from the run-time system.
8 CHAPTER 2. RELATED WORK
2.1.1 Usage of the Processor
The processor is the central resource within the context of scheduling; consequently, many scheduling characteristics are related to the processor and its usage by the proces-sor principals. Perhaps the most evident example of a procesproces-sor-related characteristic is theservice timeof a principal, which is the time a principal has used a given processor. Since the service time correlates with its parallelism, timing characteristics can be con-sidered asparallelismcharacteristics as well. Traditional queuing models simply use the cumulative service time on all processors to characterize principals; however, re-search has shown that such a single-value parameter is an inadequate characterization, and has therefore proposed more elaborate timing parameters such as theprocessor working set, theexecution signature, or the parallelism profile[27, 55]. In addition to the actual service time, thecoefficient of variation of the service time can help to determine, if the service time is predictable at all [28]. Although timing characteristics are often assumed to be known a priori, there have also been efforts to measure them at run time [15, 28, 50]. Such measurements principally require instrumentation of the execution points where a unit of work has been completed, such as context-switches between kernel-, or user-level threads, or, at a coarser grain, start and stop times of whole jobs or activities.
More recent efforts investigate the applicability ofprocessor-internal characteris-tics to multiprocessor scheduling. For instance, the approach in [1] measures mean cycles-per-instruction per thread, with the goal improve scheduling on multi-threaded processors. Similarly, the approach in [29] proposes to measure the energy consump-tion of threads, in order to perform scheduling based on energy criteria. These ap-proaches usually obtain the required characteristics from hardware sensors and perfor-mance monitoring counters.
2.1.2 Usage of Processor-associated Resources
When a ready run processor principal is to be scheduled in a parallel system, it may be required or beneficial to map this principal to a specific processor. One factor that leads to the increased affinity is the usage of processor-associated resources. For in-stance, some resource may be available only on a specific processor, and the principal is forcibly bound run on these processors. Other resources may contain some “state” while being used, and principals that make use of them in a timely or spatially local manner improve their efficiency. Finally, resources may be used concurrently by mul-tiple principals; running together principals with high usage rates may have negative performance implications, due to contention and interference. Knowledge of usage patterns of processor-associated resources can therefore significantly improve the ef-fectiveness of parallel job scheduling.
Perhaps the most important example of a processor-associated resource is the pro-cessor’s caches. Cache affinity schedulingbasically attempts to reduce the amount of state that principals must reload into the caches after being (re-)scheduled on a proces-sor. [58]. Cache affinity scheduling can significantly improve performance if context switching rates are high [12, 61], or if the costs of reloading cache state are substantial, like on on machines with high memory latencies [18]. Several techniques are used to reduce the amount of cache state: one scheme is to re-schedule a principal on the pro-cessor it last used, since there may still be “hot” state in this propro-cessor’s cache from the last run. Another approach is to let a processor favor those principals, which have run on the processor in the near past [18]. The last scheme tries to reduce the cache
2.1. RUN-TIME CHARACTERISTICS USED IN PARALLEL SCHEDULING 9
interference by scheduling principals with a high mutual cache locality in consecutive order [11]. Cache affinity policies employ different schemes to measure the cache state of a processor principal: some approaches simply model the cache state based on the service time of the principal [9, 18]. Alternative approaches leverage hardware support to obtain the number of cache-misses per principals [12, 65], or equivalent information from the processor’s translation look-aside buffers [11].
Besides the cache state, also thememory requirementsof a principal play an im-portant role in scheduling. Scheduling policies make use of memory considerations in basically two ways: first, on machines with non-uniform accesses to memory, some approaches preferably run the principals on those processors or nodes, which host their memory working set; cache-misses are then being mainly serviced from local rather than from remote memory [18, 70]. Second, some approaches attempt to reduce mem-ory pressure, either by using memmem-ory-based admission controls [10], or by preferring principals in proportion to their memory requirements [52]. To obtain the memory allocations to principals at run-time, memory-conscious scheduling policies typically query the memory management subsystem, which is responsible for allocating memory pages to the principals.
2.1.3 Usage of Shared Resources
The idea of scheduling cooperating processor principals together is widely referred to asco-scheduling; it was initially proposed by Ousterhout [51]. Co-scheduling as-sumes that parallel programs have aprocess working set, which must be scheduled simultaneously for the program to make progress. A technique that is very similar to co-scheduling isgang scheduling; the subtle difference between those variants is that gang scheduling only schedules complete working sets, whereas co-scheduling re-sorts to a subset, in case that there are not enough processors available. Co-scheduling enhances the flexibility of scheduling, but breaks the performance guarantees gang-scheduling can give.
Ousterhout originally relied only on statically specified input by the application [51]. However, more recent approaches show, that run-time identification of process working sets is a possible and efficient alternative [25, 56, 65]. Run-Time identifica-tion is principally based on monitoring usage ofshared resources. Similar to usage of processor-associated resources, which increases the affinity to a processor, usage of shared resources increases the affinity of principals to each other. A scheduling policy that is aware of the interaction patterns between principals can use its knowledge and schedule cooperating principals together, in order minimize synchronization times and increase overall performance. In practice, different techniques exist to monitor usage of shared resources: the approach in [25] identifies processor working sets by instrument-ing communication channels. This approach requires that the channels are identifiable, which holds true, for instance, for named communication facilities, or synchronization locks. However, if communication is based on shared memory, the approach will fail, since this form of communication is more opaque and harder to detect. The approach in [56] monitors shared memory interaction indirectly, by periodically scanning the contents of the processor’s translation look-aside buffers. Finally, the approach in [65] proposes to obtain sharing patterns from hints, which are specified by the applications themselves.
10 CHAPTER 2. RELATED WORK
2.1.4 System Load Indicators
The last category of scheduling characteristics covers all properties used to measure the load of the system. In contrast to the characteristics that fall into the other categories, system load indicators are typically global system properties. At most they reflect resources that have been consumed by all principals, or by none. The current load situation is principally a run-time system property. It is taken into account in order to keep the fluctuating workloads balanced among the available processors. The most widely used load indicator is the length of the processor run-queues, as for instance used in [8] and [53]. But other single-value load descriptors are possible, such as system call or context switching rates, or processor idle times [39].
2.2 Approaches to Support Parallel Scheduling
In this section, we will review current approaches to support parallel job scheduling on multiprocessors. We begin with the two classical schemes used in operating systems, kernel-level and application-level scheduling, and show that those approaches are in-herently limited with respect to flexibility and scope. We then review several advanced approaches to supporting multiprocessor scheduling. Although these approaches pro-vide a more flexible for scheduling, they still suffer from efficiency and safety prob-lems.
2.2.1 Kernel-Level Schedulers
Virtually all modern multiprocessor operating systems, including UNIX- and Windows-based systems, export a notion of election context to the user – e.g, thread, process, or virtual machine. The operating system multiplexes execution contexts among the physical processors by means of a scheduling subsystem. The kernel-level scheduler subsystem deals both with collecting required scheduling data, and dispatching con-current context among the available processors, based on a given scheduler policy. The scheduler runs at privileged mode, and dispatches only visible, first-class execution contexts. Scheduling characteristics are cheap to accumulate, since hardware prop-erties and other kernel subsystems are directly accessible, without the need to cross protection boundaries.
However, kernel-controlled scheduling suffers from a number of problems and lim-itations. First, kernel schedulers often export execution contexts that are tied to other operating system abstractions, such as protection domains; this limits flexibility and may lead to high overhead for switching those contexts [3, 7]. Second, although most operating systems support more than one scheduling policy [5, 9, 48, 57], and some even accept scheduling hints from users [14], kernel schedulers are inherently limited with respect to the supported scheduling policies. Since the scheduler subsystem is embedded and entangled with the kernel, even adjusting an existing scheduling policy can become a complex and daunting task.
2.2.2 Application-Level Schedulers
The limitations of kernel schedulers have led to an emergence of user-level thread pack-ages as a new abstraction for supporting application parallelism. Such libraries multi-plex a set of user-controlled threads among a single, kernel-exported execution context.
2.2. APPROACHES TO SUPPORT PARALLEL SCHEDULING 11
An application-specific scheduler is responsible for dispatching user threads among the kernel context. Scheduler and threads reside within the same protection domain, and the required scheduling information is – as it is the case for kernel-level schedulers – right at hand. Aside from being faster as kernel threads [3], user-level threads greatly enhance flexibility of scheduling. Thread libraries are free to implement any desired policy, and extending current implementations does not have any side-effects on the rest of the system. However, these benefits come at a cost. First, thread packages may exhibit poor performance, since the underlying kernel-level scheduler is oblivi-ous to the application-specific notion of threads [4]. Second, although thread packages provide the required flexibility with respect to the policy, they are still inherently in-flexible in theirscope. Thread packages are bound to a specific protection domain, thus cannot be used as a foundation for development of a scheduler that manages multiple applications or protection domains.
2.2.3 Two-Level Schedulers
Since neither kernel-threads nor user-threads are fully satisfying concepts, research has investigated, how the benefits of both solutions could be combined within a single approach to express and manage parallelism. Such combinations are widely referred to as two-level schedulers. In the following, we review three such approaches: Process control, Scheduler Activations, and First-Class User Level Threads.
Process Control
The idea of process control is based on the observation that performance degrades when the total number of processes exceeds the number of available processors. Pro-cess control is a mechanism that allows parallel applications to dynamically adapt the number of execution contexts, in order to achieve a one-to-one mapping from exe-cution contexts to real processors [62]. For this purpose, process control employs a centralized scheduler, which periodically polls the kernel for the number of runnable processes; in case the number does not match the number of processors, it requests applications to suspend some of their processes. For safety reasons, the applications must suspend and resume their respective processes themselves. In contrast to pure user-level threads, process control allows for scheduling of multiple applications and protection domains. Also, it does not suffer from the limited extensibility kernel-level schedulers are subject to. However, it introduces a number of disadvantages. First, polling is an efficient approach to promote scheduling characteristicsonlyif the fre-quency of alterations is sufficiently constant; process control is thus limited to policies that do not require characteristics accruing with varying frequencies. Second, process control relies on cooperative behavior of the applications, since there is no means to provide the scheduler with scheduling information required to determine if a process can be suspended safely.
Scheduler Activations
The concept of scheduler activations is driven by the insight, that kernel-threads are the wrong base for user-level thread packages. For this reason, scheduler activations are introduced, as a new foundation to user-level management of parallelism [4]. In this approach, a kernel scheduler allocates complete processors to address spaces, rather than only processes; it hands over the dispatching of threads to a user-level scheduling
12 CHAPTER 2. RELATED WORK
system, by reflecting all relevant scheduling events (e.g., the blocking of a user-thread within the kernel), to the user-level scheduler. This is achieved by means of a notifica-tion mechanism, which is dubbed scheduler activanotifica-tion. The activated user-level sched-uler can then respond to the change according to its own requirements. Like process control, scheduler activations overcome the limitations of both application-specific and kernel-specific execution contexts. However, propagating scheduling information via synchronous upcalls suffers from similar problems as the polling mechanism used in process control. Scheduler activations are inherently limited to events with a compara-tively low frequency. Since a scheduler activation requires the switching to user-mode, notification incurs heavy performance costs, if the frequency of events is high. Also, there exist scheduler-relevant events (e.g., cache-misses) that do not require invocation of the scheduler the instant they take place, rather, it is sufficient torecordthe particular event for future use by the scheduler.
First-Class User-Level Threads
First class user-level threads is an approach similar to the two previous ones in that it attempts to bring user-level and kernel-level abstractions closer together. The approach grants user-level threads a first-class status: the kernel remains in charge of coarse-grain thread management, while thread packages implement the fine-grain functionality that does not require involvement of the kernel [47]. Like with scheduler activations, the kernel notifies the thread packages on pending scheduling decisions, by means of a software interrupt. In addition, kernel and thread packages convey important thread-related data via shared memory, that is, without the requirement for synchronous in-teraction. Thus, first class user-level threads are generally capable of communicating scheduling-related information between user and kernel. However, their approach fo-cusses on exchanging data, and only on exchange between kernel and user; it does little to address the problem how dataaccumulationcan be done efficiently. Also, there is no support for data propagationbetweenuser-level components.
2.2.4 Extensible Kernels
Extensible kernels attempt to overcome the inefficiency and inflexibility of poorly matching operating system services and interfaces. The basic approach is to let ap-plications define the functionality constituting the operating system themselves, by allowing them to download application-specific code into the kernel. Research on ex-tensible kernels has proposed several ways to manage job scheduling at user level. SPIN lets applications provide their own thread packages and scheduler, executed as safe extension within the kernel [13]. Exokernel relies on a user-specified interrupt handler for general purpose context-switching [22]. The approach in [19] further in-vestigates multiprocessing on Exokernel; however, this approach implements only a basic multiprocessor scheduler, and lacks support for more sophisticated than a basic load-balancing algorithm. Thus, in theory, extensible kernels overcome the existing limits of multiprocessor scheduling with respect to flexibility and extensibility. Allow-ing for user-defined specializations of an operatAllow-ing system, they can accommodate the different demands of scheduling policies, including the demands of distributed, diverse, and dynamic scheduling characteristics. However, aside from lacking evidence with re-spect to multiprocessor scheduling, extensible operating systems suffer from a variety of hard problems related to safety. To prevent downloading compromising or mali-cious code into the kernel, such systems require sophisticated countermeasures such as
2.3. TRACING AND PERFORMANCE MONITORING TOOLS 13
run-time safety-checks, or language restrictions to a Turing-incomplete subset [20].
2.3 Tracing and Performance Monitoring Tools
Understanding the behavior of an operating system is a challenging task, and tracing infrastructures can provide valuable aid in debugging, analyzing or tuning operating systems. Examples of such infrastructures are the Digital Continuous Profiling Infras-tructure of DEC [2], the tracing infrasInfras-tructure in K42 [66], DTrace of Sun Microsys-tems, [16], or the Linux Trace Toolkit [68].
These infrastructures feature many techniques and mechanisms that are applicable to our approach as well, such as dynamic instrumentation [59] or lock-less event log-ging [66]. However, tracing facilities differ in two key aspects, which prevented us from directly incorporating such a tool to solve the problems of accumulating schedul-ing data. The first main difference lies in data lifetime. Tracschedul-ing data is often preserved for a long time (e.g., in a disk database [2]), for later analysis by humans or graphical tools. Since this may take place off-line, tracing data can generally become very large in size. In contrast, scheduling characteristics serve as a means to predict the future on-line, based on the near past. Due to the frequency of scheduling decisions, the collected samples usually become stale very quickly. Also, preserving the samples in a database is not generally required. The second key aspect is that the debugging and tracing tools trade off the three criterions efficiency, flexibility, and safety in a way that we deemed unacceptable for our purpose: DEC’s Digital Continuous Profiling infrastructure al-lows for efficient profiling, but is restricted to a fixed set of trace events. K42’s tracing infrastructure also allows for efficient data accumulation, but was not specifically de-signed with safety in mind. Sun’s DTrace features the ability to dynamically specify trace events and handlers at run-time; designed for a production environment, DTrace also assures that the execution of event handlers is absolutely safe. However, it does so by executing probe handlers in a safe environment, and thus suffers from the same complexity problems as other extensible kernels. Finally, the Linux Trace Toolkit only focusses for kernel tracing, and provides no support for application-specific tracing.
2.4 Summary
To summarize, run-time characteristics relevant job scheduling fall into four major cat-egories: (i) usage of the processor, (ii) usage of processor-associated resources, (iii) usage of shared resources, and (iv) system load indicators. All these characteristics arise from different sources in the system, and most of them are relevant only for spe-cific scheduling policies or environments. Some of them are slow-paced, but others are highly fluctuating parameters and accumulate very frequently. Previous approaches to support parallel either suffer from deficiencies with respect to scheduling information, or they are overly limited in other respects:
• Pure kernel- or application-level approaches offer limited flexibility and extensi-bility, supporting either only a fixed set of policies, or restricting the scope to a single application or protection domain.
• Process control and scheduler activations achieve the desired flexibility and ex-tensibility, but may exhibit poor performance in cases where scheduler-relevant properties change very frequently. First-Class User-Level threads overcome the
14 CHAPTER 2. RELATED WORK
efficiency problems of scheduler activations and process control, but are focused on interaction between the kernel and user-level components, and do little to convey scheduling events between the user components.
• Extensible kernels theoretically meet the demands of scheduling characteristics with respect to flexibility and efficiency, but introduce safety and security related problems.
Finally, while tracing and performance monitoring tools provide many features and concepts that are applicable to the context of scheduling as well, they are not directly usable for that purpose; specifically the different trade-offs with respect to efficiency, flexibility, and safety renders a one to one adoption a questionable approach.
Chapter 3
Design
In this chapter, we will present the design of our approach to support user-level schedul-ing via instrumentation and event-loggschedul-ing. We first point out a set of requirements and goals that should apply to our solution. In the subsequent sections, we will present our proposed approach, and then detail how it achieves the desired requirements and goals.
3.1 Requirements and Goals
We begin by defining the requirements and goals the design of our approach should reflect. In particular, we want our solution to be:
• Flexible, and unified. If the scheduling subsystem is not limited to a set of poli-cies – such as non-extensible kernel schedulers –, or to a specific application – such as user-level thread packages –, the scheduling data is inherently diverse, and distributed among the whole system. A valid solution must therefore be suit-able for different components, not just for specific subsystems or applications. • Applicable to the kernel. As a major source for scheduling-relevant
informa-tion, the approach must be apt also for use within the most privileged and critical part of the operating system. However, we cannot permit arbitrary extensions of kernel code or interfaces, since they compromise the whole system’s safety [20]. • Efficient. To meet the demands of real-world environments and dynamic work-loads, the solution must accommodate the inherent fluctuations in scheduling characteristics and the resulting abundance of scheduling data. Obtaining, gath-ering, and delivering scheduling information needs to be cheap, and fast. Solu-tions based on synchronous notification [4], or on polling [62], will fail in the cases where changes in scheduling-relevant characteristics occur too frequently. • Scalable. Naturally, support for multiprocessor scheduling must scale with the number of processors. In this work, we focus on shared-memory multiprocessors with uniform or non-uniform access to memory.
3.2 Proposed Scheme
This work presents a novel approach to support multiprocessor scheduler extensions at user-level. We propose to use system instrumentation and event logging to obtain
16 CHAPTER 3. DESIGN
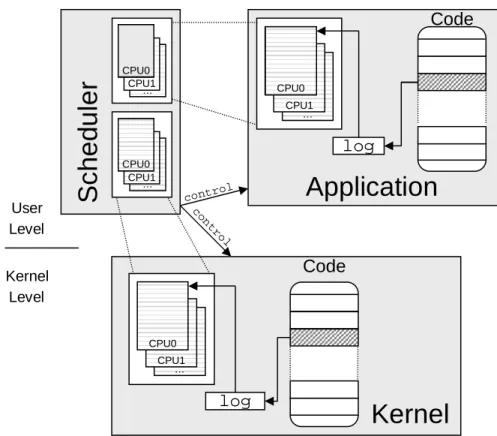
run-time information relevant for scheduling from different system components and to store this information within designated log files. To deliver the accumulated schedul-ing information, we share the log files with the user-level scheduler application. The scheduler can finally analyze the shared log files to base its allocation policies on. Our approach is illustrated by Figure 3.1. There are several concepts and aspects to our solution:
Efficient and safe logging and instrumentation. By making sure that the log han-dlers are cheap and small, we achieve that the data can be accumulated and de-livered very efficiently. We further reduce the overhead by allowing the scheduler extension to dynamically enable and disable instrumentation on a per-character-istic base. However, for safety reasons, we deploy only well-known and prede-fined instrumentation code, to retain the applicability of our approach even to safety-critical environments such as the kernel.
Flexible log control and data specification. To allow for flexible data accumulation, we provide an interface that allows schedulers to specify and control the data flow through the log infrastructure. However, rather than to allow the specifi-cation of arbitrary log contents and layouts, the interface only offers to choose from a predefined set of possibilities. Limiting the degree of freedom not only retains good performance while still being flexible enough within the context of scheduling; it also enables us to provide a safe and well-known interface to the scheduler which never results in undefined behavior.
Flexible log data accounting. The diversity of scheduling policies often comes along with inherent ambiguities in the definition of schedulable or accountable enti-ties. To comprise all different types and granularities of entities that may exist throughout the system, we introduce the new notion of anaccounting domain. For the logging infrastructure, an accounting domain is merely a pool of resource principals, and a set of dedicated log buffers that can be used to record schedul-ing information in. The management of associations between resource principals and accounting domains is exported to the scheduler application. This concept not only enhances flexibility, by handing over the policy-associated definition of accounted entities to the scheduler. It also serves as a performance improvement, since pooling principals into a domain implies, that interactionswithinthe pool are not relevant for the scheduler, and can be filtered out by the logging facility.
Efficient log data aggregation. The log infrastructure provides several mechanisms to aggregate and reduce the log data. Schedulers can configure and use these mechanisms to aggregate the volume of accumulated data depending on their own demands and requirements. We provide the mechanisms not only only to meet performance requirements; aggregation techniques also make our facility more flexible, since they allow the data flow to be adjusted to reveal specific questions.
Efficient and Scalable Log Data Access. Rather than to incorporate copy-out or double-buffering techniques, we share the log buffers directly with the user-level sched-uler. Log buffers can be analyzed the instant the scheduler requires knowledge of the information. Using lock-free synchronization between the log data producers and consumers, we further make sure that data can be accumulated efficiently, without requiring costly inter-processor synchronization operations. For reasons
3.3. LOGGING AND INSTRUMENTATION 17
of scalability, log data is recorded in per-processor buffers; producers of log data on different processors operate completely independent from each other.
Application
… CPU1 CPU0log
contro lCode
Kernel
… CPU1 CPU0log
Code
CPU0 … CPU1 CPU0 CPU0 … CPU1 CPU0 CPU0 User Level Kernel LevelS
c
h
e
d
u
le
r
co nt ro lFigure 3.1: Design overview. The log infrastructure can instrument the kernel and user-level modules or applications. At the respective instrumentation points, schedul-ing characteristics are logged in per-processor log buffers. The log buffers are shared with the scheduler application, which bases its decisions on accumulated information. Additionally, the facility exports a control interface to the scheduler, which allows for flexible log control.
In the remainder of this chapter, we will discuss the previous aspects in more de-tail. We will first discuss the concepts behind logging and instrumentation (Section 3.3). We afterwards discuss issues related to log control and data specification (Section 3.4), and to the accounting of log data (Section 3.5). We continue by describing the data aggregation mechanisms (Section 3.6). In the final section, we discuss issues and considerations related to log data access (Section 3.7).
3.3 Logging and Instrumentation
In this section, we discuss the basic concepts that a logging and instrumentation fa-cility suitable for scheduling-relevant information should implement. In general, these concepts must meet two main design requirements: efficiency and safety. More specifi-cally, while logging must be efficient enough that the costs of accumulating scheduling
18 CHAPTER 3. DESIGN
data do not outweigh its benefits, it still must be safe enough to be applicable also to the privileged operating systems kernel.
Hollinwgsworth et al. describe instrumentation as: “the activity of collecting in-formation about an execution without modifying the intent of the underlying calcula-tion” [35]. This is basically accomplished by enhancing the system with probe handlers or event hooks, that calculate and record the requested information. Using instrumenta-tion for the purpose ofloggingconsequently means to define a set of appropriate instru-mentation events, and to enhance these events with alog mechanism. This mechanism is activated whenever control flow reaches the instrumentation events, and records the occurrence of the event – together with other useful information – into a designated log file. Instrumentation and event-logging are commonly used technique in the context of debugging, profiling, and performance monitoring [16, 46, 49, 59, 66]. In contrast, we propose to use instrumentation to collectscheduling-relatedinformation from the diverse system components. However, although the mechanisms are principally the same, we must consider the special requirements when using instrumentation to accu-mulate scheduling data: first, due to the timing constraints of scheduling-relevant data, instrumentation should be as efficient as possible. Second, since we want to apply this technique to the kernel as well, instrumentation must not have any implications on the system’s safety.
Many performance analysis and debugging tools allow users (e.g., programmers, compilers, or applications) to define themselves the actions that should be taken when-ever an instrumentation point is reached. This is typically achieved by means of a description language. The description language constitutes a dynamic interface that is used for translating user-specified semantics into machine code. The code is then in-jected into the instrumented component sometimes at compile-time [46], but preferably at run-time [16,35]. Further, many of the dynamic instrumentation systems are capable of instrumenting almost any kernel and user-level code [16,35,59]. Dynamic interfaces and instrumentation greatly enhance the flexibility of these tracing tools, allowing for instance the definition of arbitrary actions at run-time and code injection into unmod-ifiable components and modules. Dynamic instrumentation techniques also improve efficiency, since they allow for enabling and disabling the functionality at run-time. However, these features come at a cost. While dynamic extensions and interfaces may be well-suited and unproblematic for user programs, applying these techniques to the operating system kernel – at least at arbitrary locations, or with arbitrary application-provided code –, can clearly jeopardize the whole system safety. To overcome the problems, these techniques must incorporate sophisticated countermeasures like run-time safety-checks, or language restrictions to a Turing-incomplete subset [16, 35]. Particularly for small or safety-critical system components, with a concise and well-defined interface (e.g., microkernels, or virtual machine hypervisors), neither complex safety-checks, nor mutating kernel interfaces are a tolerable solution.
To retain some of the flexibility and efficiency of such dynamic techniques, but to ensure on the other hand, that instrumentation and control is safe even within the kernel, our approach makes a compromise between dynamic and static techniques. It is based on the insight that, although scheduling characteristics are inherently diverse and distributed, they still show structural and semantical similarities. This basically allows us to use only predefined instrumentation events and handlers. By offering the ability to dynamically enable instrumentation on a per-characteristic base, we meet our safety goals, but still leave enough room for flexible and efficient customization of the logging infrastructure. In the following paragraphs, we discuss our approach in more detail. We first define several types of events that are appropriate for recording scheduling-relevant
3.3. LOGGING AND INSTRUMENTATION 19
characteristics. We then discuss the issues related with the instrumentation of these log events.
3.3.1 Log Events
Although scheduling information is inherently diverse, and distributed among different system components, the characteristics still show structural and semantical similari-ties. This mainly stems from the fact that scheduling is a processor allocation problem, which results in a focus of the characteristics on processors and processor-related re-sources. As discussed previously, run-time scheduling characteristics generally fall into four different categories: usage of the processor, of processor-associated, or of shared resources, and, finally, system load indicators. In light of these categories, we have identified three types of events that are appropriate for logging scheduling-relevant workload characteristics: (i) events where a characteristic changes or a resource is ac-cessed, (ii) events where a principal enters or exits a phase ofcontinuousaccess to a resource, and (iii) asynchronous, unrelated events. The following paragraphs elaborate on these three types of events in more detail.
On-Change/On-Access Events
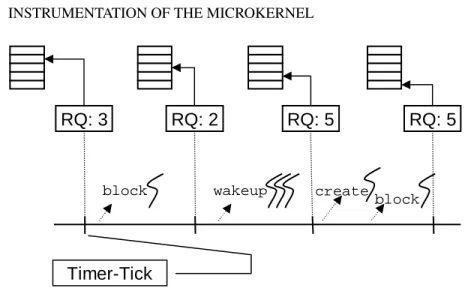
On-change and on-access events are the most intuitive type of a scheduler-relevant event. They simply denote an event, where a certain property changes, or resource ac-cess takes place. An example of such an event is the acac-cess to a shared software object by a principal. Another example would be the insertion of threads into a processor’s run-queue.
Not all on-change or on-access events can be instrumented in practice. Only visi-ble software events, represented by a code path, can be enhanced with an appropriate code construct. This may not be the case with properties maintained by hardware, or with properties hidden in unmodifiable or closed, binary-only components. Further-more, such events can only be instrumented efficiently, if changes or accesses occur not too frequently. Otherwise, instrumentation of every access will incur unacceptable overhead.
On-Entry/On-Exit Events
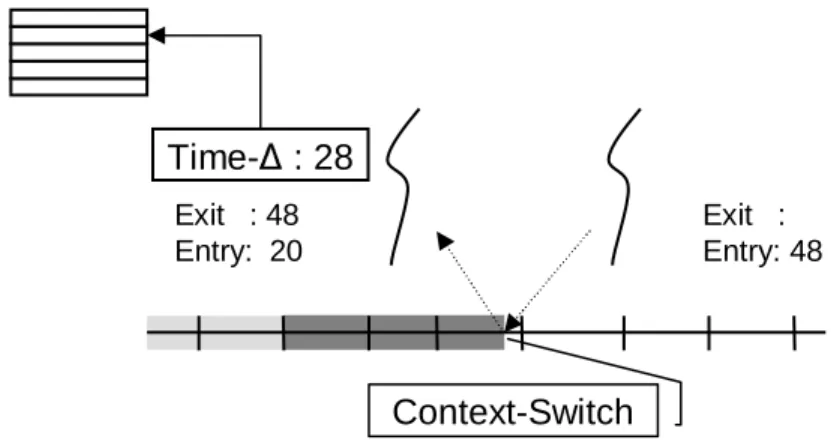
Extracting scheduling-relevant characteristics on access or on change is a simple, but often not applicable scheme. However, for resource usage by principals, which forms a major part of the scheduling-relevant characteristics, one can sometimes use a different set of events instead: based on the assumption, that usage of a resource is exclusive to one principal for a certain time, one can instrument the entry and the exit of such a phase of resource access. We refer to such a pair of events ason-entryandon-exit events. The alteration in the resource usage can afterwards be charged to the respective principal, without the requirement of tracking each single access. Alternatively, if the resource access is known to be continuous, the time difference can be used to approximate the actual alteration.
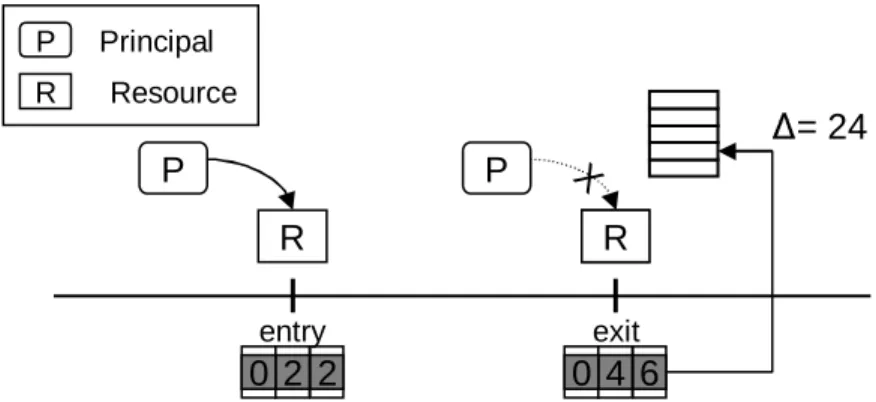
An example where such a scheme can be applied is the usage of a processor by a thread. The difference in the number of cycles – or alternatively, in time – between a thread’s dispatching and preemption event yields the actual processor usage count of the thread (See Figure 3.2). Another practical application for this scheme would be a client-server model, with communication based on shared resources. To track
20 CHAPTER 3. DESIGN
the “usage” of the server by client principals, one can instrument the event where a client calls the server for service, and the event where the server completes this service request. The communication intensity, counted for instance in the number of calls to communication routines, or in the number of references to shared memory pages, is afterwards charged to the client principal.
2
2
0
0
4
6
P
R
P
R
X
entry exitR
∆
= 24
P Principal Resource RFigure 3.2: Entry/Exit event type. Based on the assumption, that usage of a resource is exclusive to one principal for a certain time, one can instrument the entry and the exit of such a phase of resource accesses, and charge the alteration to the respective principal.
Asynchronous Events
Both previous event types, on-change/on-access, and on-entry/on-exit events, are syn-chronous to the actual change of the respective characteristic. The third class of events covers all asynchronous events, which are unrelated to the actual alteration. Com-monly used unrelated events are periodically invoked software functions, such as the timer interrupt handler. Alternatively to periodic events, also random events can be instrumented, to provide a set of samples of a certain scheduling characteristic.
Recording a characteristic by instrumenting unrelated events assumes that the in-formation has already accrued somewhere in the system. Furthermore, instrumenting unrelated events may not result in a complete record of characteristics, since alter-ations between the events will not emerge into the record. However, it is more efficient in cases, where a less detailed record of scheduling characteristics provides enough information to the scheduler, and a synchronous instrumentation is thus not justified.
3.3.2 Component Instrumentation
To measure and extract the desired scheduling characteristics, our infrastructure in-serts instrumentation handlers at the respective log events. By designating different instrumentation points for different scheduling characteristics, we can ensure that ac-cumulation and logging is always performed in the same way at each point. We are therefore able to only insert well-defined instrumentation handlers. Each handler is basically a small log mechanism, that accumulates the desired data and writes it out into an assigned log file. Using only instrumentation code that is known at compile-time not only ensures safety of the instrumentation process; it also allows us to give
3.4. LOG CONTROL AND DATA SPECIFICATION 21
performance guarantees on the whole logging process, by using only time-bound in-strumentation code.
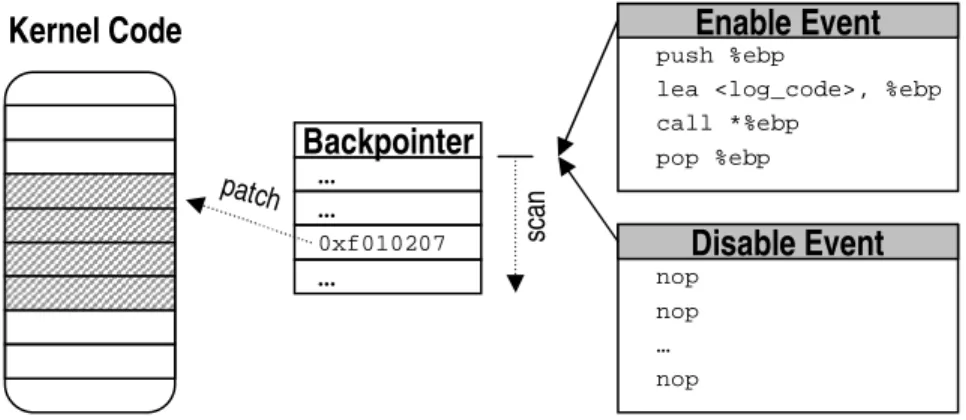
However, the diversity of scheduling characteristics, and the fact that an actual scheduling policy may require only a small subset of the accruing characteristics, has convinced us that accumulation of all possible scheduling data at the same time is clearly an inefficient and intolerable solution. We therefore make use ofdynamic in-strumentation techniques, and allow schedulers to enable and disable logging at run-time. More concrete, all logging code enhancements are removed by default. Upon re-quest by the scheduler, we enable the logging of a given characteristic, by dynamically inserting the respective code enhancement into the instrumentation points correspond-ing to the characteristic. Uscorrespond-ing dynamic code insertion permits us to enable loggcorrespond-ing only for those characteristics that are really required by the scheduler. It also elimi-nates the performance penalties of disabled-probe checks that would otherwise burden the original code path.
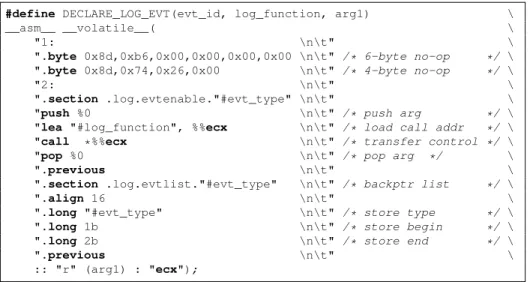
Inserting code fragments at arbitrary locations requires mechanisms such as tram-polines [35], or splices [59], to safely patch the respective location, and to relocate and later execute the overwritten original instructions. In contrast, the limitation to a set of well-known instrumentation points allows us to use a much simpler approach: we prepare all log events with a sequence of place holders (e.g.,no-opinstructions), that make room for later use by the instrumentation. Upon request, we simply insert the re-spective log code enhancement into the space previously reserved by the place holders. For further details on dynamic instrumentation, we refer to our implementation, which is presented in Chapter 4.
3.4 Log Control and Data Specification
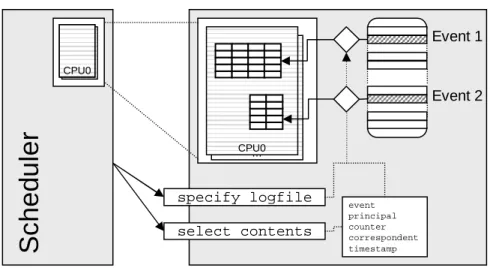
Our approach intentionally limits the control flow induced by instrumentation, for safety and efficiency reasons. All inserted handlers consist of predefined code frag-ments known at compile time. Using dynamic instrumentation, logging can still be enabled and disabled during run time. We use a similar scheme for the data flow, that is, the generated log data produced by the logging code enhancements. The similarities in the semantics of scheduling data enable us to again limit the degree of freedom to a set of predefined log layouts and contents, still providing however a flexible enough mechanism for managing the log data flow. The scheme is illustrated by Figure 3.3, and works as follows: Each logging component exports a well-defined interface, which al-lows schedulers to route scheduling data from different characteristics toseparatelog files. Further, this interface allows schedulers to choose thecontentsof each desig-nated log file, by selecting for each a subset of the following predefined log entries: (i) event identifier, (ii) resource principal identifier, (iii) counter, (iv) correspondent prin-cipal identifier, and (v) time stamp. In the following, we describe each of the possible entries in more detail.
Event Identifier. If more than one scheduling characteristic is logged in the same log file, the event identifier is used to distinguish data from different sources. Event identifiers are nottrueidentifiers in the sense that they uniquely denote the event. Rather, they uniquely denote the scheduling characteristic the event corresponds to. That is, in the case of on-entry/on-exit events, both events will map to the same identifier.
22 CHAPTER 3. DESIGN … CPU0 … CPU0 CPU0
S
c
h
e
d
u
le
r
Event 1 Event 2 specify logfile select contents event principal counter correspondent timestampFigure 3.3: Flexible but safe log control using separate log buffers and predefined log entries.
Resource Principal Identifier. If an event reflects the usage of or access to a schedu-ling-relevant resource, the principal entry is used to record the particular resource principal. Such a principal may for instance be an address-space that allocates a memory page, or a thread that causes a miss in the processor cache. Similar to the event identifiers, the principal identifiers do not uniquely denote the resource principal, but rather map to the principal’saccounting domain(See Section 3.5 for details on log data accounting).
Counter. This variable stores the actual alteration, or access counter associated with the particular event. If the event is of type on-access or on-change, the counter is hardwired to 1. Otherwise, in case of on-entry/on-exit-events, the counter is used to log the “delta” of resource accesses at the exit event. For asynchronous events, the counter value reflects the current state of the particular scheduling characteristic, such as the length of the run-queue, or the number of memory allocations to a principal.
Correspondent Principal Identifier. Access to shared resources is captured by ging the correspondent principal at each resource access. For instance, when log-ging access to a communication facility, the correspondent entry holds the com-munication partner of the current principal. For resources shared among multi-ple principals (e.g., broadcast or multicast communication), each correspondent must be logged separately, using a new log entry row.
Time stamp. The time stamp stores the current time at which logging has taken place. Logging the current time is useful, for instance, to identify data that has already become obsolete at the time the scheduler makes its decision. Depending on the instrumented component and the underlying hardware, we offer the selection of different types, such the hardware time stamp counter reporting the number of clock cycles since boot, or a logical time stamp counter, which is merely a variable that is incremented after being read. Of course, alternative sources are also possible, such as the real-time or BIOS clock.
3.5. LOG DATA ACCOUNTING 23
There are several benefits to offering only a set of fixed but selectable log layouts: first, it enables us to provide a clean and safe control interface to the scheduler appli-cation that can be as simple as a set of flags determining if a specific log entry should be written or not. Second, we can assume that log entry sizes are fixed, by requiring the scheduler to configure the interface appropriately. Constant log entry sizes allow for both simpler and more efficient logging and reading out, as the starting point of a log entry is always known [66]. Third, and last, we can incorporate a set of in-place aggregation mechanisms, since we can assume well-known semantics of log entries (Details on log data aggregation are presented in Section 3.6).
While some of the log entries are implicitly available at the time a log operation is performed, others must be explicitly accumulated by the log mechanism. The step of accumulation is dependent on the particular workload characteristic. Data maintained by hardware is typically read out using a special processor instruction. Software prop-erties such as the run-queue length require data structures to be parsed, or interfaces to be queried. In most cases, the information is either internal to the instrumented com-ponent, or can be obtained via an existing interface. However, a special case occurs, if only the log event is internal to a component, but the information is located at a differ-ent place, and no query interface exists that could be used obtain it from there. As an example, pageusageis often monitored in a software-managed data structure located in the kernel (e.g., in a page table). However, detailed knowledge on pagesharingis usually available within the memory subsystem, which may not necessarily be incor-porated within the kernel [6, 34]. We propose to use recursive logging in this case, that is, to collect the scheduling information in a preliminary log file before promot-ing the complete set to the scheduler. In the example above, the memory subsystem and the kernel can share a log file, which the kernel uses to report page usage in. The memory subsystem can search the log file for accesses to shared pages, and afterwards propagate the complete information to the scheduler.
3.5 Log Data Accounting
Resource usage forms a major part of the scheduling-relevant characteristics. If not measured for load estimation, where cumulative resource demands or idle capacities are relevant as well, the usage must be charged to some accountable entity. The re-source consumption is evaluated by schedulers when allocating processors to the enti-ties (or, more precisely, to theschedulable objectsthese entities consist of). Commonly used notions of such accountable entities are threads for processor-related resources, or address-spaces for memory resources. But accounting can just as well be based on coarser-grain, or compound entities, such as applications or computer users.
In general, our logging infrastructure already allows for accounting of resource us-age: whenever a resource is accessed, the log mechanism can record the respective resource principal in the designated log entry. A scheduler that later analyzes the log file is thus able to trace back each resource access to its originating principal. How-ever, we still must address the problem, how the resource principals should relate to the entitiesaccountedfor the consumption. One solution would be to introduce a static mapping between resource principals and accounted entities. This is done in many general-purpose operating systems, where accounting is usually based solely on pro-tection domains (i.e., processes). However, previous research has shown that such a coincidence poses substantial constraints on resource management [7]. Moreover, with regard to scheduling information, stipulating the notion of accounted entities does not
24 CHAPTER 3. DESIGN
only have implications on flexibility, but also on efficiency: Consider for example a client-server based system with many thousands of threads and a high context-switch rate. In this case, using threads as the base for accounting will significantly decrease performance, since context-switches must be instrumented in order to monitor the per-thread usage of the processor. Moreover, if the scheduler is actually aware of which threads belong to which accountable entity (e.g., job, application, or user), such a fine-grain accounting not only affects performance, but also generates unnecessarily de-tailed log data.
To address this problem, we introduce a new abstraction that can be used for flexible accounting of resource usage. Our approach is driven by two insights: first, there is no unique set of resource principals in a system. Rather, this notion varies among the components and modules the system consists of. While the kernel may only provide base abstractions, like threads, or address-spaces, higher-level components may operate on a completely different level, dealing with programs, or computer users. Second, it should be the responsibility of the scheduler subsystem, not of the components, to define the entities that accounting of scheduling data is based upon. We therefore introduce the new concept ofaccounting domains, as a notion of an accounted entity. For the log mechanism itself, an accounting domain is merely an association between a resource principal and identifier emitted to the log files. The task ofestablishingthese associations is exported to the scheduler extensions, which allows them to freely define the accounted entities their policies are based upon. The accounting domain concept is illustrated by Figure 3.4; we will discuss this concept in more detail in the next two paragraphs.
3.5.1 Accounting Domains and Logging
On request by the scheduler, the log mechanism logs an identifier of the principal orig-inating the access to a given resource. The particular principal is tied to the resource, but also depends on the component the resource access takes place. For instance, al-though threads are the basic abstraction for consumers of processor time, instrumenting a high-level OS component such as a program loader may yield processor time based on a completely different abstraction – in this case, based on programs.
Accounting domains introduce a level of indirection between the actual principal, and the identifier recorded in the log files. The additional indirection level allows for dynamic associations between resource principals, and the accounted entities reported to the scheduler. Defining the original principal is left to the instrumented component; the accounting domain concept only provides a mechanism tomapeach principal to its corresponding accounting domain. The logging procedure uses this mapping to resolve a principal’s accounting domain, and then uses the domain identifier as the principal’s identifier in the log file. Likewise, when logging access to shared resources, it records the correspondent principal’s domain identifier in the respective entry. Since the resolving procedure heavily depends on the particular component and resource, we leave its semantics open to the implementation. Details on how it can be realized for different environments will be presented in the implementation (Chapter 4).
3.5.2 Accounting Domain Management
Accounting domains decouple the original principal from the accounted entity the re-source access is charged to in the log files. Since rere-source usage is accounted for
3.5. LOG DATA ACCOUNTING 25 … CPU0 … CPU0 CPU0
S
c
h
e
d
u
le
r
map to domainPrincipal
Domain
Figure 3.4: The accounting domain concept. Schedulers can define associations be-tween resource principals and accounting domains. When logging resource usage, the log mechanism maps the originating principal to its corresponding accounting domain.
scheduling purposes, we hand over the task of defining the associations between princi-pals and domains to the scheduler application. Each instrumented component provides a management interface that allows schedulers to dynamically bind a resource principal to an accounting domain. The log mechanism then charges all resources consumed by this principal to its accounting domain. Conversely, an accounting domain is implicitly charged for all resources consumed by its associated principals.
Based on their own knowledge of the activities in the system, schedulers can use the accounting domain concept to customize how the logging infrastructure accounts resource consumption. Similar to the concept of resource containers [7], the accounting domain concept allows schedulers to associate scheduling information with activities or users, rather than with a single resource principal. However, the accounting domain concept assumes that the scheduler is aware of the original notions of resource prin-cipals that exist in the instrumented components. For prinprin-cipals that are internal to a specific component, or for virtualized principals (such as virtual threads [21]), this may require additional mechanisms to establish an agreement on principals between the scheduler and the instrumented components. Further, while we allow schedulers to dynamically create and change the bindings between domains and principals, we do not provide a mechanism to modify the domain bindings within the components. Fu-ture work has to be done to investigate if such a model of “migrating principals” might be useful in the context of our work.
Until now, we have discussed the concept of accounting domains only with regard to the flexibility they add to our infrastructure. However, we introduced this concept also for a second reason: to enhance the efficiency of the system. As a pool of resource principals the scheduler considers to be “equal”, an accounting domain also enables us to group data that belongs together, or to sort out domain-internal data that is irrelevant for scheduling. These and other techniques will be presented in the following section on log data aggregation.