Address for correspondence:Niko Papanikolaou, PhD, Cancer Therapy & Research Center,
University of Texas Health Science Center at San Antonio, 7979 Wurzbach Rd, San Antonio, TX 78229, USA, phone: +1 210-450-5664, e-mail: [email protected]
Evaluation of the effect of prostate volume change
on tumor control probability in LDR brachytherapy
Courtney Knaup, BS
1, Panayiotis Mavroidis, PhD
2, Sotirios Stathakis, PhD
1, Mark Smith, MS
1, Gregory Swanson, MD
1,
Niko Papanikolaou, PhD
11Cancer Therapy & Research Center, University of Texas Health Science Center at San Antonio, USA, 2Department of Medical Radiation Physics, Karolinska Institutet & Stockholm University, Stockholm, Sweden
Abstract
Purpose:This study evaluates low dose-rate brachytherapy (LDR) prostate plans to determine the biological effect of dose degradation due to prostate volume changes.
Material and methods:In this study, 39 patients were evaluated. Pre-implant prostate volume was determined using ultrasound. These images were used with the treatment planning system (Nucletron Spot Pro 3.1®) to create
treat-ment plans using 103Pd seeds. Following the implant, patients were imaged using CT for post-implant dosimetry. From
the pre and post-implant DVHs, the biologically equivalent dose and the tumor control probability (TCP) were deter-mined using the biologically effective uniform dose. The model used RBE = 1.75 and α/β= 2 Gy.
Results: The prostate volume changed between pre and post implant image sets ranged from –8% to 110%. TCP and the mean dose were reduced up to 21% and 56%, respectively. TCP is observed to decrease as the mean dose decreas-es to the prostate. The post-implant tumor dose was generally observed to decrease, compared to the planned dose. A critical uniform dose of 130 Gy was established. Below this dose, TCP begins to fall-off. It was also determined that patients with a small prostates were more likely to suffer TCP decrease.
Conclusions:The biological effect of post operative prostate growth due to operative trauma in LDR was evaluat-ed using the concept. The post-implant dose was lower than the plannevaluat-ed dose due to an increase of prostate volume post-implant. A critical uniform dose of 130 Gy was determined, below which TCP begun to decline.
J Contemp Brachyther 2011; 3, 3: 125-130 DOI: 10.5114/jcb.2011.24818 Key words:brachytherapy, LDR, prostate cancer, radiation biology.
Received: 22.07.11 Accepted: 20.09.11 Published: 30.09.11
Purpose
Prostate cancer is one of the most common cancers in men, and was responsible for 32 000 deaths in the United States in 2010 [1]. Low dose-rate (LDR) brachytherapy is a common radiation therapy treatment used in the man-agement of prostate cancer. Unfortunately, during the treat-ment significant prostate swelling occurs [2, 3]. The prob-lem of post-implant prostate edema, which can alter the distribution of radioactive seeds, represents a major obstacle to accurately determine treatment effectiveness. The two most common radioactive seeds used in prostate LDR brachytherapy are 125I and 103Pd. 103Pd is preferred in the
treatment of more aggressive, rapidly proliferating tumors, because its short 17 day half-life ensures that the therapeutic dose is delivered quickly [4, 5]. 103Pd decays by electron
cap-ture and emission of 21 keV gamma rays. This characte-ristic offers the benefit of reducing unwanted dose outside the treatment volume, but increases the need for precise seed implantation to avoid hot or cold spots. The recommend-ed prescription dose for LDR monotherapy is 115-125 Gy
for 103Pd [6, 7]. An important question that appears is
whether the observed dose degradation is associated with a respective reduction in treatment effectiveness. The ef-fectiveness of a treatment can be assessed by many differ-ent criteria. However, dosimetric quantities used in most studies offer only an indirect relation to the clinical outcome. In this work, radiobiological evaluation is used to bridge the gap between dosimetric results and the clinical impact. Such an analysis provides more accurate picture of treat-ment effectiveness since the dose-response measures have been derived from real clinical data and directly reflect on the final treatment outcome.
In this work, a linear quadratic (LQ) calculation of bio-logical effective dose (BED) was utilized. Such a model was used in a wide range of clinical situations [8-11]. Analysis of each treatment was based on the dose-volume histogram (DVH). DVH was applied instead of the 3-dimensional dose distribution based on the fact that most of the existing ra-diobiological models do not use spatial information. How-ever, utilizing spatial-dose information in treatment evalu-ation seems to be an interesting area for a future research [12].
Material and methods
This study is a retrospective analysis of twenty-seven LDR brachytherapy patients treated with 120 Gy monother-apy. Pre-implant and post-implant prostate volumes were determined using the B-K Medical Leopard 2001 (Mileparken, Denmark®) transrectal ultrasound (TRUS) in
the patients in the lithotomy position. TRUS images were acquired during a continuous sagittal sweep. From the vol-umetric data acquisition, axial images were reconstructed with 2.5 mm spacing. Details of the implants are shown in Table 1, as an average data for each patient group. On the axial TRUS images, the prostate was contoured by a physi-cian. The planning target volume (PTV) was defined to be the prostate volume plus a 0.5 cm margin. The treatment plan was produced using the Nucletron Spot Pro 3.1 soft-ware (Nucletron AX Veenendaal, the Netherlands®). The
seeds were accurately implanted under TRUS guidance to ensure their placement in the proper locations. All the pa-tients were treated with 103Pd seeds (Theragenics, Theraseed
model 200, Buford, GA®).
At the same day as the implantation, every patient re-ceived a CT scan. The recommendation given in TG-64 is to perform a post-operative scan 2 weeks after the implant. However, it is recognized that many practical considerations prevent such timing [13]. Based on a lack of consensus re-garding the ideal follow-up scan time, the American Brachytherapy Society considers the most practical scan time to be within 24 hours of the implant [14]. As we can notice from our clinical experience at our facility, many patients do not return for a follow-up CT. In order to avoid such sit-uation, our radiation oncology department decided to ob-tain a follow-up CT at day 0. The half-life of prostate ede-ma ranged from 4-25 days, with a mean of 9.3 days [15, 16]. Therefore it is important to remember that an immediate post-implant scan will tend to underestimate the prostate coverage compared to a scan at a later time [14]. Thus, the analysis presented here represents a worst-case scenario. Pa-tients were scanned in the supine position and transverse slices were acquired with 2.5 mm slice thickness. On these CT images, the prostate was contoured by two physicians to assure the accurate delineation. The contoured CT im-ages were then used for post-implant dosimetry. The lo-cation of each implanted seed was determined from the set of CT images and the final dose distribution was established using the same activity as at the time of implant. The meas-ured prostate volumes from both the pre-implant and post-implant TRUS and post-post-implant CT image sets were then obtained. Based on the pre-implant prostate volumes, the patients were divided into three groups of approximately equal size, and were classified as small, medium and large. From the pre and post-implant DVHs, the biologically ef-fective uniform dose (D=) and the TCP were determined [17].
The value of the TCP was in part based on calculation of the biologically effective dose (BED), which was calculated us-ing equation 1 [8, 9, 18].
Ro
BEDtum= Deff
{
RBE +[
(µtum + λ) (α/βtum)
]
× × A ×× (B–C)}
+ + Kλ ln(
RK o)
[1] where 1 A = 1 – e–λTeff 1 – e–2λTeff B = 2 λ 1 – e–Teff (µtum + λ) C = µ tum+ λIn equation 1, R0is the initial dose rate and λis the
de-cay constant (for103Pd, λ= 0.04079 day-1). Authors have
re-ported α/β ratios in the range 1.5-4 Gy, with recent find-ing in the lower end of this range [19-22]. Here, a reasonable middle value of 2 Gy was used [23]. The sublethal damage repair constant (µtum) was calculated using the following
ex-pression:
ln(2)
µtum= T
1/2 [2]
This factor accounts for the decrease in tumor kill as the tumor cell repairs damage. Here, a general repair half-life of 15 minutes was assumed, making µtum = 2.8 hour-1
[24, 25].
The tumor repopulation factor (K) accounts for the growth of new tumor cells during treatment and was cal-culated as follows:
ln(2)
K = αT
pot [3]
A potential doubling time (Tpot) of 42 days was used in
this analysis resulting in a repopulation factor Kof 0.11 Gy x day-1[25].
Equation 4 was used for the calculation of the effective dose (Deff). The physical dose (D) was taken from the
re-spective DVH. The effective treatment time (Teff) was
de-termined from equation 5. The treatment time in LDR brachytherapy was difficult to determine since the dose-rate
M
Meeaann ddoossee RReellaattiivvee vvaarriiaannccee MiinMniimmuumm ddoossee MMaaxxiimmuumm ddoossee
((GGyy)) ((%%)) ((GGyy)) ((GGyy))
Planned 268 2.7 177 325
Delivered 232 7.2 139 330
T
slowly decays to background levels, rather than simply ter-minating. The endpoint for brachytherapy has been defined as the point where the rate of cell kill was equal to the tu-mor repopulation factor [24].
Deff= D (1 – e–λTeff) [4]
1 ln
(
K)
Teff= – λ R
o×RBE [5]
The relative biological effectiveness (RBE) for 103Pd has
been reported to be between 1.6-1.9 [26, 27]. For this study a middle value of RBE= 1.75 was used. Based on an α= 0.11 Gy-1, the values D50= 50 Gy and γ= 4 were applied [28]. D50was the dose, which provided a 50% response and γwas
the maximum normalized dose-response gradient. The D50
and γparameters were derived from clinical materials and described the shape of the dose-response curve [29]. These parameters and the radiobiological model used were sim-ilar to those recommended in TG-137 [30]. Biological pa-rameters were the subject to some uncertainty due to intra-patient radiosensitivity variations [31-34]. Tumor control probability (TCP) was then determined using equation 6 [35-37].
TCP =
Π
i = 1N(
exp (–exp(exp(1) × γ – α × BEDtumi )))
∆vi [6]In this equation, Nis the number of dose-volume bins in the DVH of the tumor and ∆viis the corresponding
frac-tional normalized volume.
The biologically effective uniform dose (D=) calculates the uniform dose that would provide the same clinical outcome as the inhomogeneous dose distribution. It is a function of physical dose and tissue specific radiobiological parame-ters. The general expression of (D=) is derived numerically from the first part of the following equation, where for a tis-sue of uniform radiosensitivity, (D=) is given from the ana-lytical formula of the second part of equation 7.
eγ – ln (– ln (P(D–)))
P (D→)≡ P (D=)⇒D= = eγ – ln (ln 2) [7]
where D→denotes the 3-dimensional dose distribution de-livered to the tissue and P(D–) is the response probability of the tissue. The second part of the equation has been derived using the Poisson model [17]. It has been demonstrated in the literature that dose distributions to the tumor, which are characterized by large inhomogeneities (and consequent-ly cold spots) are better associated with the minimum dose. Dose distributions to the tumor, which are characterized by small inhomogeneities are better associated with the mean dose. However, neither the mean nor the minimum doses are directly associated with the TCP value as is the (D=) which made it the quantity of preference for this type of study. The tumor TCP is calculated by multiplying the local tumor re-sponse probabilities of every tumor voxel (or dose-volume bin). So, there is a different BED value in every voxel (or dose-volume bin) meaning that there is a distribution of BED
values within the tumor. On the other hand, the (D=) value stems from the TCP value and it is a single value for the whole tumor. In this sense, (D=) is a better descriptor of the dose delivered to the tumor in respect to treatment outcome.
Results
The mean physical doses for the implants were found to be significantly higher than the prescription doses. This dif-ference is due to inhomogeneities in the implant that broaden out the treatment DVH at higher delivered doses and increasing the mean dose. Also, the relative variance was greater in the post-implant plans. This was also due to the prostate swelling and the result of seed movements.
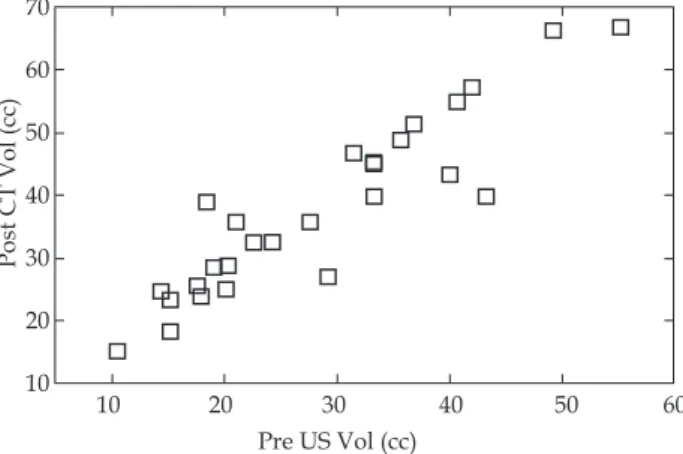
Not surprisingly, the pre-implant and post-implant prostate volumes were closely related (Fig. 1). Also as ex-pected, most of the prostate volumes increased the post-im-plant. The small prostates were seen to increase the most, whereas the large prostates had the smallest increase.
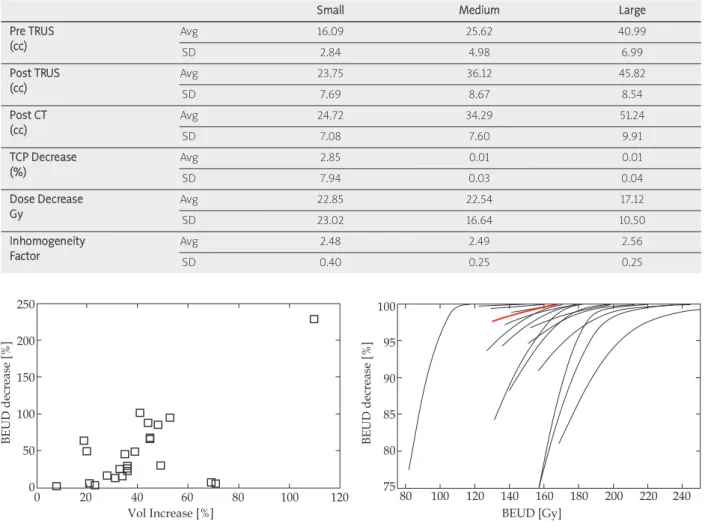
The small, medium and large prostate groups grew on average by 48%, 41% and 12%, respectively. These volume changes were similar to the range of 33% to 96% reported by Waterman et al. [15], and were determined from the pre-implant and post-pre-implant TRUS volumes. Similarly, the post-implant mean dose decreased, most in the small prostates and least in the large prostates. The mean dose de-crease for the small, medium and large groups was 22.9, 22.5 and 17.2 Gy, respectively (Table 2). Since LDR brachyther-apy implants typically have large dose inhomogeneities, Table 2 also includes an inhomogeneity factor. The inho-mogeneity factor was calculated as the quotient of D20to the
prescription dose.
The TCP did not follow this pattern; it was not greatly reduced. The pattern among prostate sizes was similar. This indicates that for most patients, even with a decrease in the delivered dose, the implant still maintained a good thera-peutic result. As expected, the delivered dose distributions determined by post-implant dosimetry, were different and generally of lower levels than the planned dose dis-tributions. The radiobiological calculations of (D=) and TCP for the patients indicated that uniform prostate dos-es of around 130 Gy rdos-esulted in nearly 100% tumor control, below that dose the TCP started to fall-off.
Fig. 1. Shows the relationship between pre- and post-implant prostate sizes
10 20 30 40 50 60 Pre US Vol (cc) 70 60 50 40 30 20 10 Po st C T Vo l ( cc )
Figure 2 shows the relationship between the percentage of prostate volume growth to the percentage of BEUD (D=) change. The change in D=was observed to increase, as the prostate volume change increases. This was consistent with our hypothesis. For the patients that were located in the sat-uration part of the dose-response curve, eventual changes in the prostate volume would not have an impact on the cor-responding TCP values and consequently on the D=value. TCP decrease as a function of relative prostate volume in-crease shows that in general the prostates that had the largest relative increase also suffered from a greater TCP reduction, but for most patients there was a little change in TCP.
For the biological parameters used in this analysis, there were a range of reported values, as discussed above. Also, it was known that these parameters were variable from pa-tient to papa-tient and even among different parts of the same organ. For these reasons, a sensitivity analysis was per-formed in order to know how the use of different param-eters would affect the calculated TCP. For each of the twen-ty-seven patients, twenty-six additional combinations of the following parameters were used: α/β = 2, 3, 4 Gy, γ= 2, 3, 4 and D50= 30, 50, 70 Gy. The results of the sensitivity
analysis are shown in Fig. 3.
It is clear that the choice of parameters had a significant effect on the calculated TCP. The combination with the high-est TCP for low BEUD were those where D50was low and
α/βand γwere high. For many of these combinations, the patients TCP never dropped much, as it could be seen by several overlapping line at TCP = 100%. The combinations for which TCP was low at high BEUD were those where D50
was high and α/βand γwere low. The combination used in the above analysis was seen to demonstrate intermedi-ate TCP at moderintermedi-ate BEUD, compared with other param-eter combinations.
Discussion
The degree of prostate growth was observed to be in-versely related to the initial prostate size. This was expected, because a small prostate had a more space to grow, while a large prostate was more confined by surrounding struc-tures [38]. Small prostates had the greatest dose deteriora-tion, whereas the large prostates had the least. This is con-sistent with our hypothesis. One would expect that the more the prostate swells, the greater the displacement of seeds. Since the 103Pd seeds emits short range 21 keV gamma rays, S
Smmaallll MMeeddiiuumm LLaarrggee
P Prree TTRRUUSS Avg 16.09 25.62 40.99 ((cccc)) SD 2.84 4.98 6.99 P Poosstt TTRRUUSS Avg 23.75 36.12 45.82 ((cccc)) SD 7.69 8.67 8.54 P Poosstt CCTT Avg 24.72 34.29 51.24 ((cccc)) SD 7.08 7.60 9.91 T
TCCPP DDeeccrreeaassee Avg 2.85 0.01 0.01
((%%)) SD 7.94 0.03 0.04
D
Doossee DDeeccrreeaassee Avg 22.85 22.54 17.12
G
Gyy SD 23.02 16.64 10.50
IInnhhoommooggeenneeiittyy Avg 2.48 2.49 2.56
FFaaccttoorr SD 0.40 0.25 0.25
T
Taabbllee 22.. Volume, TCP and mean dose statistics for three prostate volume groups
Fig. 2. Percentage of volume change compared to percen-tage of BEUD change for 120 Gy patient group
BE U D d ec re as e [% ] 0 20 40 60 80 100 120 Vol Increase [%] 250 200 150 100 50 0
Fig. 3. Results of the sensitivity analysis
80 100 120 140 160 180 200 220 240 BEUD [Gy] BE U D d ec re as e [% ] 100 95 90 85 80 75
LDR brachytherapy is very sensitive to seed movements as these movements can easily cause large hot or cold-spots.
Although, the mean dose was observed to decrease for the medium and large prostates, the change in TCP was significant. The results of the radiobiological analysis in-dicated that there was wide variability in the degree to which mean dose and TCP were diminished as the prostate swells. Based on the results of this study, patients with small prostates with volumes between 10.5-19 cc, could expect a volume increase of 48%, a physical dose decrease of 23 Gy, and a tumor control probability decrease of 3%. Patients with medium prostates with volumes between 20-33 cc, could ex-pect a volume increase of 41%, a physical dose decrease of 22.5 Gy, and no reduction in tumor control probability. Pa-tients with large prostates with volumes between 33.5-61 cc, could expect a volume increase of 12%, a physical dose de-crease of 17 Gy, and no reduction in tumor control proba-bility. The TCP for most of the patients in the study remained high, even though the mean dose was reduced. This result could be explained from the fact that the planned dose was large enough, that a modest decrease still resulted in a satisfactory mean dose to the tumor. The results of this experiment indicate that a (D=) in the neighborhood of 130 Gy provided very good tumor control. Below 130 Gy, the tumor control probability was seen to decrease. Above 130 Gy, the tumor control probability was unchanged while the probability of normal tissue complication had elevated.
In this kind of analysis it was important to use clinical-ly derived parameter values, as it was done in this study. In the past, such an analysis would have been carried out using the BED concept. However, by performing our analysis based on the TCP values, our findings were directly associated with the treatment outcome, which was the type of information that was registered clinically and was the pri-mary objective of the treatment.
Based on the dose-coverage quantifier D90≥ 100%, all
im-plants were determined to be satisfactory. The mean tumor control predicted for the patient post-plans was 97%. Fol-low-up data from the cohort showed that none of the pa-tients have had recurrent disease, indicating that the cal-culated control rates were consistent with the actual patient outcomes. Potters et al.reported 48 month PSA relapse-free survival of 93.3% for implant with D90≥ 90% [39]. The
in-crease in survival reported in our findings compared to those of Potters et al. was likely due to the higher D90doses for
our patient cohort. Blasko et al.reported 94% biochemical disease-free progression for low-risk patients, similar to those in this study [40]. Again, this finding was slightly lower than that reported here. However, their plans were deemed ac-ceptable when D80≥ 115 Gy, slightly lower than the
crite-rion used here. While the tumor control rates reported in this study were high, they were consistent with clinical fol-low-up data. Additionally, the control rates were reason-able compared to those reported by others for implants with slightly lower dose levels.
The current results from the study of comparing pre-im-plant and post-impre-im-plant dose distributions embraced the vari-ations mainly from both factors: 1) the volume changes be-tween the ‘pre-implant TRUS’ and ‘implant day’, and 2) the needle-implant process variations over the pre-implant treat-ment plan. However, no significant tumor volume changes
were found between the ‘pre-implant TRUS’ and ‘implant day’ (especially compared to the volume changes that were introduced due to edema). It would be very easy to apply the pre-implant treatment plan and transfer the new tumor volume delineation from an implant-day CT scan, in order to determine solely the impact of tumor volume change. However, it was not clinically realistic since the needle-implant process variations over the pre-needle-implant treat-ment plan would always be present in a real situation and the impact of tumor volume changes on treatment outcome should be investigated in a simultaneous context.
The observations of this study and the limited size of the patient cohort indicate that there was plenty of room for dose distribution optimization by avoiding unnecessary over-dosage of the tumor while sparing the involved normal tis-sues in a more effective manner [21]. This would be achieved by performing a true radiobiological treatment plan optimization, where the expected response probabilities of the prostate and OARs would be calculated for different seed configurations and dose level ranges. The treatment plans were produced based on the PTV, which partly accounted for the swelling of prostate (GTV) after seed implantation. Consequently, the TCP values did not decrease as much as one would expect.
Conclusions
The purpose of this study was to determine whether the observed prostate edema and post-implant dose reduction may result in a reduction in tumor control. The degree of prostate growth was seen to be inversely related to the ini-tial prostate size. Similarly, the degree of post-implant dose reduction was determined to be greatest for small prostates and least for initially large prostates. Despite this modest dose reduction, the tumor control probability was not seen to decrease significantly. Post-implant uniform maximum doses near 130 Gy provided very high tumor control probabilities; below this dose the TCP diminished.
Acknowledgment
This work was supported by Cancer Center Support Grant (P30CA054174).
References
1. Prostate Cancer Overview 2010 [cited 2010 12/06]; Available from: http://www.cancer.org/Cancer/ProstateCancer/Over -viewGuide/prostate-cancer-overview-key-statistics. 2. Wang JZ, Mayr NA, Nag S et al. Effect of edema, relative
bio-logical effectiveness, and dose heterogeneity on prostate brachytherapy. Med Phys 2006; 4: 1025-1032.
3. Dogan N, Mohideen N, Glasgow GP et al. Effect of prostatic edema on CT-based postimplant dosimetry. Int J Radiat Oncol Biol Phys 2002; 2: 483-489.
4. Ling CC. Permanent implants using Au-198, Pd-103 and I-125: radiobiological considerations based on the linear quadratic model. Int J Radiat Oncol Biol Phys1992; 1: 81-87.
5. Nag S, Scaperoth DD, Badalament R et al. Transperineal pal-ladium 103 prostate brachytherapy: analysis of morbidity and seed migration. Urology1995; 1: 87-92.
6. Nag S, Beyer D, Friedland J et al. American Brachytherapy Society (ABS) recommendations for transperineal permanent brachytherapy of prostate cancer. Int J Radiat Oncol Biol Phys
7. Beyer D, Nath R, Butler W et al. American brachytherapy soci-ety recommendations for clinical implementation of NIST-1999 standards for (103)palladium brachytherapy. The clinical research committee of the American Brachytherapy Society.
Int J Radiat Oncol Biol Phys2000; 2: 273-275.
8. Dale RG. Radiobiological assessment of permanent implants using tumour repopulation factors in the linear-quadratic mod-el.BJR 1989; 735: 241-244.
9. Dale RG. The application of the linear-quadratic dose-effect equation to fractionated and protracted radiotherapy. BJR1985; 690: 515-528.
10. Jones B, Dale RG, Gaya AM. Linear quadratic modeling of increased late normal-tissue effects in special clinical situations.
Int J Radiat Oncol Biol Phys 2006; 3: 948-953.
11. Zaider M, Hanin L. Biologically-equivalent dose and long-term survival time in radiation treatments. Phys Med Biol 2007; 20: 6355-6362.
12. Kim Y, Tome WA. Risk-adaptive optimization: selective boost-ing of high-risk tumor subvolumes. Int J Radiat Oncol Biol Phys
2006; 5: 1528-1542.
13. Yu Y, Anderson LL, Li Z et al. Permanent prostate seed implant brachytherapy: report of the American Association of Physi-cists in Medicine Task Group No. 64. Med Phys1999; 10: 2054-2076.
14. Nag S, Bice W, DeWyngaert K et al. The American Brachyther-apy Society recommendations for permanent prostate brachytherapy postimplant dosimetric analysis. Int J Radiat Oncol Biol Phys 2000; 1: 221-230.
15. Waterman FM, Yue N, Corn BW et al. Edema associated with I-125 or Pd-103 prostate brachytherapy and its impact on post-implant dosimetry: an analysis based on serial CT acquisition.
Int J Radiat Oncol Biol Phys1998; 5: 1069-1077.
16. Crook J, McLean M, Yeung I et al. MRI-CT fusion to assess postbrachytherapy prostate volume and the effects of pro-longed edema on dosimetry following transperineal intersti-tial permanent prostate brachytherapy. Brachytherapy 2004; 2: 55-60.
17. Mavroidis P, Lind BK, Brahme A. Biologically effective uni-form dose (D) for specification, report and comparison of dose response relations and treatment plans.Phys Med Biol2001; 10: 2607-2630.
18. Millar WT. Application of the linear-quadratic model with incomplete repair to radionuclide directed therapy.BJR1991; 759: 242-251.
19. Fowler J, Chappell R, Ritter M. Is alpha/beta for prostate tumors really low?Int J Radiat Oncol Biol Phys 2001; 4: 1021-1031.
20. King CR, Fowler JF. A simple analytic derivation suggests that prostate cancer alpha/beta ratio is low.Int J Radiat Oncol Biol Phys2001; 1: 213-214.
21. Wang JZ, Guerrero M, Li XA. How low is the alpha/beta ratio for prostate cancer? Int J Radiat Oncol Biol Phys2003; 1: 194-203. 22. Brenner DJ. Hypofractionation for prostate cancer radiother-apy – what are the issues? Int J Radiat Oncol Biol Phys2003; 4: 912-914.
23. Carlson DJ, Stewart RD, Li XA et al. Comparison of in vitro and in vivo alpha/beta ratios for prostate cancer. Phys Med Biol
2004; 19: 4477-4491.
24. Antipas V, Dale RG, Coles IP. A theoretical investigation into the role of tumour radiosensitivity, clonogen repopulation, tumour shrinkage and radionuclide RBE in permanent brachytherapy implants of 125I and 103Pd. Phys Med Biol 2001; 10: 2557-2569.
25. Armpilia CI, Dale RG, Coles IP et al. The determination of radiobiologically optimized half-lives for radionuclides used in permanent brachytherapy implants. Int J Radiat Oncol Biol Phys 2003; 2: 378-385.
26. Wuu CS, Zaider M. A calculation of the relative biological effectiveness of 125I and 103Pd brachytherapy sources using
the concept of proximity function. Med Phys 1998; 11: 2186-2189.
27. Ling CC, Li WX, Anderson LL. The relative biological effec-tiveness of I-125 and Pd-103.Int J Radiat Oncol Biol Phys1995; 2: 373-378.
28. Nahum AE, Movsas B, Horwitz EM et al. Incorporating clini-cal measurements of hypoxia into tumor loclini-cal control model-ing of prostate cancer: implications for the alpha/beta ratio.
Int J Radiat Oncol Biol Phys2003; 2: 391-401.
29. Kallman P, Agren A, Brahme A. Tumour and normal tissue responses to fractionated non-uniform dose delivery. Int J Ra-diat Oncol Biol Phys1992; 2: 249-262.
30. Nath R, Bice WS, Butler WM et al. AAPM recommendations on dose prescription and reporting methods for permanent interstitial brachytherapy for prostate cancer: report of Task Group 137. Med Phys2009; 11: 5310-5322.
31. Mavroidis P, Ferreira BC, Shi C et al. Treatment plan compar-ison between helical tomotherapy and MLC-based IMRT using radiobiological measures. Phys Med Biol 2007; 13: 3817-3836. 32. Ferreira BC, Mavroidis P, Adamus-Gorka M et al. The impact
of different dose-response parameters on biologically opti-mized IMRT in breast cancer. Phys Med Biol2008; 10: 2733-2752. 33. Mavroidis P, Laurell G, Kraepelien T et al. Determination and clinical verification of dose-response parameters for esophageal stricture from head and neck radiotherapy. Acta Oncol 2003; 8: 865-881.
34. Mavroidis P, al-Abany M, Helgason AR et al. Dose-response relations for anal sphincter regarding fecal leakage and blood or phlegm in stools after radiotherapy for prostate cancer. Radiobiological study of 65 consecutive patients. Strahlenther Onkol2005; 5: 293-306.
35. Strigari L, Orlandini LC, Andriani I et al. A mathematical approach for evaluating the influence of dose heterogeneity on TCP for prostate cancer brachytherapy treatment. Phys Med Biol2008; 18: 5045-5059.
36. Li XA, Wang JZ, Stewart RD et al. Dose escalation in perma-nent brachytherapy for prostate cancer: dosimetric and bio-logical considerations. Phys Med Biol2003; 17: 2753-2765. 37. Haworth A, Ebert M, Waterhouse D et al. Assessment of i-125
prostate implants by tumor bioeffect. Int J Radiat Oncol Biol Phys 2004; 5: 1405-1413.
38. Badiozamani KR, Wallner K, Sutlief S et al. Anticipating pro-static volume changes due to prostate brachytherapy. Radiat Oncol Invest 1999; 6: 360-364.
39. Potters L, Cao Y, Calugaru E et al. A comprehensive review of CT-based dosimetry parameters and biochemical control in patients treated with permanent prostate brachytherapy. Int J Radiat Oncol Biol Phys2001; 3: 605-614.
40. Blasko JC, Grimm PD, Sylvester JE et al. Palladium-103 brachytherapy for prostate carcinoma. Int J Radiat Oncol Biol Phys hysics 2000; 4: 839-850.