Modeling of Channel Availability
Amine Amich
Submitted for the degree of Doctor of Philosophy
University of Surrey
Centre for Communication Systems Research Faculty of Engineering and Physical Sciences
University of Surrey
Guildford, Surrey GU2 7XH, U.K.
November 2014
c
Cognitive radio systems have been suggested as a method to improve spectrum utilization by detecting and accessing vacant spectrum. In such a network, sub-bands of a spectrum are shared by licensed (primary) and unlicensed (secondary) users in that preferential order. It is generally recognized that the spectral occupancy by primary users exhibit dynamical spatial and temporal properties and hence the fundamental issue is to char-acterize the sub-band spectrum occupancy in terms of probabilities. Given statistical analysis of the frequency band of interest are available, it has been shown that adaptive searching for white spaces could improve by 70% when compared to random searching. In the open literature, there exist no accurate/efficient time-varying model representing the spectrum occupancy that the wireless researchers could employ for evaluating new algorithms and techniques designed for dynamic spectrum access (DSA). Therefore, the objective is to propose an accurate and efficient analytic model that can be used to en-hance the sensing operations.
Using real-time measurements conducted in different geographic locations, existing re-search has validated that subchannel availability is suitably modeled as independent but non identical (i.n.i.d.) Bernoulli variables characterized bypi, the probability of
availabil-ity of theithsubchannel. The magnitude of pi’s could be extracted from sensed
measure-ments or a geolocation database. Based on the i.n.i.d. paradigm, we develop a predictive model by probabilistically computing the distribution of the number of available subchan-nels over a wide-band at a given time. However, the combinatorial complexity behind the exact distribution computation alludes the need for accurate and efficient alternative approaches that can support frequency bands with a large number of non-overlapping subchannels. We propose 3 different techniques based on convolution, recursive, and hy-brid convolution-recursive methods to resolve this complexity. We assess their efficiency by analyzing each algorithm’s time complexity and further compare their performance against existing models in the literature.
Moreover, knowing the availability of the channel’s immediate neighbors can allow ef-ficient power management as well as prioritize channels allocation to secondary users. Therefore, we categorize available channels into three different types based on the
oc-has to be evaluated against the probability of detecting these channels within the same i.n.i.d. framework. Respectively, we propose a novel approach to calculate the probability of detecting multi-channels simultaneously. Finally, we validate the effectiveness of the proposed models using several real-time measurements and further present 2 associated applications where one features novel 2-Dimensional (time, freq) availability prediction.
Key words: Cognitive Radio, Energy Efficiency, Modeling Techniques, Modeling Algo-rithms, Spectrum Modeling
This section is dedicated to everyone who has helped in making my PhD program a suc-cessful journey. First and foremost, I thank ALLAH (swt) for giving me strength, ability, and patience to complete this study. Secondly, I would like to give my sincere gratitude to my supervisors, Dr Muhammad Ali Imran and Prof Rahim Tafazolli, for believing in me, offering me the opportunity, and providing me with useful directions and feedback towards improving my research work.
My most tender and sincere thanks go to my loving family for their support and en-couragement in every aspect of my life. Without their love and care, I would not have been able to complete this degree.
Special thanks to all my friends and colleagues: Duale Mahdi, Turki Alkemaie, Muham-mad Al-Imari, Basil Elmasri, Juan Awad, Parisa Cheraghi, Talal Alsedairy, Ghassan Ainwaimi, and Oluwakayode Onireti who made the whole three years enjoyable.
1 Introduction 1
1.1 Objectives and Motivation . . . 2
1.2 Fundamental Assumptions . . . 3
1.3 Thesis Structure and Outline . . . 5
1.4 Overview of Contributions . . . 6
1.5 Publications . . . 7
2 State-of-the-art Spectrum Modeling 8 2.1 Spectrum Sensing Techniques . . . 8
2.1.1 Narrow-Band Spectrum Sensing . . . 9
2.1.2 Exploiting Energy Difference . . . 10
2.1.3 Exploiting Stationarity Difference . . . 13
2.1.4 Exploiting The Distribution Difference . . . 20
2.1.5 Summary of The Narrow-Band Spectrum Sensing Approaches . . . 22
2.1.6 Sub-Band Level Spectrum Spectrum Sensing . . . 24
2.1.7 Summary of The Sub-Band Spectrum Sensing Approaches . . . 29
2.1.8 Summary . . . 31
2.2 Spectrum Availability Modeling . . . 32
2.2.1 Time-Dimension Models . . . 33
2.2.2 Frequency-Dimension Models . . . 36
2.2.3 Space-Dimension Models . . . 37
2.2.4 Summary . . . 39 vi
2.3 System Assumptions Validation . . . 41
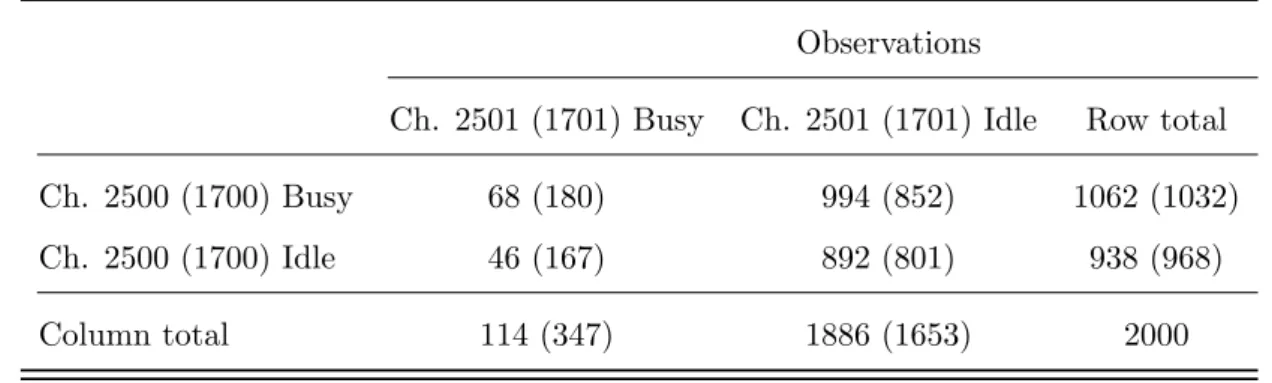
2.3.1 Independence Validation . . . 41
2.3.2 Non-Identical Distribution Validation . . . 42
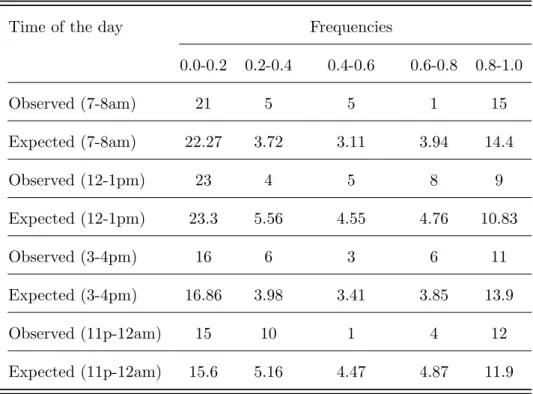
2.3.3 Bernouil Sequence Validation . . . 46
3 Probabilistic Modeling of Spectrum Occupancy 48 3.1 Introduction . . . 48
3.2 Related Work . . . 51
3.3 System Model and Problem Formulation . . . 56
3.4 Computation of P(Nf =r) . . . 57
3.4.1 Multi-Convolved Exact Probability Model . . . 60
3.4.2 Recursive Model . . . 63
3.4.3 Hybrid Model . . . 65
3.5 Probabilistic Modeling of Channel Types Availability . . . 66
3.6 Summary . . . 72
4 Network Performance Analysis and Potential Applications 73 4.1 Network Performance Analysis . . . 73
4.1.1 Detection Probabilities . . . 73
4.1.2 Aggregate Throughput and Interference . . . 76
4.2 Simulation Results . . . 76
4.2.1 Experiment 1: Comparison with the State-of-the-Art . . . 77
4.2.2 Experiment 2: Comparison of the Proposed Models . . . 82
4.2.3 Performance Analysis . . . 84
4.3 Applications . . . 86
4.3.1 Application 1: Assessment of Service Success . . . 86
4.3.2 Application 2: Database-Assisted Distributed Spectrum Sharing . 87 4.4 Summary . . . 91
5 Conclusions 99 5.1 Summary of Insights . . . 99
5.2 Future Work . . . 100
5.2.1 Limitations of the Energy Measurements . . . 100
5.2.2 Utility of the RF Propagation Models . . . 101
5.2.3 Mobility . . . 101
2.1 Flow chart of conventional energy detection. . . 10
2.2 Flow chart of frequency domain energy detection. . . 10
2.3 The SNR wall phenomenon. . . 12
2.4 Flow chart of second order cyclostaionary based detection technique. . . . 14
2.5 Flow chart of covariance based detection. . . 15
2.6 Block diagram of Eigenvalue based detection technique. . . 17
2.7 Block diagram of the pilot based detection technique. . . 19
2.8 Flow chart of entropy based detection. . . 20
2.9 Flow chart of kurtosis based detection. . . 21
2.10 Summary of the state-of-the-art local narrow-band spectrum sensing ap-proaches. . . 22
2.11 Block diagram of the wavelet based detection technique. . . 27
2.12 Summary of the state-of-the-art local sub-band spectrum sensing approaches. 29 2.13 Discrete-Time Markov Chain (DTMC) model . . . 34
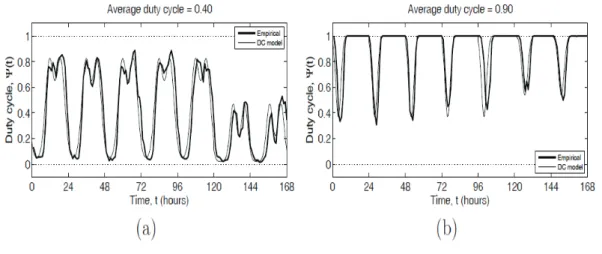
2.14 Empirical DC time evolution and corresponding deterministic model for: (a) DCs 1800 low/medium-load channel, (b) E-GSM 900 medium/high-load channel . . . 35
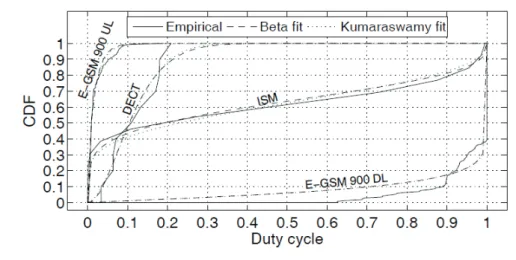
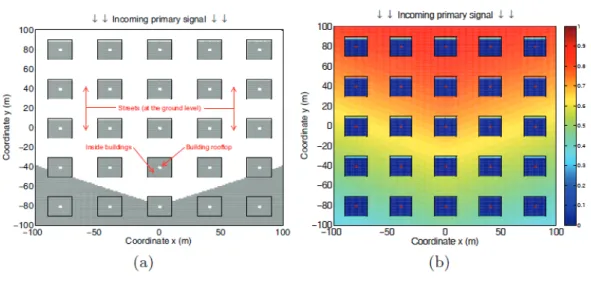
2.15 Empirical DC distributions and corresponding beta and Kumaraswamy fits 37 2.16 Spatial spectrum occupancy modeling approach . . . 38
2.17 Characterization of spatial spectrum occupancy perception at various lo-cations in a realistic urban environment: (a) in terms of binary busy (white)/idle (gray) observations, (b) in terms of the probability to observe spectrum as busy . . . 39
3.1 Beta density 2.2.2 histogram of idleness probabilities in two different ge-olocations [11] . . . 51
3.2 Channel idelness probabilities and comparison among the exact distribu-tion, normal approximadistribu-tion, and proposed poisson-normal approximation [11] 52 3.3 Probability Mass Function of 20 channels. On right, the channel
probabili-ties are small and have low variance whereas subfigure on left, probabiliprobabili-ties are high with very low variance [95, 96] . . . 53 3.4 Occupancy of a spectrum composed of n non-overlapping subchannels as
well as Subband Types . . . 56 3.5 Computation ofNf using the convolution technique in a subband composed
of 32 subchannels. Subband decomposed into 4 portion of 8 subchannels where the distribution of each portion is calculated. After that, the distri-butions are convoloved. . . 61 3.6 Channel availability and distributions of Nf(3) throughNf(8) . . . 64
3.7 Types of available subbands: (a) Type I, (b) Type II, (c) Type III . . . . 68
4.1 Comparison of distribution results with existing models for Aachen, Ger-many measurements during 7:00-8:00 am . . . 77 4.2 Comparison of the exact/recursive distribution against Camp-Paulson model
proposed in [95, 96] . . . 80 4.3 64-spectrum channel availability modeling . . . 82 4.4 256-spectrum channel availability modeling . . . 83 4.13 A square area of a length 400m with 2 scattered APs. Each AP is managing
a set 8 TV channels. Actual vs. Predicted future availability at time t = SU request, t+1, t+2 are presented . . . 90 4.5 Dynamic spectral occupancy in a spectrum of 512 subchannels for 30
min-utes accompanied by the availability distributions . . . 92 4.6 Dynamic spectral occupancy in a spectrum of 1024 subchannels for 30
minutes accompanied by the availability distributions . . . 93 4.7 Performance comparison in terms of algorithm running time . . . 94 4.8 Performance comparison in terms of time complexity . . . 95 4.9 The effect of energy sensing impairment on the primary user activity
mod-eling performance in terms of receiver operating characteristics [109] . . . 96 4.10 The effects of threshold level decision at the modeling stage . . . 97 4.11 Success probability in findingr or more available subchannels . . . 97 4.12 A square area of a length 500m with 4 scattered APs. Each AP is managing
a set 16 TV channels. PDFs of the number of available channels at time t = SU request as well as t+1 prediction are presented . . . 98
DSA Dynamic Spectrum Access CR Cognitive Radio
PDF Probability Distribution Function CDF Cumulative Distribution Function PU Primary User
SU Secondary User
i.i.d. independent and identically distributed i.n.i.d. independent not identically distributed
n-SS Spectrum of interest composed of n non-overlapping Subchannels BS Base Station
QoS Quality of Service FFT Fast Fourier Transform
RSSI Received Signal Strength Indication RF Radio Frequency
ROC Receiver Operating Characteristics
WINNER Channel model under B2 outdoor scenario AWGN Additive White Gaussian Noise
CCDF Complementary Cumulative Distribution Function CSI Channel State Information
AP Access Point
IEEE Institute of Electrical and Electronics Engineers GPS Global Positioning System
EE Energy Efficiency SNR Signal to Noise Ratio
SNIR Signal to Noise and Interference Ratio UT User Terminal
n Number of subchannels in operating spectrum pi i-th subchannel free probability
¯
pi i-th subchannel occupancy probability (1−pi)
Nf(n) Discrete random variable that represents the total number of available
subchannels in the n-SS
Ni Discrete random variable that represents the total number of available
type-i subbands
xi Binary random variable to indicate occupancy of the i-th subchannel
Xj Binary random variable to indicate occupancy of the j-th type-i subband
P(Nf =r) Exact probability of having r free subchannels
T(n) Time complexity of an algorithm α,β Beta distribution parameters
O Lower bound of time complexity function growth rate ci steps or operation taken to execute an algorithm
k Number of subbands in a spectrum of interest m Number of subchannels in a subband
Pd Probability of detection
Pf a Probability of false alarm
H(0,1),j Subchannel availability hypothesis
Rj Secondary received signal
Sj Primary transmitted signal
Wj Received noise
Hj Channel gain between primary transmitter and secondary receiver
γj Decision threshold of subchannelj
M Samples of interest
CN(µ, σ2) Complex Gaussian distribution with meanµand varianceσ2 Nd Discrete random variable to represent the number of detected
available subchannels
Od Discrete random variable to represent the number of detected
occupied subchannels
R Aggregate opportunistic throughput
C Aggregate interference to the primary users ρ Decision threshold of meeting a request
dB Decibel
Chapter
1
Introduction
Wireless communication systems have been exploited since the early days of radio commu-nications under a fixed spectrum management policy. Portions of the spectrum separated by guard bands have been allocated to particular licensees over large geographical re-gions, on a long term basis, and under protected status. Under this static regulatory regime, the overwhelming proliferation of new operators, services and wireless technolo-gies has resulted in the reduction of spectrum bands with commercially attractive radio propagation characteristics. As a result, the Dynamic Spectrum Access (DSA) paradigm based on the Cognitive Radio (CR) technology [1] has gained popularity, motivated by the currently inefficient utilization of spectrum already demonstrated by many spectrum mea-surement campaigns performed all around the world [2–6]. The basic underlying principle of DSA/CR is to allow unlicensed users to access in an opportunistic and non-interfering manner some licensed bands temporarily unoccupied by licensed users. Unlicensed (sec-ondary) DSA/CR terminals monitor the spectrum in order to detect spectrum gaps left unused by licensed (primary) users and opportunistically transmit. Secondary unlicensed transmissions are allowed according to this operating principle as long as they do not result in harmful interference to the licensees. As a result of the opportunistic nature of the DSA/CR principle, the behavior and performance of a network of DSA/CR nodes depends on the primary spectrum occupancy pattern therefore realistic and accurate mod-eling of such patterns becomes essential and extremely useful in the domain of DSA/CR research. Models of spectrum use can find applications in a wide variety of fields,
ing from analytical studies to the design, dimensioning and performance evaluation of secondary networks, including the development of innovative simulation tools as well as novel DSA/CR techniques.
Moreover, by properly exploiting spectrum opportunity models, performance of spectrum sensing can be significantly enhanced. Given a wide-band system, the primary user oc-cupancy in the entire spectrum is very difficult to determine due to its time complexity, as the larger the bandwidth to be scanned the higher will be the time needed for sensing. Therefore, instead of sensing the frequency band of interest, one can exploit knowledge of historical data to develop prediction models that can either select the most appropriate portions of spectrum or advise whether it is feasible to perform sensing at a given time and suggest alternative time. Hence, this reduces the need for exhaustive and extensive sensing [3] [4].
1.1
Objectives and Motivation
There are several benefits associated with estimating the likelihood of availability of a cer-tain number of free channels, i.e. the probability that a count of channels are available: P r(Nf = r), and their configuration/location over a spectrum. It can provide a
track-able representation of the statistical properties of spectrum usage that can adequately be employed in the analytical studies or implemented in simulation tools for the performance evaluation of CR technologies. Moreover, this information can act as a pre-requisite for performing further processing to establish the communication link. In this manner, we can avoid unnecessary overhead calculations and processing in the scenarios where the chances of establishing a link can satisfy the expected QoS. Modeling the number of avail-able channels and their configuration also provides useful information to establish if the constraints in terms of communication strategy can or cannot be met (e.g. FFT size that the transceiver can process, number of pilots used for channel estimation, carrier aggre-gation strategies/algorithms available to transceiver, etc.). If any of these constraints in a transceiver imply that the expected number and configuration of the channels is not suitable, we can avoid doing the unnecessary further processing involving sensing, channel
estimation, spectrum aggregation, etc.
To date, most developed spectrum occupancy models, used in cognitive radio research, rely on assumptions and oversimplifications. For instance, most studies within spectrum modeling assume that channel availability over any spectrum follows an independent and identically distributed (i.i.d.) Bernoulli sequence [7] [10]. Yet, real-time measure-ments indicate that channel availability depends on the channel frequency/location [4], which suggests that an i.n.i.d. model should be employed instead. This motivated us to consider building accurate predictive models on spectrum availability. With the aid of real-time energy-sensed measurements conducted over several bands in different geo-graphic locations, we use detection threshold to extract the availability probability for all subchannels of interest. We assume that these subchannels probability distributions follow the i.n.i.d. model which has been extensively validated in [11] [12]. We employ convolution, recursive, and hybrid convolution-recursive methods to develop accurate and efficient techniques that facilitate the computation of theavailability probabilityofr sub-channels,P(Nf =r), whereNf denotes the number of available subchannels at any given
time instant. Furthermore, we discuss the impact of spectrum availability in network per-formance in terms of detection probability and aggregate throughput. Additionally, as an attempt to minimize interference to primary users, we propose to categorize available subchannels into three different types, based on the occupancy of its two adjacent sub-channels, then, probabilistically model their availability using the proposed hybrid model. Finally, through computer simulations, we validate the effectiveness of our models using the real time measurements, assess their efficiency using algorithm time complexity anal-ysis, and further demonstrate an application for spectrum availability modeling.
1.2
Fundamental Assumptions
The following assumptions were made in the context of channel probability modeling as well as network performance analysis:
• In the entire spectrum, the channel occupancy is statistically independent, i.e., the arrival of a primary user in one channel does not depend on the arrival of another
primary user in any other channel at the same time instant. Therefore, channels availability random variables are modeled as independent Bernoulli random vari-ables. However, these availabilities are not necessarily identically distributed, i.e., the probability that thei-th channel is available is not necessarily the same as the probability that thej-th channel being available. Moreover, although most studies within modeling available spectrum assume that channel availability over any spec-trum follows an independent and identically distributed (i.i.d.) Bernoulli sequence, extensive real-time spectrum measurement campaigns indicate that channel avail-ability depends on the channel frequency/location and further suggests that an i.n.i.d. model should be employed instead. This has motivated us to consider the i.n.i.d. model in our research. This assumption is validated in Chapter 2.
• As an input for the modeling stage, we assume that channel availability probabilities are known. These probabilities could be determined at a given location using two schemes: 1) A data-driven approach where spectrum measurements for that location are applied. It requires widespread measurements at low sensitivity thresholds and may take a long time to complete. Furthermore, these measurements will have to be repeated whenever the primary user’s transmission characteristics, such as transmit power, antenna height, license terms, etc., change. 2) A model-driven approach where RF propagation models are employed to compute spectrum availability. Given a transmitter’s location, transmit power, antenna directionality, etc., these models are used to estimate the received signal strength indication (RSSI) at any given location [13–16]
• Reliable channel estimation relies on some kind of exchange of information between transmitter and receiver (feedback channel, pilot symbols, etc.). This might be particularly difficult to establish in a cognitive radio environment since primary users are not supposed to modify their transmission due to the existence of secondary users. Therefore, a more realistic assessment is to take into account imperfect channel knowledge, where the statistics of channel coefficients are estimated by the secondary users without the presence of information exchange with the primary transmitters [17–19].
• Every white space device primarily relies on the database to determine the white space availability. Hence, this results in a delay in the device learning about changes in spectrum availability. Either the device will have to poll the database, or the database will have to push updates to the device. This problem becomes worse when the devices are mobile. If mobile, the device could have traveled some dis-tance between the time it receives two subsequent spectrum updates. Throughout our work, we focus mainly on fixed channels, i.e., TV channels. Future work can ac-commodate the mobility factor and consider adding protection range of the distance to learn further about determining white spaces.
1.3
Thesis Structure and Outline
The remainder of the thesis is structured as follows:• Chapter 2: ”State-of-the-art Spectrum Modeling”
This chapter focuses on providing an overview of existing spectrum availability mod-els as well as white spaces sensing techniques. Firstly, we illustrate some of the ex-isting modeling approaches categorized as time-, frequency-, and space-dimension, each of which describe the statistical properties of spectrum usage in the corre-sponding domain. Secondly, we validate the i.n.i.d. model for channel availability probabilities over two sets of real time measurements at two disparate geographic locations using McNemar’s and Pearson’s Chi-square tests.
• Chapter 3: ”Probabilistic Modeling of Spectrum Occupancy”
In a cognitive radio network, sub-bands of a spectrum are shared by licensed (pri-mary) and unlicensed (secondary) users in that preferential order. It is generally recognized that the spectral occupancy by primary users exhibit dynamic spatial and temporal properties and hence it is a fundamental issue to characterize the spectrum occupancy in terms of probability. With the sub-band free probabilities being available, an analytical model is proposed for spectrum occupancy in a cog-nitive network. To reduce the computational complexity of the actual distribution
of total number of free sub-bands, we employ convolution, recursive and hybrid convolution-recursive techniques and develop efficient algorithms. Furthermore, we characterize certain types of free channels based on the occupancy of its adjacent channels. Then, the probability distribution of each type subband is computed. • Chapter 4: ”Network Performance Analysis and Potential Applications”
In this chapter, we consider a multi-channel joint detection framework in which a technique takes into account the detection of primary users across multiple channels. In addition, we present the impact of the modeling on network performance and propose an efficient approach to determine the probability of detecting multiple channels simultaneously. Furthermore, we evaluate the accuracy and efficiency of our proposed models and compare them to the ones proposed in the state-of-art. Finally, we illustrate 2 applications associated with the use of the modeling. • Chapter 5: ”Conclusions”
This chapter provides a conclusive summary and puts into perspectives the nu-merous insights and findings that have been obtained from the previous chapters. Furthermore, deeper focus on QoS aspects of the proposed applications as well as open issues on propagated error are discussed and future work directions on this topic are proposed.
1.4
Overview of Contributions
The main contributions of this thesis can be summarized as follows:
• Modeling of spectrum occupancy: 3 models that enable to reduce the computational complexity of the actual distribution of total number of available channels based on the i.n.i.d paradigm.
• Categorization of certain types of free channels based on the occupancy of their neighbor channels.
• A multi-channel joint detection framework is presented with respect to the network performance where the probability of detecting multi-channels simultaneously has
been derived.
• Performance of the modeling: The proposed models show Furthermore, 2 applica-tions associated with the use of the modeling are illustrated. One features novel 2-Dimensional (time, freq) availability modeling.
1.5
Publications
The research carried out during the course of this PhD has resulted in the following pub-lications:
1. A. Akbari, M.A. Imran, R. Hoshyar, A. Amich, and R. Tafazolli, ”Average Energy Efficiency Contours with Multiple Decoding Policies,” IEEE Comm. letters, vol. 15, n. 5, 506-508, May 2011.
2. A. Amich, M.A. Imran, R. Tafazolli and P. Cheraghi, ”Accurate and Efficient Algo-rithms for Cognitive Radio Modeling Applications under the i.n.i.d. Paradigm,” IEEE Transactions on Vehicular Technology, vol. PP, no. 99, pp. 1, March 2014.
Chapter
2
State-of-the-art Spectrum Modeling
The basic idea behind development of opportunistic spectrum access technologies such as cognitive radio is to increase the spectral utilization. This goal can be achieved by identifying and utilizing the spectrum holes; given the, the conventional definition of spectrum hole: a band of frequencies that are not being used by the licensed user of that band at a particular time in a particular geographical area [20]. Hence, based on this definition, identifying spectrum holes requires exploitation of three dimensions of frequency, time and space by the spectrum sensing device. In other words, the main task of any spectrum sensing device is to determine if the frequency band of interest is occupied by the licensed user during a time slot within a certain geographical area [21]. Spectrum modeling depends solely on spectrum sensing. For example, in order to evaluate the performance of statistically modeling spectrum holes, one has to refer to spectrum sensing. Therefore, in this chapter we provide an overview of existing spectrum sensing techniques as well as spectrum availability modeling approaches.
2.1
Spectrum Sensing Techniques
In what follows, firstly, we will consider the original problem of local narrow-band spec-trum sensing and provide a comprehensive study of existing solutions and secondly, the concept of local sub-band sensing is considered along with the state-of-the-art sub-band spectrum sensing algorithms.
2.1.1 Narrow-Band Spectrum Sensing
The general problem of spectrum sensing can be modelled as the binary hypothesis test-ing with hypothesizes: H0, when the frequency band of interest is vacant and no other
users is utilising this frequency band; and H1, when the frequency band of interest is
oc-cupied by other users and not available for opportunistic usage. Therefore, this problem mathematically reads as:
H0 :y(t) =v(t),
H1 :y(t) =s(t) +v(t),
(2.1)
wherey(t) denotes the received signal at the spectrum sensing device,v(t) is the Additive White Gaussian Noise (AWGN) with zero mean, and s(t) represents the signal transmit-ted by the existing active users. Hence, based on 2.1 spectrum sensing techniques can be evaluated through two classical metrics, namely probability of detection (PD) and probability of the false alarm (PFA).
Mathematically, the probability of false alarm is defined by [22]
P F A,P r
T ≥λ|H0
(2.2)
whereT denotes the test statistics andλis the detection threshold. As it can be observed from 2.2, PFA reflects the probability of an event where the spectrum sensing device reports an alarm when the signal is actually not being transmitted.
While, probability of detection is defined by
P D,P r
T ≥λ|H1
(2.3)
From 2.3 it can be concluded that PD reflects the probability of an event where the spectrum sensing device reports an alarm when the signal is indeed there. Spectrum sensing problem explained in 2.1 has been quite well investigated in the literature, for which there are many approaches reported. In general, the existing spectrum sensing approaches can be divided into three main categories:
• Exploiting the energy difference.
• Exploiting the distribution difference.
In the following sections each of the above categories is explained and compared in detail.
2.1.2 Exploiting Energy Difference
The spectrum sensing approaches which fall into this category make a decision based on the estimated energy of the received signal at the spectrum sensing device. The most well-known spectrum sensing approach developed under this category is the energy detection [22].
Energy Detection
Figure 2.1: Flow chart of conventional energy detection.
Figure 2.2: Flow chart of frequency domain energy detection.
Energy detection (radiometer) is the simplest spectrum sensing approach introduced in the literature [22–25]. Due to its low computational complexity it is also the most com-mon technique used in practice. This approach can be thought of as a blind spectrum sensing approach since it does not require a priori knowledge of the signal being detected. Therefore, it is robust to variation of the signal being detected and thus it is known as the optimal detector in the case where we assume absolutely no deterministic knowledge about the signals being detected. Figure 2.1 and 2.2 show block diagrams of the en-ergy detection algorithm. As it can be observed this technique can be implemented in either frequency or time domain. It is worth mentioning that the conventional energy
detection is implemented in time domain, while the frequency domain version was later introduced for sub-band [26] purposes. Frequency domain energy detection is usually used to simultaneously detect the vacancy of several sub-bands, i.e., filter bank based energy detection [26].
The test statisticsTED for time domain energy detection is given by
TED = 1 N N∑−1 s=0 |y(n)|2 (2.4)
where y(n) and N represents the sampled received signal and the observation length re-spectively. While the test statistics in frequency domain energy detection is also cal-culated as 2.4, with a minor difference that it is a function of ˜y = FN×Ny, given
that FN×N denotes an N × N Discrete Fourier Transform (DFT) matrix and y =
[y(0), y(1), ..., y(N −1)]T.
Using central limit theorem [27] it can be observed that the alternative hypothesis testing in 2.1 for energy detection can be expressed as [28]
lim N→∞∼ σv2, H0 (σs2+σv2), H1 (2.5)
whereσv2 andσs2 denote the noise and signal variance respectively. As it can be observed
from 2.5 the energy difference which exists between the two hypotheses can be used as a metric for performing spectrum sensing. Thus, the availability of the frequency band of interest using energy detection approach can be determined using
TED
H1 ≶
H0
λ
ED (2.6)whereλED denotes the energy detection threshold. It is clear from 2.5 and also from the
derivations in [22] and [28] that the threshold value is directly proportional to the noise power. Thus, it can be concluded that the energy detection approach requires accurate knowledge of the noise power, specifically in low SNR values, in order to deliver a reliable performance.
However, noise power estimation error is unavoidable in practical systems, hence, this will give rise to a phenomenon called noise uncertainty [22] [28].
Figure 2.3: The SNR wall phenomenon.
Energy Detection Under Noise Uncertainty
In most communication systems noise is an aggregation of various independent sources, i.e. thermal noise, interference due to nearby unintended emissions, etc. Thanks to the central limit theorem [27], one can assume that noise at the receiver is a Gaussian random variable. We should bear in mind that the error due to this assumption will tend to zero as √1
N, where N is the number of independent random variables being
summed up. In a practical scenario N is usually moderate therefore this error can not be neglected, especially in low SNR environments. For some constant K the error due to this assumption can be modeled as [27]:
|Fv(x)− N(x)| ≤
k √
N (2.7)
whereFv(x) denotes the actual noise distribution andN(x) denotes a zero mean Gaussian
distribution. Nevertheless, most detectors operate under the assumption of the received noise being Gaussian. The other main factors causing noise uncertainty is the temperature variations at the receiver which leads to inaccurate noise power measurements. Hence, it can be concluded that if the SNR at the spectrum sensing device is sufficiently low, there would be enough uncertainty in the noise to render the energy detection useless. Consider the case with noise uncertainty factorU, since the energy detector only sees the the energy, distribution for the noise uncertainty can be summarized in a single interval
σv2 = [(1/U)σn2, U σn2].
It is further proved in [9] that as the observation length is increased, i.e., N → ∞, the minimum operating SNR in which the energy detection can operate desirably will converge to SNR↓(U−(1/U)). This introduces a phenomenon called ”SNR wall”. SNR wall of a spectrum sensing device is defined as the maximal SNR such that for any SNR≤SNRwall
detection is impossible for that particular detector. The SNR wall for energy detector can be expressed as:
SN Rwall =
U2−1
U (2.8)
In the last four decades since the publication of [22], many solutions have been devel-oped to make energy detection more robust in terms of SNR wall (e.g. [29–31]), yet the noise uncertainty problem in spectrum sensing approaches based on the energy difference still exists. Hence, small noise power estimation error can result in significant perfor-mance loss [32]. Consequently the noise power has to be estimated dynamically. This is done by separating the noise and signal subspaces using multiple signal classification algorithm [33]. Noise variance estimated by using the value of the smallest eigenvalue of the incoming signals autocorrelation. In [34] an iterative algorithm is proposed to find the near optimum threshold value. The performance of energy detection technique over various fading channel models has been investigated in [25], where it is shown that fading channels can have a detrimental effect on the performance of the energy detection based spectrum sensing.
2.1.3 Exploiting Stationarity Difference
Stationarity is defined as a quality of a process in which the statistical parameters of the process do not change with time [35]. The spectrum sensing approaches which fall into this category exploit the various stationarity difference which exists between the noise and signal. In what follows the state-of-the-art spectrum sensing approaches which fall into this category are explained in detail.
Figure 2.4: Flow chart of second order cyclostaionary based detection technique.
Second Order Cyclostationarity Detection
The initial works of spectrum sensing through stationarity difference can be traced back to work of Dandawate et. al. in [36], where second order cyclostionarity is employed. Cyclostationarity detection is based on exploiting the cyclostationarity feature of the received signal [37, 38]. This feature is caused by periodicity in the statistics of the transmitted signal which could be a result of modulation, coding or intentionally to assist spectrum sensing [39–41]. Process y(n) is considered sub sense cyclostationary process if
µy =E[y(n)] =E[y(n) +P] (2.9) and Ry(n) =E [ y(n)y∗(n+η) ] =E [ y(n+P)y∗(n+P +η) ] (2.10)
∀n, η ∈Z The smallest value ofP for which 2.9 and 2.10 hold is called the period. Being periodic, Ry(n) follows Fourier Series expansions over cyclic frequencies with the set of
cycles A:= [κ =k/P, k= 0,1, ...,P −1]. Hence, the Fourier coefficients also called cyclic auto correlations are related to Ry(η) using
ˆ
Rκy(η) = 1/P P−∑1
n=0
Ry(η) exp−j2πκn (2.11)
As it can be observed from 2.11 the cyclic autocorrelation function at a given cyclic fre-quency determines the correlation between spectral components of the signal separated in frequency by an amount of 1/P, hence, given sufficient observation length the cyclic autocorrelation function of cyclostationary signals is nonzero only for set of cycles which fall in the set A. Thus, one can determine the vacancy of the frequency band of interest by analyzing the cyclic autocorrelation function of the received signal [36], i.e. using the second order cyclostationary feature. More interestingly, cyclostionarity based detection
can be employed to differentiate different types of signals [42]. Figure 2.4 illustrates the block diagram of a second order cyclostationarity based detection technique.
In the above procedures it has been assumed that the cyclic frequency is known at the receiver. However, this assumption may not be reasonable when the spectrum sensing device is required to perform sensing in a sub spectrum band. Since, the sensing device may not have knowledge of the period of all the users operating and storing these infor-mation covering the whole geographical area in which the sensing device (specifically for non stationary users) requires connection to an accurate location aided database. Thus, an exhaustive search is required to determine the operating cyclic frequencies. This will increase the complexity of the detector significantly and furthermore the detector will loss the ability of distinguishing between the signal and the interference which also have cyclic characteristics. It is shown in [36, 40] that the cyclostationarity based scheme can trade latency with high sensing reliability. Furthermore, It is less sensitive to the noise uncertainty provided the knowledge of signals cyclic frequency [43].
Covariance Based Detection
Figure 2.5: Flow chart of covariance based detection.
To overcome the requirement of cyclic frequency information in cyclostationary based detection while not suffering from the noise uncertainty problem which exists with energy detection, the covariance based detection was introduced [44]. This spectrum sensing method, as the name implies, is based on the estimated covariance matrix of the received signal, and utilizes the correlation which exists in the transmitted signal to determine the vacancy/occupancy of the frequency band of interest. Hence, it is proved to be very
effective when the transmitted signal is highly correlated [44, 45].
The correlation of the received signal samples can be due to many factors, e.g., modu-lation, multi-path fading, multiple receivers or can be intentionally introduced by over-sampling at the spectrum sensing device [46], while the noise samples are independent. Moreover, since the covariance matrix of noise is determined by the receiving filter at the receiver its structure is known to the spectrum sensing device, allowing us to differentiate the two hypothesis in 2.1 [47].
Consider L to be the number of consecutive samples used for estimation the covariance matrix, i.e.,
y(n) = [y(n)y(n−1)...y(n−L+ 1)]T, (2.12) hence, the estimated covariance matrices can be expressed as
lim L→∞Cy =Cs+σv 2I L (2.13) where Cs =E[s(n)s∗(n)] (2.14) Cy =E[y(n)y∗(n)] (2.15)
ILdenotes anL×Lidentity matrix ands(n) = [s(n)s(n−1)...s(n−L+ 1)]T. Given that
the noise samples are uncorrelated based on 2.13, it can be concluded that considering theH0 scenario in 2.1, if the signals(t) is not present, i.e., whenCs= 0, the off-diagonal
elements of Cy are all zero. On the other hand, if the signal s(n) is present, i.e., H1
hypothesis in 2.1, Cy will no longer be a diagonal matrix due to the correlation between
thes(n) samples, resulting in off diagonal elements. Hence, the vacancy of the frequency band of interest can be determined based on the sum value of the off-diagonal elements. Based on [44], an effective test statistic for this purpose would be TCD = TT12 where
T1 = 1/L L−1 lim n=0 L−1 lim m=0|cm,n| (2.16) T2 = 1/L L−1 lim n=0|cn,n| (2.17)
given thatcm,n denote the element of the matrix Cy at themth row andnth column.
Considering the H0 scenario, TCD = 1 while givenH1 hypothesis TCD > 1. However,
hence in order to make a reliable decisionTCD should be compared to a threshold value
which is function of observation length and the required PFA. Details of the threshold setting can be found in [44]. It should be noted that the performance of the covariance based detection is highly dependent on the correlation of the received signal hence, in the extreme case where the received sample are Independent and Identically Distributed (i.i.d.) this spectrum sensing approach will fail.
Eigenvalue Based Detection
Figure 2.6: Block diagram of Eigenvalue based detection technique.
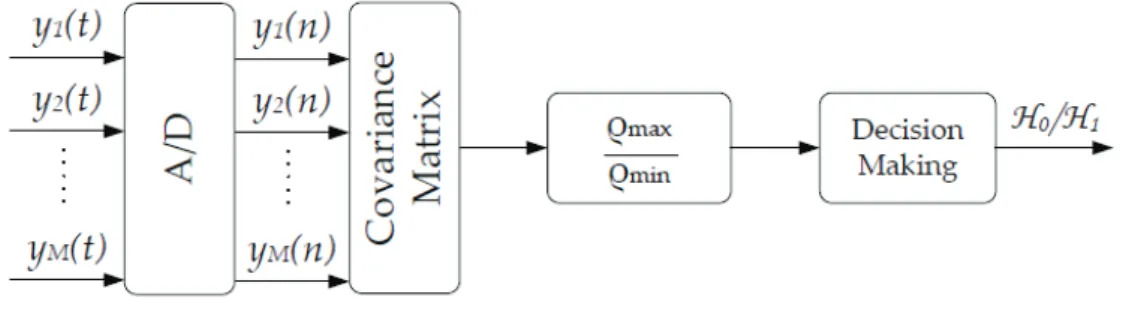
Following the development of the covariance based spectrum sensing approach the eigen-value based detection was introduced in [46–49]. The eigeneigen-value based detection scheme exploits orthogonality between the signal subspace and noise subspace using covariance matrix, i.e., second order stationarity features, to offer highly reliable spectrum sens-ing [46].
Hence, based on this approach the vacancy of the frequency band of interest is determined based on the fluctuation of the eigenvalues [35] of the covariance matrix, and hence many test statistics have been proposed to efficiently utilize this fluctuation [46–49].
Amongst the well known test statistics for eigenvalue based detection is the ratio of the maximum to minimum eigenvalues [46]. Let ϱmin and ϱmax denote the minimum and the
maximum eigenvalues of the covariance matrixCy, respectively, hence, the availability of
the spectrum can be determined using
TEV = ϱmax ϱmin H1 ≶ H0
λ
EV (2.18)In [46], the asymptotic statistical characteristics of ϱmin and ϱmax under H0 have been
given probability of false alarm has been provided.
An other popular test statistic used in eigenvalue based detection is the ratio of the maximum eigenvalue to the average eigenvalue, i.e, TEV = ϱϱmaxmin, where
¯ ϱ= 1/L L−1 lim l=0ϱl (2.19)
The asymptotic threshold value of the above test statistic is provided in [46]. However, like covariance based detection, the eigenvalue based detection will fail if and only if
Cs = σsIL i.e., the received signal samples are i.i.d. . However, the correlation
be-tween the received signal can be forced with employment of multiple receive antennas or oversampling.
Matched Filtering
Matched filtering is known to be the optimum method for detecting signals when the transmitted signals air interface is completely known to the sensing device [50]. The main advantage of matched filtering is low latency and computational complexity. Match filtering requires a very short time to achieve the desired probability of false alarm or probability of detection as compared to all the existing detection methods while intro-ducing a linear complexity even in a very low SNR environment since it maximize the received SNR at the sensing device [50]. On the other hand the shortcoming of the match filtering technique is that the spectrum sensing device needs to demodulate the received signal prior to determine the vacancy of the frequency band of interest. Hence it will introduce to main concerns 1) requiring a perfect knowledge of the transmitted signals signaling feature, 2) security issue, since this allows the spectrum sensing device to have access to the transmitted message.
Since the spectrum sensing device should be able to detect all the possible signals trans-mitted within the bandwidth of interest, the implementation complexity of such detection technique is impractically large, due to perfect knowledge of all the available signaling information of users [51]. One of the other disadvantages of match filtering is large power consumption as all the possible receiver algorithms needs to be executed for spectrum availability decision making.
Pilot Based Match Filtering Detection
Figure 2.7: Block diagram of the pilot based detection technique.
In practical communication systems, pilots are usually transmitted periodically for time or frequency synchronization applications, channel estimation, etc. These pilots, if known to the spectrum sensing device, can be utilized for coherent detection of the transmitted sig-nal with the aid of match filtering. Therefore, it works even under a very low SNR region. Furthermore, it has lower complexity and latency than statistics based cyclostationary and covariance based detection while overcoming the noise uncertainty problem. More-over, it does not require demodulation of the transmitted signal as the conventional match filtering since orthogonal to the data and can be considered independently. Therefore, pilot based coherent detection is always one of the preferred spectrum sensing schemes in practice.
In the scenarios where the pilot structure is known to the spectrum sensing device the optimum detection technique would be match filtering. Therefore, the test metric can be expressed as: TP M =E { y(n)sp∗(n) } (2.20)
where sp ∗(n) denotes the known pilot signal. Hence, a decision can be made using,
TP M
H1 ≶ H0
λP M, where λP M denotes the threshold value to satisfy the required
proba-bility of false alarm.
In 2.20 perfect synchronization between the sensing device and the transmitter is assumed, while this condition is not feasible in practice. Hence, the sensing device has to perform an exhaustive search to find the timing offset which maximizes theTP M value. Recently,
various robust pilot-based coherent detection schemes have been proposed for spectrum sensing applications [52–54] .
2.1.4 Exploiting The Distribution Difference
Given that in almost all communication system models, noise is assumed to be additive white and Gaussian, one can determine the vacancy of a particular frequency band by observing the difference of the received signals distribution and that of the AWGN. Based on this feature a number of well known spectrum sensing algorithms have been proposed, which are explained in this section.
Entropy Based Detection
Figure 2.8: Flow chart of entropy based detection.
In information theory, entropy is a measure of the uncertainty associated with a dis-crete random variable. The term by itself usually refers to the Shannon entropy, which quantifies the information conveyed in a message [55]. Recently, entropy based detection approaches have been employed for spectrum sensing applications [56, 57]. Entropy based spectrum sensing can be thought of an approach which exploits the distribution difference in order to determine the vacancy of the frequency band of interest.
In order to allow robustness to noise uncertainty issue, the entropy based detection makes a decision based on the estimated entropy of the measured signal in the frequency domain with the probability space partitioned into fixed dimensions. This is due the fact that the entropy of the received signal in the time domain is related to the signal power and is sensitive to noise uncertainty [56]. Hence, the test statistic for this spectrum sensing approach can be expressed as [57]
TEB =− L−1 lim i=0 log Ki N H1 ≶ H0
λ
EB (2.21)whereLdenotes the dimension of probability space,N is the number of Discrete Fourier Transform (DFT) points,Kiis the total number of occurrences at theithprobability state,
and λEB is the threshold value used for decision making. Assuming that the estimated
noise entropy follows a Gaussian distribution, the value of λEB can be easily calculated
based on the desired PFA and value of L [57]. However, the entropy based detection will fail to deliver accurate results, when the transmitted signals also follow a Gaussian distribution and since the convergence to normality could be extremely slow, this approach will require relatively high observation length. However, this would is in contradiction to achieving channel capacity, which benefit from Gaussian noise like transmit signals.
Kurtosis Based Detection
Figure 2.9: Flow chart of kurtosis based detection.
In statistics, kurtosis is a descriptor of the shape of a probability distribution, i.e., it is a measure of the peakedness of the probability. Hence, the kurtosis based detection was introduced to exploit the non-Gaussianity of communication signals in order to determine the availability of the frequency band of interest [58, 59]. For example for randomly occurring signals that produce non Gaussian distributions, the kurtosis estimate can be less than 3 or it can have a value much greater.
This scheme features excellent accuracy at the price of large latency due to higher order statistics. A critical point is that the sensing performance degrades significantly when signals are approximately Gaussian. Kurtosis is defined by the ratio of the expected value of the fourth-order central moment and the square of the expected value of the second-order central moment. Hence, the test statistic of the kurtosis based detection can be formulated as TKB = E[(y(n)−µy)4 ] E[(y(n)−µy)2 ]2 H1 ≶ H0
λ
KB (2.22)This scheme features excellent accuracy at the price of high computational complexity due to higher-order statistics. Furthermore, the convergence to normality could be extremely
slow, and the sample estimate of the kurtosis can deviate substantially from its true value even with a large number of observations. Thus, for moderate sample sizes which is a prerequisite for any spectrum sensing device, the kurtosis test cannot be expected to be accurate.
2.1.5 Summary of The Narrow-Band Spectrum Sensing Approaches
In the above discussion, we have introduced various state-of-the-art narrow-band spec-trum sensing techniques. As explained, various specspec-trum sensing techniques have different advantages/disadvantages and hence are applicable in different sensing scenarios. In gen-eral, the existing spectrum sensing approaches can be divided into three main categories:
Figure 2.10: Summary of the state-of-the-art local narrow-band spectrum sensing ap-proaches.
• Exploiting the energy difference. The most well-known spectrum sensing approach developed under this category is the energy detection [22]. The energy detection is recognized as a blind sensing scheme with advantages such as low complexity and low latency. However, it is very sensitive to the noise uncertainty such that its performance is limited by the SNR wall [28]. In the last four decades since the publication of [22], many solutions have been developed to make energy detection more robust in terms of SNR wall (e.g. [29–31]), yet the noise uncertainty problem in spectrum sensing approaches based on the energy difference still exists.
• Exploiting the stationarity difference. The initial works of spectrum sensing through stationarity difference can be traced back to work of Dandawateet. al. in [36], where second order cyclostionarity is employed. The cyclostationarity based scheme can trade latency with high sensing reliability. It is less sensitive to the noise uncertainty provided the knowledge of signals cyclic frequency [43]. To overcome the require-ment of cyclic frequency in cyclostationary based detection while not suffering from the noise uncertainty problem which exists with energy detection, the covariance based detection was introduced [44]. This spectrum sensing method, utilizes the cor-relation which exists in the transmitted signal to determine the vacancy/occupancy of the frequency band of interest. However, the performance of this approach de-grades dramatically as the correlation of the transmitted signal decreases. Matched filtering is known to be the optimum method for detecting signals when the trans-mitted signals air interface is completely known to the sensing device [50]. The main advantage of matched filtering is low latency and computational complexity. However, this approach requires perfect synchronizations between the transmitter and the spectrum sensing device. Matched-filtering pilot based detection, given the knowledge of pilot symbols and reasonably good timing and frequency synchro-nizations, exploits the cyclostationary property of the pilot symbols, to deliver fast and reliable sensing. The eigenvalue-based detection scheme exploits orthogonal-ity between the signal subspace and noise subspace using second order stationarorthogonal-ity features to offer highly reliable spectrum sensing [46]. However, it often needs the support of multiple antennas, and the subspace decomposition costs cubic complex-ity.
• Exploiting the distribution difference. Given that in almost all communication sys-tem models, noise is assumed to be additive white and Gaussian, one can determine the vacancy of a particular frequency band by observing the difference of the re-ceived signals distribution and that of the AWGN. An example of such approaches would be the kurtosis-type scheme, which exploits the non-Gaussianity of commu-nication signals [58, 59]. This scheme features excellent accuracy at the price of large latency due to higher-order statistics. A critical point is that the sensing per-formance degrades significantly when signals are approximately Gaussian. Entropy
based spectrum sensing can be thought of an approach which also benefits from this property [56], where the probability space is partitioned into fixed dimensions and the Shannon entropy is employed as the information measure of the received signal as the test statistic.
2.1.6 Sub-Band Level Spectrum Spectrum Sensing
With increase in the spectrum utilization, spectrum scarcity increases. This would call for spectrum sensing techniques that adopt an architecture to simultaneously search over multiple frequency sub-bands at a time, while meeting the mandatory requirements of spectrum sensing, i.e., 1) low latency, 2) high reliability and 3) low complexity.
However, the literature of sub-band spectrum sensing is rather limited at this time. In this section we will provide a system model for sub-band level spectrum sensing and further explain the state-of-the-art sub-band level spectrum sensing techniques in detail.
Sub-Band Level Spectrum Sensing System Model
Consider a communication system operating over a sub-band channel that is divided into K non-overlapping sub-bands, e.g., multi-carrier systems. However, in a particular geographical region within a certain time frame only l number of the sub-bands are utilized by the users, wherel < K. Thus, (K−l) sub-bands are available for opportunistic access. The essential task of the spectrum sensing device is to determine the availability of these (K−l) sub-bands.
Let y(n) denote the received sub-band signal at the spectrum sensing device. Hence:
y(n) =
K−1
lim
k=0Λksk(n) +v(n)
(2.23)
where Λq is the indicator function which denotes the presence of the transmitted signalq.
The opportunistic user needs to determine which of the spectrum bands are unoccupied, in order to utilize them efficiently. Based on 2.23 a number of solutions were proposed in the literature which are fully explained in the following sections.
Filter-Bank Based Spectrum Sensing
The Filter-bank architecture allows sub-band sensing with the aid of multiple narrow band, band-pass filters [26, 60]. Filter banks are often implemented based on a prototype lter. The prototype filter is a lowpass lter that is also used to realize the first sub-band of the filter bank. Other bands are realized through repetition of the prototype filter. Hence, all the N sub-bands of interest share the same structure.
The implementation of an spectral estimator that uses a filter bank for signal analysis is as follows: 1) the input process is passed through a bank of filters and 2) the output power of each filter is measured as an estimate of the spectral power over the associated sub-bands and finally the vacancy of each sub-band is determined based on the estimated power of that particular sub-band. However, like conventional energy detection this approach will face the noise uncertainty problem.
It is shown in [60] that the filter bank based spectrum sensing performs significantly better in filter bank-based multi-carrier communication systems, since the same filters can be utilized for sensing purposes. Hence, in such systems, channel sensing is done at virtually no cost. This is only possible given that all the users within the geographical area of interest share the same air-interface and furthermore the opportunistic user also employs the same air interface. However, in a more general case where users may have different signaling format the filter-bank approach will result in increased number of components and energy consumption.
Joint Multi-Band Detection
In order to improve the performance of the filter bank detection the joint multiband de-tection, was proposed in [61]. This approach jointly optimizes a bank of multiple narrow band detectors to improve the aggregate opportunistic throughput of the opportunistic users while limiting the interference to the existing users. In particular, the joint multi-band detection reformulates the original problem of submulti-band spectrum sensing into a class of optimization problems, where the objective is to maximize the aggregate opportunistic throughput in an interference-limited network given the opportunistic rate and interfer-ence penalty on each sub-band are known to the spectrum sensing device. Hinterfer-ence, the
optimization problem can be summarized by [61] maxrT [ 1−P F A(γ) ] K∑−1 i=0 ci [ 1−P Di(γi) ] ≤εj, j = 1,2, ..., J P F A(γ)≤β [ 1−P D(γ) ] (2.24)
where r = [r1, r2, ..., rK]T is a vector with the throughput achievable over all K
sub-bands, γ = [γ1, γ2, ..., γK]T is the vector denoting the threshold value for all sub-bands,
1−α = [1−α1,1−α2, ...,1−αK]T and β = [β1, β2, ..., βK]T are the minimum limit
for opportunistic spectral utilization required from the spectrum sensing device and the upper limit for the interference introduced by the opportunistic users, respectively. Hence, the threshold setting in this approach is in a such a way to firstly assure that the sub-band with a higher opportunistic rate has a higher threshold . In other words reduce PFA for the corresponding sub-band to ensure best possible use by the oppor-tunistic users. Secondly, the higher priority sub-band, i.e., sub-bands carrying important messages, have a lower threshold resulting in smaller PD in order to prevent opportunistic users interference. Finally, a little compromise on the subbands carrying less important information which might boost the opportunistic rate considerably. Thus, in the determi-nation of the optimal threshold for each sub-band, it is necessary to balance the channel conditions, the opportunistic throughput, and the relative priority of each sub-band. It has been shown in [61] that the joint multi-band detection can improve the performance of the filter-bank spectrum sensing significantly, and that the performance of this approach can be improved considerably by further exploiting the spatial diversity, i.e., cooperation between the spectrum sensing devices.
However, this technique requires the knowledge of noise power and the squared values of the channel frequency responses, which makes this approach only practical in fixed wireless networks, i.e., TV broadcast bands.
Sequential Multi-Band Detection
In, [62] a sequential detection scheme has been developed for multi-band spectrum sensing. This approach employs a bank of sequential probability ratio tests [63], i.e., one per sub-band. The sequential probability ratio test has a very simple structure where the likelihood ratio of the observed samples is tested against two thresholds. The sequential probability is known to minimize the average sample number amongst all detectors given the PD and PFA requirements of the system. Hence, this algorithm can be particularly useful in delay sensitive applications. The hypothesis testing for this approach for thekth sub-band can be expressed as
Tk SM ≥logAk, Hk0 Tk SM ≤logBk, Hk1
logBk≤TSMk ≤logAk, take next sample
(2.25)
where the test statistic TSM is the likelihood ratio estimated from the received signal
and the threshold values are related to the false alarm probability and the miss detection probability, i.e., [63] Ak≈ P D k P F Ak &B k≈ 1−P Dk 1−P F Ak (2.26)
However, the key challenge associated with this detector is that the parallel sequential probability tests do not yield the same sample sizes. This is due to the fact that the observation length is variable which depends on the random received signal. Thus, the overall sensing delay will be considered as the largest detection delay among those of the parallel detectors, until the set of bands that can support the requested rate is discovered.
Wavelet Based Detection
Figure 2.11: Block diagram of the wavelet based detection technique.
The wavelet based spectrum sensing is able to perform sub-band sensing with the aid of edge detection [64, 65]. Assuming that the power spectral characteristic is smooth within
each sub-band but exhibits a discontinuous change between adjacent sub-bands, wavelet based detection has been proposed to identify and locate the spectrum holes by exploiting the irregularities within the estimated Power Spectral Density (PSD) [35] with the aid of the wavelet transform, an attractive mathematical tool for analysing singularities and irregular structures of signals. Wavelet based detection has proved useful for fast coarse spectrum sensing based on a number of non-stationary samples, by making use of the signals non-stationarity features.
The wavelet based detection has been developed under four main assumptions: 1) The total bandwidth for detection is known to the spectrum sensing device , 2) The number of licensed users are unknown to the spectrum sensing device, 3) The PSD of all occupied sub-band is smooth and almost flat, 4) The noise is AWGN, i.e., noise process has a flat PSD within the whole observed bandwidth.
Hence, once the region of support is determined, wavelet-based approach will firstly es-timate the PSD of the received signal and determine the number of sub-bands and the corresponding frequency boundaries. Later, the PSD for each sub-band will be employed to determine the vacancy of the estimated sub-bands. As a result, the wavelet based detection is also known as the wavelet based edge detection. Hence, the availability of thekth sub-band can be determined using the
Tk W B = 1 ∩fk− ∩fk−1 ∫ ∩fk ∩fk−1 H1 ≶ H0
λ
W B (2.27)where ∩fk− ∩fk−1 denotes the estimated frequency boundaries of thekth sub-band
ob-tained using the wavelet transform [64, 65]. Based on the above, one of the main advan-tages of the wavelet based detection is that it does not require any prior knowledge about the signals features. However, the most important limitation of this spectrum sensing approach is determining the correct smoothing function (mother wavelet) for the wavelet transformation. Even though some common features are shared by most mother func-tions, some can perform better than others in a given environment. Hence, in order to obtain the best possible results in the wavelet based detection, the specific wavelet family should be designed based on the characteristics of the transmitted signal.
Wigner-Ville Based Detection
The Wigner-Ville based spectrum sensing [66] derives a greyscale image of the time fre-quency description of the received signal through the Wigner-Ville transform, and similar to wavelet based detection with the aid edge detection is able to detect occupied frequency bands.
With the aid of the Wigner-Ville transform, it is possible to show the spectral components of a signal with respect to the time variable and therefore have a bi-dimensional description of the perceived signal [67]. The resulting image from the Wigner-Ville based detection shows the spectrum occupancy in both time and frequency, marking the occupied zones with higher brightness. Hence, such zones are to be avoided by the opportunistic user, who, thanks to an edge detection, is able to detect the vacant sub-bands.
Such two dimensional strategies such as Wigner-Ville and wavelet based detection, tend to improve the performance of the spectrum sensing device with respect to single di-mensional approaches due to the phenomenon known as uncertainty relationship which describes the trade off between the spectral and temporal resolution.
At the final stage, the measured energy level is employed as the slot availability criterion, entailing that slots are considered occupied even when they present high energy even in a narrow spectral and time components. However, these approaches may suffer from noise uncertainty problem, due to use of energy detection.
2.1.7 Summary of The Sub-Band Spectrum Sensing Approaches
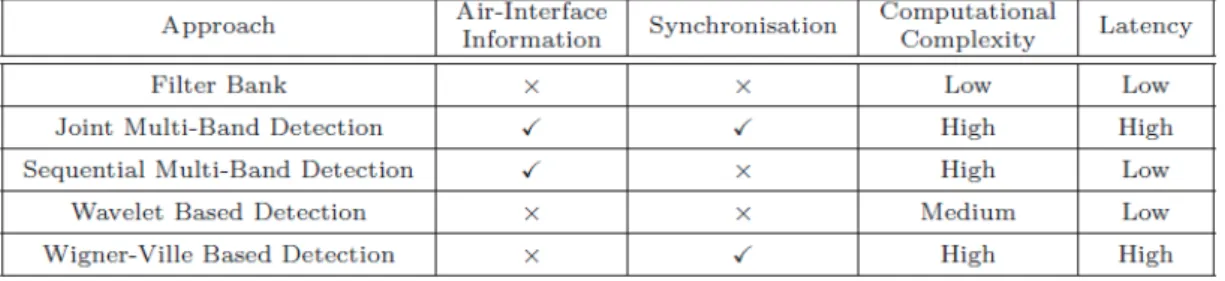
Figure 2.12: Summary of the state-of-the-art local sub-band spectrum sensing approaches.
As explained in this section, different spectrum sensing scenarios demand for different sub-band spectrum sensing approaches based on their requirements. Amongst the
exist-ing practical solutions, there are filter-bank [60] and wavelet [65] based spectrum sensexist-ing techniques. The Filter-bank architecture allows sub-band sensing with the aid of mul-tiple narrow bands, which results in increased number of components and energy con-sumption. However, the filter-bank approach is one of the preferred solutions when the spectrum sensing device does not have any a-priori knowledge about the signaling in-formation. Wavelet based spectrum sensing exploits the multi-resolution features of the wavelet transform to estimate the power spectral density. With the aid of edge detection, the spectrum band of interest is divided into a number of sub-bands. This technique is particularly useful, when there are limited number of non-stationary samples. Fine spec-trum sensing is further required, in order to determine the vacancy of specified frequency subbands. The Wigner-Ville based spectrum sensing [66] derives a greyscale image of the time-frequency description of the received signal through the Wigner-Ville transform. Similar to the wavelet based detection, with the aid of edge detection, it is able to detect occupied frequency bands.
Recently, a multi-band joint detection for spectrum sensing has been introduced in [61], where spectrum sensing is performed through a class of optimization problem with the objective of improving the aggregate opportunistic throughput of the opportunistic spec-trum access user while limiting the interference to the other users in the system. However, this technique requires the knowledge of noise power and the squared values of the channel frequency responses, which makes this approach only practical in fixed wireless networks, i.e., TV broadcast bands. While [62] investigates multi-band spectrum sensing algorithm, which supports quality-of-service traffic. In particular, [62] proposes a sequential sens-ing, where a bank of sequential probability ratio tests are run in parallel to detect the availability of sub-bands, while ensuring a fixed minimum rate for the opportunistic user. This approach is based on the assumption that the propagation channel between the transmitter and the spectrum sensing device is fixed and deterministically known to the opportunistic users, making this multi-band spectrum sensing approach also only suitable for fixed networks.
2.1.8 Summary
Spectrum sensing device needs to continuously monitor the spectrum for possible presence of the vacant frequency bands. In this

![Figure 3.1: Beta density 2.2.2 histogram of idleness probabilities in two different geolo- geolo-cations [11]](https://thumb-us.123doks.com/thumbv2/123dok_us/342466.2537591/64.892.141.779.286.603/figure-beta-density-histogram-idleness-probabilities-different-cations.webp)
![Figure 3.2: Channel idelness probabilities and comparison among the exact distribution, normal approximation, and proposed poisson-normal approximation [11]](https://thumb-us.123doks.com/thumbv2/123dok_us/342466.2537591/65.892.141.779.358.656/channel-idelness-probabilities-comparison-distribution-approximation-proposed-approximation.webp)