Debahutee Rout. What are the Important Information Needs of Faculty, Staff, and Current Students with Regards to the SILS Website? A Master’s Paper for the M.S. in IS degree. May 2017. 82 pages. Advisor: Robert Capra
This research study aimed at studying the SILS website and understanding if the current design catered well to the needs of three user groups; faculty, staff
members, and current students. An online survey questionnaire was created and sent to the listserv of the three user groups.
Out of the 58 responses that were received, 17 were MSIS students, 18 MSLS, 2 BSIS, 5 Faculty, 4 were staff, and the rest chose to remain unidentified.
Participants were asked about their usage, level of satisfaction, level of difficulty, and kinds of issues they faced, their opinions and feedback regarding various sections of the SILS website along with the embedded pages within. The responses suggest that although participants were fairly satisfied with the
website, there were areas that could be improved in the site’s navigation, deeply embedded links, and inconsistent information.
Headings:
User Interfaces (Computer Systems)
Websites -- Use studies
Information needs
Websites -- Design
WHAT ARE THE IMPORTANT INFORMATION NEEDS OF FACULTY, STAFF, AND CURRENT STUDENTS WITH REGARDS TO THE SILS WEBSITE?
By
Debahutee Rout
A Master’s paper submitted to the faculty of the School of Information and Library Science of the University of North Carolina at Chapel Hill
in partial fulfillment of the requirements for the degree of Master of Science in
Information Science.
Chapel Hill, North Carolina
May 2017
Approved by
Table of Contents
1. Introduction ... 2
2. Literature Review ... 5
2.1 Usability and User Centered Design: An Overview ... 5
2.2Usability Metrics ... 7
2.3User Centered Design: ... 8
2.4Focusing on user experience: ... 9
2.5 Finding out what the user needs: ... 10
3. Purpose and Goals of Study: ... 13
3.1 Methodology ... 14
4. Results ... 18
4.1 Level of Satisfaction: ... 18
4.2 General Discussion about the sections ... 23
4.2.1 Programs section: ... 23
4.2.2Courses section: ... 24
4.2.3 People section: ... 25
4.2.4 Research section: ... 26
4.2.5 Careers section: ... 26
4.2.6 Information for Future Students section: ... 27
4.2.7 Information for Current Students section: ... 27
4.2.8 Information for Faculty and Staff and Alumni section: ... 28
4.3 Difficulty level with sections of the website ... 28
4.4 Frequently used sub-pages ... 34
4.5 SILS website vs asking a friend/colleague/staff ... 40
5. Analysis and Discussion ... 42
6. Conclusion ... 44
7. Bibliography ... 45
1. Introduction
Technology has permeated the world around us, making itself obvious almost in
all the everyday gadgets and appliances we use; right from starting our day by
turning on the coffee maker to using the cell phone to accessing a website for
some information need, we are surrounded by interfaces that we have to maneuver
through in order to get our work done. Since this embedded form of technology is
something that is involved in our day to day lives, it becomes highly imperative to
design interfaces that are easy to understand, are engaging, and enable the user
to achieve his/her task in an efficient and speedy manner. How well a product is
designed for usage be it from the user or the manufacturer point of view is reliant
on various factors like “functionality, performance, cost, reliability, performance,
maintenance, and usability” and each of these affect its success to various
degrees. (Mayhew,1999, pg.147). Since the involvement of user interfaces in our
daily lives continues to gain more and more importance, the US Committee to
Assess the Scope and Direction of Computer Science and Technology of the
National Research Council enlists user interfaces as one of the core subfields for
applications like global change research, computational biology, commercial
computing, and electronic libraries. (Hartmanis,1992). In his article, User Interface
People nowadays seek to invest less time in learning to use a product,
easy-to-use interfaces are more cost-efficient and less time-consuming, and the need to
produce user-oriented products is of critical importance. (Reiterer, 1997).
Unfortunately, the design of modern day objects that surround us in our daily life
is not always instinctual and user friendly. Many times, users find it difficult to
understand and operate machines around them leading to a sense of frustration
and a defeating mindset of not-having-been-able-to-figure-out how to make things
work. A system or service has to be effective functionally and the world around us
lays emphasis on the ‘satisfaction’ of human user(s) as an index to measure the
potential of a service/product. Many times, while developing user-centric
interfaces, the technical perspective of development and production override the
“organizational and social consequences” (Reiterer, 1997, pg.201) which results
in a failure to reach the ultimate goal i.e. satisfy the user, resulting in various
negative consequences with respect to businesses and individuals alike. (Reiterer
,1997). With the presence of technology in almost every sphere of our lives, an
ongoing issue that we face is the perennial gap between the product features that
are built in and the essential needs and expectations of the user groups. In a world
of information overload the most effective solution to bridge the gap between users
and implemented technology would thus be to build interfaces around the needs
and task goals of its intended users.
Effectively implemented in almost all technology fields now, the approach of “user
and services are designed to work around the platforms on which they are
originally based. According to Endsley (2016) working for the end user is a “design
philosophy” that shapes the interface around the capacities and perspectives of
the target audience (pg.7). This method culminates in the most effective
functioning of services that are meant for human operability and is a productive
way of using production and technology for making human interactions with
machines easier. The user-interface design method as Endsley states is the
consequence of a right balance of human efforts and application functionality. In
the end, users will always have different opinions regarding individual websites, be
it the font, position of images, color or aesthetic appeal, but what matters most is
how well does it connect the user to his/her information needs; in other words, how
does a site fare with respect to its usability. (Stone et al., 2005).
For the purpose of this research study the School of Information and Library
Science website was used in order to study how efficient and effective the interface
2. Literature Review
2.1 Usability and User Centered Design: An Overview
The International Standard Organization (ISO) and International Electrotechnical
Commission (IEC) have outlined a set of standard procedures and guidelines for
human-computer interaction and usability. Usability under ISO 9241 Part 11 is
defined as "-the extent to which a product can be used by specified users to
achieve specified goals with effectiveness, efficiency and satisfaction in a specified
context of use.” (ISO 9241-11:1998, section “Definitions”). ISO 9241-11 outlines
guidelines to be adhered to during the course of a usability evaluation in order to
measure the usability of a website. The term “usability” has such vast a scope with
regards to the functionality of a product that it can encompass a broad range of
factors under its umbrella. In short, the usage of the term itself is very contextual.
For a site to be easy-to-use could depend on a multitude of factors starting from
the basic presentation of blocks, to navigation, font, colors, etc. The guideline
features that concern any standard usability evaluation would depend on how well
and satisfying the product/service usage can be, the development concerns and
standardized procedures, its presentation and connection with any user,
and how well can the user-oriented approach be adapted by concerned
13407 (Human centered design process for interactive systems) define terms for
representational details in terms of design objectives for interactive systems. The
guidelines tend to focus on quality of use by discussing usability concerns in
interactive systems, all geared towards a user-centered design approach.
In his book “The Psychology of Everyday Things” author Don Norman mentions
four principles that form the basis of designing a site, in order to make it
user-friendly:
“Make it easy to determine what actions are possible at any moment.
Make things visible, including the conceptual model of the system,
the alternative actions, and the results of actions.
Make it easy to evaluate the current state of the system.
Follow natural mappings between intentions and the required
actions; between actions and the resulting effect; and between the
information that is visible and the interpretation of the system state.”
(Norman, 1988, pg. 188)
In his article “Usability Engineering Life Cycle”, J.Nielsen showcases a usability
engineering model that represents factors like “considering the larger context,
knowing the user, competitive analysis, setting usability goals, participatory
design, prototyping, empirical testing, iterative design, and collect feedback from
field use” (Nielsen,1992, pg.13). The process starts with identifying the target
audience for the specific product or service and remaining cognizant about the
scope of tasks. This is supposed to be the predesign step. Knowing the
how they evolve with their needs is an integral part of the predesign stage along
with setting appropriate task oriented goals and competitive analysis of prototypes.
During the design phase, usable design details are approved and agreed upon
and a workable prototype developed that caters to variable user tasks. A list of
usability heuristics should be adhered to with respect to the overall interfaces
involved, as well as designs that are system specific and product specific. The
post-design step involves conducting follow-up studies regarding the service and
its usability leading to a practical real-life approach to the usability of the product.
(Nielsen,1992). Moreover, as users gradually become an integral part of the
development process, the concept of usability evaluation has started being
measured on different scales like the system usability scale (SUS), the software
usability measurement inventory scale (SUMI), or the Questionnaire for User Interaction Satisfaction (QUIS) which is “designed to assess users' subjective satisfaction with specific aspects of the human-computer interface.” (University of
Maryland, para1)
2.2 Usability Metrics
ISO 9241-11 clearly defines taking “effectiveness, efficiency, and satisfaction in a
specified context of use” to measure the usability of a product. (ISO 9241-11:1998,
section “Definitions”). It discusses about measuring the performance of the user
and their satisfaction to analyze how the any given component of a system can
the participant’s minds to analyze the effectiveness, efficiency, and satisfaction for
the SILS website and how well it catered to each user’s information needs.
2.3 User Centered Design:
The term “user-centered design” was first coined by Don Norman, author of the
book The Design of Everyday Things. (Norman, 1988, pg.188) User centered
design (UCD) is a broad doctrine encompassing a multitude of rationale. It is key
to the creation of usable information services, products, and systems that are
centered around the user’s existing knowledge, skills, behavior, and attitude in
context to the tasks or actions that the system in question is supposed to support.
The approach involves keeping the user at the center of the design approach and
building the design and developing the product, all around the user’s needs, their
understanding and limitations. Eventually user experience is all about what
experience one has while interacting with a service or product and not about how
it works internally (Garrett, 2010). The user feedback loop that is involved in every
step of the design process is a hallmark of this system where stress is laid on
adapting the machine/service design to the end user’s perspectives rather than
working around people to accommodate the system or function. This in turn leads
to lower development costs, increased sales, improved user productivity and user
loyalty, and supports savings for the product/service company (Garrett, 2010).
“User centered design does not mean asking users what they want and then giving
it to them”. (Endsley, 2016, pg.7). In his book “Designing for Situation Awareness:
seem a plausible move, often times users are not so clear about better
options/solutions that might be implemented over the existing ones. In almost all
technological sectors there exist a very broad spectrum of users of different
backgrounds having different ideas for better solutions to make the system more
user friendly; paying attention to such ideas would result in an unending spiral of
new developmental costs to implement solutions that just might not sit right with
the next set of users (Endsley, 2016). This kind of approach would not help sift the
good ideas from the bad and would lead to misleading interpretations.
2.4 Focusing on user experience:
According to usabilityfirst.com website, User Experience design is defined as
“conducting user research exercises with intended users of a system. User
research reveals users’ needs and preferences through user observations,
one-on-one interviews, and creative activities that encourage users to express their
emotions, motivations, and underlying concepts and beliefs about the steps
involved in task procedures” (usabilityfirst.com, section What is User Experience
Design) Hence, user experience designers need to understand what exactly
‘usability’ revolves around. In his article on Introduction to Usability, Nielsen (2012)
states that usability is defined by five components namely: learnability, efficiency,
memorability, errors, and satisfaction.
“Learnability: How easy is it for users to accomplish basic tasks the first time
Efficiency: Once users have learned the design, how quickly can they
perform tasks?
Memorability: When users return to the design after a period of not using it,
how easily can they reestablish proficiency?
Errors: How many errors do users make, how severe are these errors, and
how easily can they recover from the errors?
Satisfaction: How pleasant is it to use the design?” (Nielsen,2012, section
What- Definition of Usability)
Once the design team comes in direct contact with potential users, user
experienced design principles involve the use of “simulations and prototypes” for
evaluating a product and the experience being analyzed and recorded for future
use. (Kujala, 2002, pg.11)
2.5 Finding out what the user needs:
Forlizzi & Battarbe’s approach revolving around “types of user-product interactions
and types of experience” (Forlizzi & Battarbe 2004, pg. 263) in line with the five
components of usability as discussed above, would serve as positive guidelines to
keep the user’s needs at the forefront of any design idea. Under the aegis of user
experience, interaction designers along with human computer interaction
researchers have studied in-depth about the basic train of thoughts and affective
processes that govern the human mind and make any human-technology
design interactive products we have to put ‘experience’ before the product itself.
Since emotions hold the core to experiences, they work in close correlation with
“cognition, motivation, and action” that further lays down the basis for intellectual
and effective functionality. (Hassenzahl, 2010, pg. 3)
It has been studied and well-articulated in the field of human computer interaction,
through the study of different approaches to user experience design models that
the fulfillment of a user’s needs correlates to a positive experience. For every
device / service that is produced in the human world, there would be user(s) to
operate / use it and the said device / service would then make the user(s) feel
something (good / bad / confused / frustrated / annoyed / neutral) about using it
and it is this experience that any designer should use as a benchmark while
conceptualizing the aspects of a product. Nielsen (2012) points out that testing
with a small group or number of users (generally 5) can help identify large usability
issues. Using a small group of targeted users can be a fruitful way of identifying
usability issues. According to Nielsen, although “focus groups” are crucial enough
for market research, they should not be considered as a wholesome means to test
user design. Instead of focus groups, emphasis should be laid on individual user
experience and studying user behaviors instead of just “listening to what people
say” (Nielsen, 2012, section How to improve Usability).
There can be various modes of user involvement ranging from being informative,
consultative, to participative (Kujala 2008, section Forms of user involvement).
Since users form or should form an integral key to the design process, their
principles that a website follows should provide clarity on the ultimate goals and
objectives. Damodaran (1996) emphasizes on an integrated collaborative and
strategic approach for participatory design where she stresses that users need to
be aware of the principles that form the basis for processes that they help
influence. Users are involved in the design process at some point of time or the
other while designing a system and the difference lies in the extent to which users
can influence the design decisions. In a participatory design, there is an active
involvement of the stakeholders and end users, where participants bring their
perspective to the table and aid in designing solutions based on user needs and
preferences (Damodaran,1996). She mentions that active, “effective participation”
is key to improving the design process and that passive “rubber stamp”
participation is not sufficient (Damodaran,1996, pg.365). Finding a proper
balanced approach to fulfilling human and organizational needs is the key to a
successful design system. Kujala states that for an organization it is not possible
to cater to all individual needs considering the broad spectrum of ideas and thought
processes and principles each user (group) conforms to, and hence the needs
must be “analyzed, prioritized, and described” after discovery and documented
properly (Kujala, 2002, pg.17). Many study methods have been documented for
studying and analyzing user needs; these include cognitive walkthroughs,
observing while certain tasks are assigned, story-telling, thinking aloud, and
3. Purpose and Goals of Study:
The SILS website is accessed by the school’s students, faculty, staff, and alumni
on a frequent basis. It is probably the most depended upon source for the
information needs of these users. In general, when a website pertains to one’s
everyday educational needs, users tend to learn and grow around the site and tend
to maneuver through their own ‘discovered’ navigational pathways as familiarity
with the individual pages creep in.
This study was carried out was an effort to understand how well the SILS website
caters to the needs of three user groups namely, faculty, staff, and students. The
study took into consideration the main pages of the website (the ones that appear
on the landing page of the website) and asked users about their experience with
each of those pages. The overall goal was to understand what aspects of the
pages were the users in general satisfied with, and what aspects had gaps
between the information provided versus a user’s needs. Through the
multiple-choice survey questions that were framed, an effort was made to understand what
exactly were the needs of these three user groups and how well did the SILS
website meet those needs.
The results/ feedback was then collated and compiled into broad categories of
a tool for referencing if the website is taken up for a redesign. For this study, the
alumni base was excluded since the user group was presumed to be accessing
the website on a less frequent basis than the other three user groups (current
students, faculty, and staff).
3.1 Methodology
The method used to collect data for this research was through an online survey
questionnaire. There are many advantages to being able to gather data online, it
makes the survey reach the intended participants faster, gives access to
participants who might be in a different geographical location or might be difficult
to reach out to, gives the participants the liberty to take the survey at a location
and time of their choice, involves minimal costs, and makes data collation much
easier for the researcher. The disadvantages for using online surveys include that
potential participants may ignore or overlook the e-mail sent with the survey link.
Moreover, the “design, implementation, and evaluation” of such web surveys could
be a concern with respect to how it is created. (Wright, 2005, section Introduction).
Despite the issues involved, online surveys have been adopted by researchers
worldwide and they have been employed in diverse areas.(Wright, 2005).
The research involved sending a recruitment email to the listserv email ids of
current students, faculty members, and staff. The email stated the goal of the
survey, provided participation requirements, and had an attached anonymized link
to an online Qualtrics survey questionnaire (survey questionnaire attached in
no remuneration was provided for participating in the survey. A reminder email was
sent three days after the original email to participate in the survey. Since this was
an online survey, participants were free to take the survey at any location and time
of their choice. Moreover, the use of an online system provided advantage of
automated collection and analysis of acquired data that reduces human error. The
survey questionnaire was designed in a manner so that all participants would
remain anonymized and no personal information would be collected in the survey.
Additionally, participants were advised against putting in any self-identifiable
information in the survey form.
The survey comprised of questions that revolved around the main navigational
links of the SILS website (these were the links that are presented on the landing
page of the website). For each of the main sections of the SILS website (Programs,
Courses, People, Research, Careers, Information for Future Students, Information
for Current Students, Information for Faculty and Staff, and Information for Alumni)
participants were asked the following questions:
1. Section-use frequency: How frequently do you use or access
information in this section of the website? (everyday, several times a
week, several times a month, occasionally, or never).
If participants chose ‘never’ for a section, questions for that section
2. Sub-section use: Under <name of section> which parts do you use
most frequently? (Check boxes to indicate which sub-parts of that
section they used frequently)
3. Satisfaction: How well are your needs met as far as the <name of
section> is concerned? (scale of 0-10, where 0=not at all, 5=neutral,
and 10=extremely well)
4. Difficulty: How difficult is it for you as a user to conduct tasks in the
<name of the section> section? (scale of 0-10, where 0=extremely
difficult, 5=neutral, 10=extremely easy)
5. Ways-used: If you use the <name of section> section, please use the
space below to briefly describe the primary ways in which you use this
section. (free-response)
6. Issues: Please use the space below to describe issues you have
encountered or suggestions that you have about the <name of
section> section and the information contained in it. (free-response)
At the very end of the survey, a final question was asked if users were more
inclined to ask a friend/colleague/staff member for an answer to their
information needs rather than taking time to find the answers from the
The survey was a combination of multiple-choice questions as well as open-ended
questions. This gave the users liberty to express the issues they faced in their
requirements from the website as well as provide feedback or solutions that they
thought would be appropriate in order to make the site’s interface more
user-friendly. The overall structure of the questions was made in an effort to delve and
4. Results
A total of 58 responses were received, out of which 17 were MSIS students, 18
MSLS, 2 BSIS, 5 Faculty, 4 staff, and the rest chose to remain unidentified. The
responses for the survey were compiled and collated, with respect to six groups
(MSIS, MSLS, BSIS, Faculty, Staff and not identified). Participants were asked
about their usage, level of satisfaction, level of difficulty, and kinds of issues they
faced, their opinions and feedback regarding various pages of the SILS website
along with the embedded pages within. The main navigational links listed on the
SILS website landing page (Programs, Courses, People, Research, Career,
Information for Future Students, Information for Current Students, Information for
Faculty and Staff, and Information for Alumni) were the ones particularly
addressed.
4.1 Level of Satisfaction:
For each main section of the website, the survey asked about how well
participants’ needs are met by that section on a scale of 0 to 10 (where 0= not at
all and 10= extremely well). These will be referred to as the satisfaction ratings.
Fig 1.1: Ratings for the level of satisfaction for the Programs section as given by the six groups.
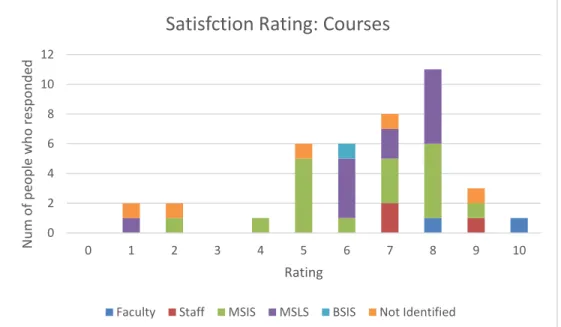
Fig 1.2:Ratings for the level of satisfaction for the Courses section as given by the six groups
0 2 4 6 8 10 12
0 1 2 3 4 5 6 7 8 9 10
N u m o f p eo p le w h o r es p o n d ed Rating
Satisfaction Rating: Programs
Faculty Staff MSIS MSLS BSIS Not Identified
0 2 4 6 8 10 12
0 1 2 3 4 5 6 7 8 9 10
N u m o f p eo p le w h o r es p o n d ed Rating
Satisfction Rating: Courses
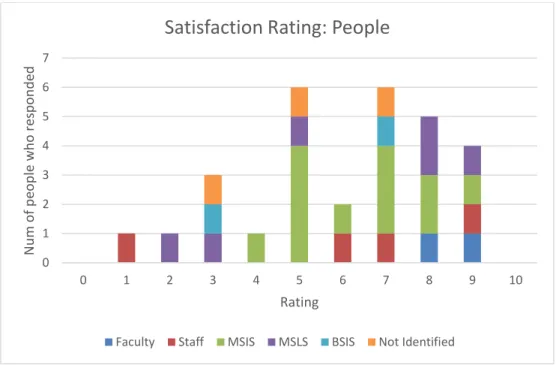
Fig 1.3: Ratings for the level of satisfaction for the People section as given by the six groups.
Fig 1.4: Ratings for the level of satisfaction for the Research section as given by the six groups.
0 1 2 3 4 5 6 7
0 1 2 3 4 5 6 7 8 9 10
N u m o f p eo p le w h o r es p o n d ed Rating
Satisfaction Rating: People
Faculty Staff MSIS MSLS BSIS Not Identified
0 1 2 3 4
0 1 2 3 4 5 6 7 8 9 10
N u m o f p eo p le w h o r es p o n d ed Rating
Satisfaction Rating: Research
Fig 1.5: Ratings for the level of satisfaction for the Careers section as given by the six groups.
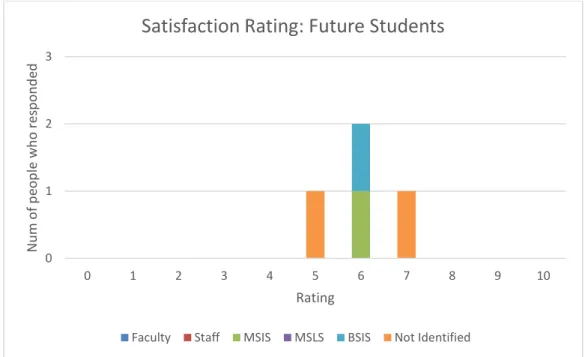
Fig 1.6: Ratings for the level of satisfaction for the Information for Future Students section as given by the six groups.
0 1 2 3 4 5
0 1 2 3 4 5 6 7 8 9 10
N u m o f p eo p le w h o r es p o n d ed Rating
Satisfaction Rating: Careers
Faculty Staff MSIS MSLS BSIS Not Identified
0 1 2 3
0 1 2 3 4 5 6 7 8 9 10
N u m o f p eo p le w h o r es p o n d ed Rating
Satisfaction Rating: Future Students
Fig 1.7: Ratings for the level of satisfaction for the Information for Current Students section as given by the six groups.
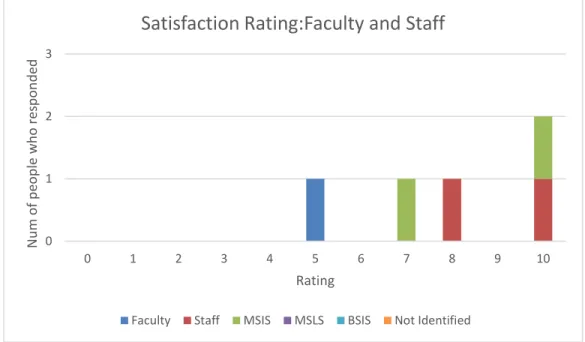
Fig 1.8: Ratings for the level of satisfaction for the Information for Faculty and Staff section as given by the six groups.
0 1 2 3 4
0 1 2 3 4 5 6 7 8 9 10
N u m o f p eo p le w h o r es p o n d ed Rating
Satisfaction Rating: Current Students
Faculty Staff MSIS MSLS BSIS Not Identified
0 1 2 3
0 1 2 3 4 5 6 7 8 9 10
N u m o f p eo p le w h o r es p o n d ed Rating
Satisfaction Rating:Faculty and Staff
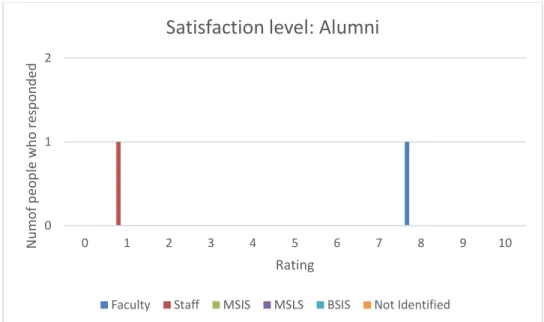
Fig 1.9: Ratings for the level of satisfaction for the Information for Alumni section as given by the six groups
4.2 General Discussion about the sections
4.2.1 Programs section:
A close look at Fig1.1 indicates that the “Programs” section received an average
rating of 5.8 indicating that overall there was a neutral response for satisfaction.
Based on responses to the Ways Used question, the commonly mentioned uses
were going through program requirements and course planning followed by
certificate programs and financial information. Faculty members cited using it for
deadlines, program requirements and alumni profiles, whereas staff mentioned
program donor/alumni communications, and course selection along with program
requirements. Analysis of the Issues free response question indicated that the
main issues participants faced for the programs page dealt with navigation (9 out
of 26 responses received) and too much of cluttered content. Another major issue 0
1 2
0 1 2 3 4 5 6 7 8 9 10
N u m o f p eo p le w h o r es p o n d ed Rating
Satisfaction level: Alumni
reported was the desired information being embedded deep inside links thereby
increasing the number of clicks. Students seemed to want more help with the
specialization page remarking that they needed more clarity on its content. Another
interesting aspect that a few students mentioned was asking to divide classes
according to specializations, which would help them in their decision making
process. A few mentioned about the financial information content needing
improvement.
4.2.2 Courses section:
The “Courses” page had an average satisfaction rating of 6.4 suggesting that
people seemed a bit more on the satisfied side rather than having a dificult time
with it. Out of the 29 students who responded, 10 gave a rating of 8, which seems
to be a favorable response for how well their needs were met with respect to the
courses page. The primary reason for usage, as found out from the question about
Ways Used, revealed that the participants primarily used the courses page to look
up future and current courses and scheduling. Other needs included looking up
archives and planning courses accordingly. One staff member mentioned using it
“to answer phone questions and for research on classes taught in past” while
another used it to schedule meetings by loooking up who is teaching when, and to
check room availability by looking at class timings. Issues that were mentioned
about the courses page involved the organization of page content and needing
improvements to the information. Some students mentioned about a mismatch
course descriptions, and posing concerns about the long scrolling format of
courses that makes viewing and constructing a semester difficult. A MSIS student
responded “as I scroll up and down the offerings, sometimes I forget if I'm looking
at the MW or TH grid because the chart is so long”. This interface problem seems
to pop up in quite a few responses indirectly and a look into a more user friendly
tabular format might help resolve the issue. Suggestions from faculty members
included organizing a database with classes that would allow users to interact, plan
schedules, review class conflicts, and to organize classes listed by number and
section and cite when they are offered.
4.2.3 People section:
The “People” section got an average satisfaction rating of 6.06. The highest rating
for this section was 6 given mainly by MSIS students. The main usage for this
section (from the question about Ways Used) was finding contact information of
people followed by getting information about the research areas of faculty
members. Interestingly, a few students mentioned that they visit the People page
to find pictures of faculty and place a face to a name. The sub-pages of Boards &
Committees, Alumni Profiles, and Alumni and Friends were also visited by staff
from the People’s page. Out of the total 17 responses received for the Issues
question, 4 participants said they had no problems while handling tasks while 6
reported that the page had unorganized content and inconsistent information. One
student mentioned facing problems with the Student Organizations link citing that
tell what year the officers are in place for or what year I'm even looking at”.
Participants in this category gave a few suggestions that include introducing a brief
bio of faculty, adjunct faculty, and PhD students that mentions their research
interests, educational background, and classes they have been teaching. Some
other suggestions include setting up a database that matches the user to people
with specific matching interest areas/interests to help current students find people
with expertise that they need and could also help prospective students gauge the
strength of the School in different fields.
4.2.4 Research section:
The ‘Research’ page had an average satisfaction rating of 4.4 but the overall
number of responses was low. Only 11 people gave their response out of which 4
were not students. Participants mentioned (for the Ways Used question) that they
used it for general information, research grants and information. One faculty
member stated that the research needs/options should be presented in a more
interactive manner to users while a staff input stated that research areas should
be tied to specific faculty and academic program options. Some participants
remarked that the information given was outdated.
4.2.5 Careers section:
The ‘Careers’ section had an average satisfaction rating of 5.5. For this section,
21 participants responded to the question of Sub-Section use under the Careers
employment sub-page. The two other sub-pages most frequented was Field
Experience and Internships. Primary usages for the Careers section (for the Ways
Used question) involved Internships, scouring through job lists, seeking
employment opportunities, and field experience. Issues that were captured ranged
from some students citing that MSIS job resources were less as compared to
library science related jobs, inconsistent information regarding the internships,
terms like ‘SILS Job List’, ‘Student Jobs’ and ‘Internships’ being confusing, and the
term ‘Internship form’ being misleading, since it is about submitting a work
experience rather than leading to apply for work.
4.2.6 Information for Future Students section:
Only 4 participants responded for the “Information for Future Students” section.
Program information and donor/alumni communications were listed as the primary
ways of using the section. Although the number of responses was low, some
issues that were mentioned involved too much text on the page, and a few students
wanted something more visual on the page.
4.2.7 Information for Current Students section:
For the “Information for Current Students” the average rating was 6.2, and the
usage included accessing resources, advising, financial information, health
insurance, e-mail lists, accessing degree requirements, and student organizations.
Some of the issues that the participants pointed out were about too much content
being missing from the content. Another interesting observation made by a student
was that if a user missed out on the section’s navigation link on the home page,
there is no way to go the page unless one starts over from the home page.
4.2.8 Information for Faculty and Staff and Alumni section:
The survey got few responses for the Information for Faculty and Staff and
Information for Alumni sections. Five participants responded for how well their
needs were met for the Faculty and Staff section and only two responded for the
alumni satisfaction section. One participant mentioned that he/she used the
Faculty and Staff page to find a Faculty Advisor while another commented that the
Information for Faculty and Staff page shouldn’t be on the home page, since it
caters to a small internal group of people. One of the comments on the alumni
page was the content wasn’t up-to-date.
4.3 Difficulty level with sections of the website
The next group of graphs show the participants’ responses to the question about
the difficulty level of conducting tasks with respect to each of the nine main sections
of the SILS website that the survey dealt with. Zero indicates extremely difficult
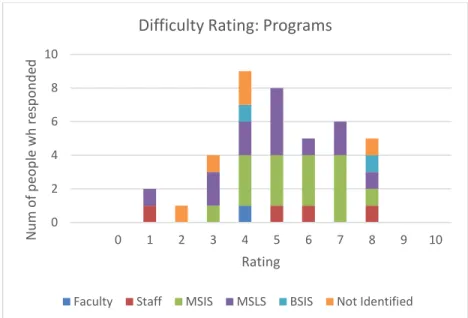
Fig 2.1: Ratings for the level of difficulty for the Programs section as given by the six groups.
Fig 2.2: Ratings for the level of difficulty for the Courses section as given by the six groups.
0 2 4 6 8 10
0 1 2 3 4 5 6 7 8 9 10
N u m o f p eo p le w h r es p o n d ed Rating
Difficulty Rating: Programs
Faculty Staff MSIS MSLS BSIS Not Identified
0 2 4 6 8 10
0 1 2 3 4 5 6 7 8 9 10
N u m o f p eo p le w h o r es p o n d ed Rating Difficulty Rating: Courses
Fig 2.3: Ratings for the level of difficulty for the People section as given by the six groups.
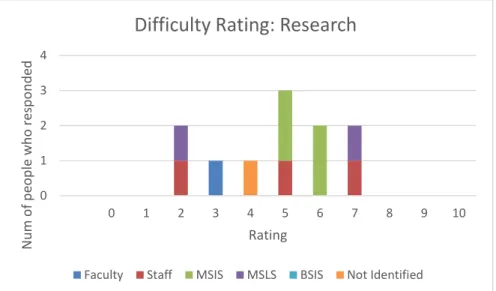
Fig 2.4: Ratings for the level of difficulty for the Research section as given by the six groups.
0 1 2 3 4 5 6 7
0 1 2 3 4 5 6 7 8 9 10
N u m f p eo p le w h o r es p o n d ed Rating
Difficult Rating: People
Faculty Staff MSIS MSLS BSIS Not Identified
0 1 2 3 4
0 1 2 3 4 5 6 7 8 9 10
N u m o f p eo p le w h o r es p o n d ed Rating
Difficulty Rating: Research
Fig 2.5: Ratings for the level of difficulty for the Careers section as given by the six groups.
Fig 2.6: Ratings for the level of difficulty for the Information for Future Students section as given by the six groups.
0 1 2 3 4 5 6
0 1 2 3 4 5 6 7 8 9 10
N u m o f p eop le w h o re sp on d ed Rating
Difficulty Rating: Careers
Faculty Staff MSIS MSLS BSIS Not Identified
0 1 2 3 4
0 1 2 3 4 5 6 7 8 9 10
N u m o f p eo p le w h o r es p o n d ed Rating
Difficulty Rating: Future Students
Fig 2.7: Ratings for the level of difficulty for the Information for Current Students section as given by the six groups.
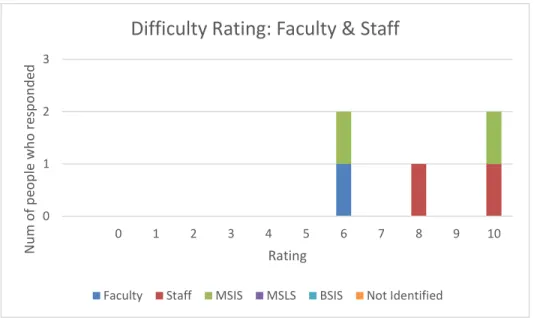
Fig 2.8: Ratings for the level of difficulty for the Information for Faculty and Staff section as given by the six groups.
0 1 2 3 4 5
0 1 2 3 4 5 6 7 8 9 10
N u m o f p eop le w o re sp on d ed Rating
Difficulty Rating: Current Students
Faculty Staff MSIS MSLS BSIS Not Identified
0 1 2 3
0 1 2 3 4 5 6 7 8 9 10
N u m o f p eo p le w h o r es p o n d ed Rating
Difficulty Rating: Faculty & Staff
Fig 2.9: Ratings for the level of difficulty for the Information for Alumni section as given by the six groups.
For the Programs section with respect to the level of difficulty, 15 MSIS and 13
MSLS students gave responses. Overall the responses favored more towards the
5-7 rating, indicating that most students were able to carry out their tasks with
some ease. Staff member’s ratings were within the 5-6 range and there was one
response from a faculty member who gave a rating of 4. The average difficulty
rating for the Courses section was 6 which again indicated that although there
could be room for improvement, participants were comfortable to some extent
while working on their information needs. The responses for the People section
were scattered all over the rating scale, ranging from 2-10, and the average
difficulty rating was calculated to be 6. Only 10 respondents answered the question
on the Research section and the responses were mixed ranging from 2-7. The
Careers section also had mixed ratings as far as difficulty was concerned. Out of
the 9 MSIS students who responded, 3 gave a rating of 5, suggesting that work 0
1 2
0 1 2 3 4 5 6 7 8 9 10
N u m o f p eo p le w h o r es p o n d ed Rating
Difficulty Rating: Alumni
could be done to provide more clarity of content for the users. 3 MSIS students
gave a rating of less than 5 and another 3 students gave a rating of more than 5
as depicted in Fig.2.5. There wasn’t much data received on the Information for
Future Students section. The Information on Current Students sections had a total
of 16 responses for the difficulty level that averaged out at a difficulty rating of 5.8.
The number of responses for the Faculty and Staff section and Alumni section
were both very low.
4.4 Frequently used sub-pages
The survey asked participants about which sub-pages under Programs, Courses,
People, Research, Careers, Information for Future Students, Information for
Current Students, Information for Faculty and Staff, and Information for Alumni
sections did the participants use the most for their information needs. The following
graphs show the various sub-pages listed under the main sections and how
frequently they were accessed.
Fig 3.1: Most frequently visited links under Programs section
0 5 10 15 20 25 N u m o f p eo p le w h o r es p o n d ed Web Pages
Frequently visited page: Programs
Fig 3.2: Most frequently visited links under Courses section
Fig 3.3: Most frequently visited links under People section
0 1 2 3 4 5 6 7 8 9 Parts Current Semester
Future Semester Old Semesters Special Topics
N u m o f p eo p le w h o r es p o n d ed Webpages
Frequently visited pages:Courses
Faculty Staff MSIS MSLS BSIS Not Identified
0 5 10 15 20 25 30 N u m o f p eo p le w h o r es p o n d ed Web Pages
Frequently visited pages: People
Fig 3.4: Most frequently visited links under Research section
Fig 3.5: Most frequently visited links under Careers section
0 1 2 3 4 5 6 Grants & Awards
Projects Centers & Labs Faculty Research Reports & Student Research N u m of p eo p le w h o resp on d ed WebPages
Frequently visited pages:Research
Faculty Staff MSIS MSLS BSIS Not Identified
0 2 4 6 8 10 12 14 16 N u m o f p eo p le w h o r es p o n d ed Web Pages
Frequently visited pages:Careers
Fig 3.6: Most frequently visited links under Information for Future Students section
Fig 3.7: Most frequently visited links under Information for Current Students section
0 1 2 3 N u m o f p eo le w h o r es p o n d ed Web pages
Frequently Visited Pages:Future Students
Faculty Staff MSIS MSLS BSIS Not Identified
0 1 2 3 4 5 6 7 N u m o f p eo p le w h o r es p o n d ed Web Pages
Frequently visited pages: Current Students
Fig 3.8: Most frequently visited links under Information for Faculty & Staff section
Fig 3.9: Most frequently visited links under Information for Alumni section
The above graphs represent participants’ responses to the questions on the survey
that asked about which pages in each section they used most frequently. The
participants responded to these questions using a checkbox to indicate which
sub-pages under each section they frequented most. The most used sub-pages for MSIS 0 0.51 1.52 2.53 3.54 4.5 N u m o f p eo p le w h o r es p o n d ed Web pages
Frequently visited pages: Faculty & Staff
Faculty Staff MSIS MSLS BSIS Not Identified
0 1 2 3
Alumni Board Stay Connected Awards +
Scholarships N u m o f p eo p le w h o r es p o n d ed Web Pages
Frequently visited pages: Alumni
and MSLS students in the Programs section were the MSIS and MSLS program
sub-pages. Following these two was the Certificate Programs sub-page. Field
Experience and Archives & Records Management Concentration sub-pages came
after Certificate Programs and received the same number of responses. Under the
Courses section, the main pages that were accessed were Future Semester and
Current Semester. It can be seen from Fig 3.2 that the usage of the Future
Semester subpage was much higher than the other sub- pages. For the People
section, the Faculty sub-page was the most frequented one, followed by Adjunct
Faculty and then Student organizations. Both Staff and PhD received the same
number of responses. Not many responses were recorded for Research page and
it seems that the most frequently used pages are Faculty Research followed by
Centers & Labs and the Reports and Student Research sub-pages. The Careers
section as depicted in Fig 3.5, shows the SILS Job List page to be the most
frequently visited page. Other frequently visited sub-links were Employment, Field
Experience and Internships in that order. Out of the 21 responses received, one
was from a faculty and one from staff, and the other 19 were students indicating
that the Careers section is more frequently used by students. Under the section
Information for Future students, the response was low. The Information for Current
students received the most responses from MSIS students (8 out of 14). In this
section, the Master’s Students page was noted as the most frequented page along
with SILS Library, followed by Student Organizations and Advising. Similar to the
previous assessment responses, the sections Information for Faculty & Staff, and
4.5 SILS website vs asking a friend/colleague/staff
In order to gauge the participant’s attitudes with respect to the SILS website, the
survey posed a question that asked whether the participant would turn to a
friend/colleague/staff first to find the answer for an information need or if they would
first browse the SILS website for answers. The exact wording of the question is
shown below:
When you need to find some information regarding SILS, when would you pose
your question to a person (a friend, colleague, staff, or faculty) rather than look for
the information on the SILS website? If so, why, and what suggestions would you
possibly give for the website to be more helpful and user friendly?
The question got 28 responses out of which 16 stated that they would turn to a
person for answer first, 6 stated that they would first look things up on the website,
4 remarked that it depends on the type of information need, and 2 did not have a
clear answer as to whose help to take first. Out of the 6 responses from staff and
faculty all except one mentioned that they would first ask a friend or colleague for
a quick response instead of trying to scour through the web pages. Most of the
concern regarding the website seemed to be that the content is confusing for one
to be able to find answers within a few clicks. An MS student mentioned that they
looked outdated and that it took a lot of navigation to find information that they
thought should be more prominent. Yet another student noted that for some
information needs, asking friends was a quick way to get insights from a trusted
source.
Five participants mentioned that if they needed basic information, they would use
the website, but in case of more detailed or important information on topics like
faculty members or specializations, they would ask a known person. Three
participants mentioned that friends come into play when they seek opinion on
classes and instructors. A few even mentioned contacting SILS administrative
staff for quick responses rather than searching for information on the site. The
most common concerns from the respondents seemed to be the need for a more
robust structure of the website that would make it more interactive and
5. Analysis and Discussion
The survey discussed the website under the broad ground of nine sections
namely Programs, Courses, People, Research, Career, Information for Future
Students, Information for Current Students, Information for Faculty and Staff,
and Information for Alumni. Participants were asked about different aspects of
these sections. The types of response and response rate varied to a great
extent for each individual section. The SILS website caters to a wide variety
of needs of a diverse population. It provides information for undergraduates,
graduates, and doctoral students, and delivers to the needs of faculty, staff
and alumni as well. Organizing such massive amount of data to the
satisfaction of all varied user groups can present significant challenges. The
results indicate that for many of the sections, the satisfaction ratings were
neutral or slightly above it. This suggests that while these sections may be
acceptable, there is ample scope for improvement. The given feedback could
be analyzed in detail and steps taken to bridge the gap between user needs
and services the site currently offers. From an overall look at all responses, it
can be derived that there weren’t any sharp differences between the issues
noted by both MSIS and MSLS students. For example, both user groups
with respect to navigation, information consistency, and the organization of
content.
Working through the survey responses, one can notice that participants
(especially students) mentioned concerns regarding confusing, outdated
information, lots of information on a page, not able to find things quickly, and
links being too deeply embedded. Even as we try to work through the solutions
and try to think of ways to make the interface more user-friendly there are
certain aspects that has to be kept in mind. The SILS website houses a broad
spectrum of information as it caters to a diverse range of user groups, each
with separate set of needs and objectives. Organizing such information in a
single site keeping in view the variety of requirements it has to serve can be a
large task. Although participants mentioned some concerns regarding the
inorganization of content, a deeper study of some of the remarks may indicate
issues that could be addressed with small changes. For example, a student
mentioned that he or she never knew that “faculty” was a link on the people
section and has assumed it to be just a parent tab for adjunct faculty and visiting
scholars. This might be addressed by using a standard formatting and link
6. Conclusion
Overall, this survey tried to understand and gauge the needs of current
students, faculty, and staff and made an effort to analyze which aspects of the
SILS website satisfy users most and which aspects seem to need attention.
From all the responses we collated for the study, it can be concluded that
participants face some issues with respect to their information needs on the
SILS website and it would be possible to make the interface more user-friendly
by considering changes to the navigation, the content and lay-out of pages,
and updating information and making it more consistent. Attention needs to
paid to which aspects of information are used most and utilized by each user
group, and then plans could be devised to make content more ‘visible’ and
accessible. The SILS website is a huge resource and new information will keep
adding up; at any point of time the website will need to be flexible and evolve
over time. The opinions and feedback of users can help to find effective
7. Bibliography
Bevan, N. (2001). International standards for HCI and usability. International journal of
human-computer studies, 55(4), 533-552.
Damodaran, L. (1996). User involvement in the systems design process-a practical guide
for users. Behaviour & information technology, 15(6), 363-377.
Endsley, M. R. (2016). Designing for situation awareness: An approach to user-centered
Design (2nd ed.). CRC press. Boca Raton, Florida.
Forlizzi, J., & Battarbee, K. (2004). Understanding experience in interactive
systems. In Proceedings of the 5th conference on Designing interactive systems:
processes, practices, methods, and techniques . ACM, ( 261-268).
Garrett, Jesse James (2011). Elements of user experience, the: user-centered design for
the web and beyond (2nd ed.). Pearson Education. Berkeley, California.
Hartmanis, J. (1992). Computing the future: committee to assess the scope and direction
of computer science and technology for the National Research
Council. Communications of the ACM, 35(11), 30-40.
Hassenzahl, M. (2010). Experience Design: Technology for All the Right Reasons.
Morgan & Claypool Publishers.
ISO 9241-11:1998. (1998). Ergonomic requirements for office work with visual display
terminals (VDTs) – Part 11: Guidance on usability. Retrieved May 10, 2017, from
https://www.iso.org/obp/ui/#iso:std:iso:9241:-11:ed-1:v1:en
Kujala, S. (2002). User studies: a practical approach to user involvement for gathering
Computing Series, No. 116, Espoo 2002, 132 pp. Published by the Finnish
Academies of Technology.
Kujala, S. (2008). Effective user involvement in product development by improving the
analysis of user needs. Behavior & Information Technology, 27(6), 457-473.
doi:10.1080/01449290601111051.
Mayhew, D. J. (1999). The usability engineering lifecycle. In CHI'99 Extended Abstracts
on Human Factors in Computing Systems (pp. 147-148). ACM.
Nielsen, J. (1992). The usability engineering life cycle. Computer, 25(3), 12-22.
Nielsen, J. (2012). Usability 101: Introduction to Usability. Retrieved April 11, 2017, from
https://www.nngroup.com/articles/usability-101-introduction-to-usability/
Norman, D. (1988). The Design of Everyday Things. Basic Books, Inc. New York
Reiterer, H (1997). User Interface Evaluation. In: A. Kent & J. G. Williams (Eds.),
Encyclopedia of microcomputers: Volume 19; Truth. Maintenance Systems to
Visual Display Quality (pp. 201-221). New York: Dekker.
Stone, D., Jarrett, C., Woodroffe, M., & Minocha, S. (2005). User interface design and
evaluation. Amsterdam: Elsevier
University of Maryland. Questionnaire for User Interaction Satisfaction. (n.d.).
Retrieved April 22, 2017, from http://lap.umd.edu/quis/
Usabilityfirst.com, Introduction to User-Centered Design. (n.d.). Retrieved April 22, 2017,
from http://www.usabilityfirst.com/about-usability/introduction-to-user-centered-design/
Usabilitynet.org. International standards for HCI and usability. (n.d.).
Retrieved April 21, 2017, from
http://www.usabilitynet.org/tools/r_international.htm
Wright, K. B. (2005). Researching Internet‐based populations: Advantages and
disadvantages of online survey research, online questionnaire authoring software
packages, and web survey services. Journal of Computer‐Mediated