Sharif University of Technology
Scientia IranicaTransactions C: Chemistry and Chemical Engineering www.scientiairanica.com
Study on the eect of adding co-solvent
(n-alkoxyethanol) to sulfolane on the toluene extraction
Khalid Farhod Chasib
Department of Chemical Engineering, University of Technology, Baghdad, P.O. Box 18310, Iraq. Received 22 April 2012; received in revised form 5 August 2012; accepted 9 March 2013
KEYWORDS Liquid-liquid equilibrium; Sulfolane; n-alkoxyethanol; Extraction; NRTL; UNIQUAC; UNIFAC.
Abstract.Liquid-liquid equilibrium data, both binodal and tie lines are presented for the pseudo-ternary systems: (sulfolane + n-Alkoxyethanol) + octane + toluene at 293.15 K. The experimental liquid-liquid equilibrium data have been correlated using the nonrandom two liquid (NRTL), UNIQUAC and UNIFAC models to predict the phase composition of the systems studied here, and the binary interaction parameters of these components have been calculated. The correlated tie lines have been compared with the experimental data. The comparisons indicate that the calculation based on both NRTL and UNIQUAC models gave a good representation of the equilibrium compositions data for all systems studied. Also Othmer, Tobias and Hand methods satisfactorily correlated tie-line data of the studied systems. The agreement between the correlated and experimental results was very good. The solvent (25% sulfolane+75% 2-ethoxyethanol) shows a high capacity for toluene (a distribution coecient around unity), and for this reason, it can be used for higher recovery of aromatics at lower solvent to feed ratios and temperatures.
c
2013 Sharif University of Technology. All rights reserved.
1. Introduction
Solvent extraction is one of the most important meth-ods to produce high-purity aromatic extracts from catalytic reformates. The selection of a solvent for ex-traction study depends on the solvent power measured by the solute distribution coecient and also on its selectivity. In the case of recovery of aromatics from reformats, a solvent with largest possible capacity and highest selectivity toward aromatics is preferred.
The ecient separation of aromatic from catalytic reformates is an important concept in the chemical industry where many solvents have been tested to improve such recovery. Sometimes it may be desirable to use a low-boiling solvent that has to be distilled for a recycling process. Three major factors have been found to inuence the equilibrium characteristics of solvent extraction of aromatic from catalytic reformates (i.e. *. Tel.: +964 790 2 89 80 18
E-mail address: khalid [email protected]
the nature of solute, the concentration of solute, and the type of organic solvent). Simultaneously, the impact of additional controlling factors, such as the third-phase formation and the swing eect of a mixed solvent, can also modify the equilibrium. Process considerations dealing with the physical extraction of aromatic through hydrogen bonding or dipole-dipole interaction still remain a challenging problem, because such systems show extremely nonideal behavior.
Regarding the technical and economic merits of low boiling solvents during regeneration by distillation, the selection of Sulfolane as extracting agents from various classes of polar, protic, or nonprotic compounds was made.
In recent years, Sulfolane has been employed more and more in new or improved extraction processes. It is an important industrial solvent having the ability to extract aromatic hydrocarbons from petroleum prod-ucts and to purify natural gas. This process is still widely used in reneries and petrochemical industry. Because sulfolane is one of the most ecient industrial
solvents for purifying aromatics, the process operates at a relatively low solvent-to-feed ratio, making sulfolane relatively cost-eective, compared to similar-purpose solvents. In addition, it is selective in a range that complements distillation, where sulfolane cannot sep-arate two compounds, distillation easily can and vice versa, keep sulfolane units useful for a wide range of compounds with minimal additional cost. Sulfolane is highly stable and can therefore be reused many times. Therefore, it is necessary to have complete thermodynamic data for these systems [1].
Liquid-Liquid Equilibria (LLE) data on a number of ternary mixtures containing sulfolane have been extensively studied [2-7]. Few papers in the literature deal with quaternary liquid-liquid equilibrium data, which include sulfolane [8-12]. In this paper, we present a new experimental quaternary liquid-liquid equilibrium data for toluene + octane + sulfolane + n-Alkoxyethanol at 293.15 K. There is no literature data on the quaternary systems studied. There are also no references to earlier published work about aromatics extraction from aliphatic components. This quater-nary system is treated as a pseudo terquater-nary system; component 1 is (sulfolane + n-Alkoxyethanol) and two components are kept the same (octane and toluene), where n-Alkoxyethanol means methoxyethanol or 2-ethoxyethanol. The mass fractions of n-Alkoxyethanol in sulfolane were (5 to 75)%. Furthermore, the LLE data were correlated using the NRTL [13], UNI-QUAC [14] and UNIFAC [15] activity coecient mod-els to obtain the binary interaction parameters of these pairs of components. The experimental data for all studied systems were also correlated by using equation proposed by Hand [16], Othmer and Tobias [17]. 2. Experimental section
2.1. Chemicals
Sulfolane (> 99:5%, GC), octane (> 99:8%, GC), toluene (> 99:9%, GC), 2-methoxyethanol (> 99:8%, GC) and 2-ethoxyethanol (> 99:8%, GC) were sup-plied by Fluka, these chemicals were presented in Table 1 with their purities. Physical properties such
as density of these materials used in this study were measured experimentally, and compared with values in the literature [18,19]. All chemicals were used without further purication, but were kept over freshly activated molecular sieves of type 4A (Union Carbide) for several days and ltered before use. Mass fractions of impurities detectable by GC were found to be < 0:0020. Deionized and redistilled water was used throughout all experiments. Refractive indices were measured through an Abbe-Hilger refractometer with an uncertainty of 5 10 4. Densities were measured
using an Anton Paar DMA 4500 density meter. The estimated uncertainty in the density was 10 4g/cm3.
The measured densities and refractive indices of the pure solvents used in this work agreed well with those values published in the literature [18,19].
2.2. Apparatus and procedures
The binodal (solubility) curves were determined by the cloud-point titration method, in an equilibrium glass cell with a water jacket, to maintain isothermal conditions as described by Hadded and Edmister [20]. The temperature in the cell was measured by a certied Fischer thermometer with an accuracy of 0:1 K, and was kept constant by circulating water from a water bath equipped with a temperature controller.
The major central part of the solubility curves was obtained by titrating heterogeneous mixtures of octane + toluene with sulfolane until the turbidity had disappeared. For the octane side and solvent side limited regions in which the curve and the sides of the triangle are close and exhibit similar slopes, binary mixtures of either (octane + sulfolane) or (toluene + sulfolane) were titrated against the third component until the transition from homogeneity to cloudiness was observed. All mixtures were prepared by weight with a Mettler scale, accurate within 10 4g. The transition
point between the homogeneous and heterogeneous regions was determined visually. The reliability of the method depends on the precision of the Metrohm microburet with an uncertainty of 0:005 cm3, and is
limited by the visual inspection of the transition across the apparatus. Concentration determinations were
Table 1. Physical properties of chemicals used at 25C.
Component M. wt. g/mol
Density 25
g/cm3
Refractive index n25
D
Boiling point
Exp. Lit. Exp. Lit. C
Sulfolane 120.17 1.2654 1.2646 1.4819 1.4816 285.2 Octane 114.23 0.7027 0.7031 1.3952 1.3956 125.7 Toluene 92.14 0.8575 0.8577 1.4930 1.4935 110.6 2-methoxyethanol 76.09 0.9642 0.9651 1.4013 1.4026 124.4 2-ethoxyethanol 90.12 0.9313 0.9305 1.4096 1.4082 135.1
made with a mass fraction uncertainty of 0:002. End-point determinations of the tie lines were based upon the independent analysis of the conjugate phases that were regarded as being in equilibrium. The tie-lines were determined using the refractive index method; the experimental procedures were described by Briggs and Comings [21]. Plait points were determined using the method outlined by Treybal et al. [22].
3. Results and discussion
3.1. Liquid-liquid equilibria of the systems (sulfolane +2-methoxyethanol)+n-octane + toluene
The liquid-liquid equilibria of the following systems have been studied at 293.15 K:
1. sulfolane + n-octane + toluene.
2. [sulfolane + 2-methoxyethanol (mass fraction 0.95: 0.05)] + n-octane + toluene.
3. [sulfolane + 2-methoxyethanol (mass fraction 0.75: 0.25)] + n-octane + toluene.
4. [sulfolane + 2-methoxyethanol (mass fraction 0.50: 0.50)] + n-octane + toluene.
5. [sulfolane + 2-methoxyethanol (mass fraction 0.25: 0.75)] + n-octane + toluene.
3.1.1. Mutual solubility
The compositions of mixtures on the binodal curve of the above ve systems at 293.15 K are represented as triangular diagrams in Figures 1-5.
For comparison purpose, binodal curves of the ve systems are included in Figure 6. Binodal curve of the pure sulfolane + n-octane + toluene at 293.15K are also included in this diagram for comparison.
Figure 1 shows that the two-phase region for the system containing only sulfolane as a solvent is large, indicating a large range of separation compositions.
Figure 1. Binodal curve and tie lines for pure sulfolane + n-octane + toluene at 293.15K.
The relative solubility of toluene in an n-octane or in solvent mixture is evident from the tie lines. The slopes of the tie lines presented here (Figures 2-5) show that toluene is more soluble in the n-octane than in solvent mixture, with a skewing toward the
Figure 2. Binodal curve and tie lines for (sulfolane + 2-methoxy ethanol (mass fraction 0.95: 0.05)) + n-octane + toluene at 293.15K.
Figure 3. Binodal curve and tie lines for (sulfolane + 2-methoxy ethanol (mass fraction 0.75: 0.25)) + n-octane + toluene at 293.15 K.
Figure 4. Binodal curve and tie lines for (sulfolane + 2-methoxy ethanol (mass fraction 0.50: 0.50)) + n-octane + toluene at 293.15 K.
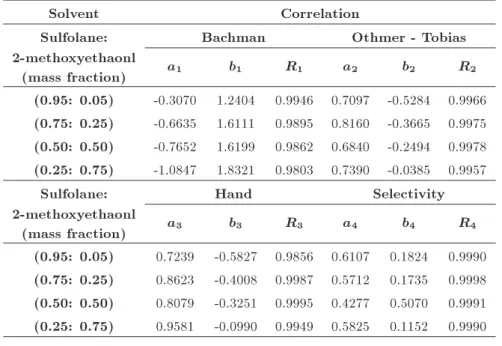
Figure 5. Binodal curve and tie lines for (sulfolane + 2-methoxy ethanol (mass fraction 0.25: 0.75)) + n-octane + toluene at 293.15 K.
Figure 6. Comparison of the phase-equilibrium diagram for solvent + n-octane + toluene at 293.15 K.
solvent mixture axis. This skewing decreases with the increase of the 2-methoxyethanol content in the solvent mixture.
Figure 6 shows that the area of the two-phase region increases in the order pure sulfolane > sulfolane : 2-methoxyethanol (0.95: 0.05) > (0.75: 0.25) > (0.50 : 0.50) > (0.25 : 0.75).
The maximum solubility of n-octane in solvent mixture (sulfolane + 2-methoxyethanol) (0.95: 0.05), (0.75: 0.25), (0.50: 0.50), and (0.25: 0.75) is 0.010, 0.020, 0.046, and 0.082 mass fraction, respectively, and the solubility of solvent mixture in n-octane is 0.010, 0.016, 0.020, and 0.026 mass fraction, respectively, at 293.15 K.
The increase in the 2-methoxyethanol content in the solvent mixture results in a decrease in the two-phase area, and reects the increase in solubility of n-octane in the solvent mixture.
3.1.2. Tie line data
Tie line data for the ve systems at 293.15 K are plotted on triangular diagrams, according to a method of Francies [23] (Figures 1-5). The tie line data indicate the composition of two phases (solvent-rich phase and n-octane-rich phase). These data are observed to t well in the smoothed binodal curves, indicating the
accuracy of the experimental tie line data. From the slope of the tie lines, it can be seen that, in all cases, toluene is more soluble in n-octane-rich phase than in solvent-rich phase, with a large skewing toward the solvent axis, but the selectivity is greater than 1; thus, the extraction is possible.
3.1.2.1. Evaluation of the consistency of the experimental tie lines
The accuracy of the experimental data for the four pseudo-ternary systems at 293.15K were checked by the Bachman, Othmer-Tobias, Hand, and selectivity methods [16,17,21]:
Bachman method: w11= a1+ b1
w11
w22
: (1)
Othmer-Tobias method: log
1 w11
w11
= a2+ b2log
1 w22
w22
: (2)
Hand method: log
w31
w11
= a3+ b3log
w32
w22
: (3)
Selectivity method: log
w32:w11
w12:w31
= a4+ b4log
w11:w22
w21:w12
: (4)
The tie line data of the mixture (sulfolane + 2-methoxyethanol) + n-octane + toluene were correlated by the Bachman, Othmer-Tobias, Hand and selectivity methods to ascertain the reliability of the experimental results for each system.
The parameters aj and bj (j = 1 4) of Eqs.
(1)-(4) are obtained by using maximum likelihood principle method [24,25]. The parameters and the correlation coecients, Rj, are given in Table 2. Since the data
show little scattering from a straight line, they are considered acceptable on an empirical basis, indicating internal consistency of the experimental data. The estimation of plait points for the systems is presented by the use of Treybal's method [21,22].
As can be seen from Table 2, all methods gave good correlation for the equilibrium distribution data, the largest correlation coecient (R) being found for all systems with selectivity method.
The values of the coecient of correlation (R) are close to unity. The goodness of the t conrms the reliability of the results.
Table 2. Results of the maximum likelihood principle method for (sulfolane + 2-methoxyethaonl) + n-octane + toluene at 293.15 K.
Solvent Correlation
Sulfolane: Bachman Othmer - Tobias
2-methoxyethaonl
(mass fraction) a1 b1 R1 a2 b2 R2
(0.95: 0.05) -0.3070 1.2404 0.9946 0.7097 -0.5284 0.9966 (0.75: 0.25) -0.6635 1.6111 0.9895 0.8160 -0.3665 0.9975 (0.50: 0.50) -0.7652 1.6199 0.9862 0.6840 -0.2494 0.9978 (0.25: 0.75) -1.0847 1.8321 0.9803 0.7390 -0.0385 0.9957
Sulfolane: Hand Selectivity
2-methoxyethaonl
(mass fraction) a3 b3 R3 a4 b4 R4
(0.95: 0.05) 0.7239 -0.5827 0.9856 0.6107 0.1824 0.9990 (0.75: 0.25) 0.8623 -0.4008 0.9987 0.5712 0.1735 0.9998 (0.50: 0.50) 0.8079 -0.3251 0.9995 0.4277 0.5070 0.9991 (0.25: 0.75) 0.9581 -0.0990 0.9949 0.5825 0.1152 0.9990
k1= Toluene mole fraction (or mass fraction) in n-octane layerToluene mole fraction (or mass fraction) in solvent layer = ww3132, (5)
k2= n-Octane mole fraction (or mass fraction) in n-octane layern-Octane mole fraction (or mass fraction) in solvent layer = ww2122. (6)
Box I. 3.1.3. Distribution coecient and selectivity
The eectiveness of the solvent for the extraction can be expressed in terms of the distribution coecient (k1)
and (k2) of the toluene and n-octane, respectively, and
the selectivity (S) of the solvent.
Distribution coecients of toluene and n-octane are represented in Eqs. (5)-(6) shown in Box I.
The selectivity (S) which is a measure of the ability of solvent to separate toluene from n-octane is given by the formula:
S = kk1
2: (7)
Figure 7 shows the comparison of distribution coef-cients of toluene, and Figure 8, the selectivity of solvents.
As can be seen from the distribution and selectiv-ity curves, Figures 7 and 8, the selectivselectiv-ity and capacselectiv-ity vary in the following order:
Sulfolane:
Similar conclusions can be drawn from Figure 6; increase in the heterogeneous area in the ternary
Figure 7. Distribution curves for solvent (1) + n-octane (2) + toluene (3) at 293.15K.
diagram results in an increase in selectivity and a decrease in capacity.
Combination solvent systems (sulfolane + 2-methoxyethanol), although less selective, have higher capactiy compared to that of pure sulfolane.
High selectivity for a desired capacity or solvent power is the primary requirement for a good solvent.
Figure 8. Selectivity curves for solvent (1) + n-octane (2) + toluene (3) at 293.15K.
However, an increase in the capacity of a solvent leads to a decrease in its selectivity or vice versa. To choose the optimum values of selectivity and capacity is therefore a compromise between the two values, which can be adjusted here by the amount of 2-methoxyethanol being added to sulfolane.
3.1.4. Estimation of the plait point
The compositions of the plait points as determined by construction and Treybal methods [21,22] for the systems (sulfolane + 2-methoxyethanol) (1) + n-octane (2) + toluene (3) at 293.15 K are listed in Table 3, as mass fraction.
It is apparent from Table 3 that the plait point concentration changes from a solvent-rich composition to n-octane-rich composition, as the 2-methoxyethanol content increases in the solvent mixture.
3.2. Liquid-liquid equilibria of the systems (sulfolane + 2-ethoxyethanol) + n-octane + toluene
The phase equilibria (LLE) of the following systems have been studied at 293.15 K:
(6) [sulfolane + 2-ethoxyethanol (mass fraction 0.95: 0.05)] + n-octane + toluene.
(7) [sulfolane + 2-ethoxyethanol (mass fraction 0.75: 0.25)] + n-octane + toluene.
(8) [sulfolane + 2-ethoxyethanol (mass fraction 0.50: 0.50)] + n-octane + toluene.
(9) [sulfolane + 2-ethoxyethanol (mass fraction 0.25: 0.75)] + n-octane + toluene.
3.2.1. Mutual solubility
The experimental data for the binodal curve at 293.15 K are represented as triangular diagrams in Figures 9-12.
The binodal curves of the sulfolane + n-octane
Figure 9. Binodal curve and tie lines for [sulfolane + 2-ethoxyethanol (mass fraction 0.95: 0.05)] + n-octane + toluene at 293.15 K.
Figure 10. Binodal curve and tie lines for [sulfolane + 2-ethoxyethanol (mass fraction 0.75: 0.25)] + n-octane + toluene at 293.15 K.
Table 3. Compositions of the plait points for solvent (1) + n-octane (2) + toluene (3) at 293.15K. Solvent Construction method Treybal method
Sulfolane + 2-methoxy
ethanol (mass fraction) w1 w2 w3 w1 w2 w3 (0.95: 0.05) 0.400 0.088 0.512 0.397 0.086 0.517 (0.75: 0.25) 0.320 0.160 0.520 0.322 0.163 0.515 (0.50: 0.50) 0.300 0.220 0.480 0.307 0.223 0.470 (0.25: 0.75) 0.280 0.316 0.404 0.283 0.318 0.399
Figure 11. Binodal curve and tie lines for [sulfolane + 2-ethoxyethanol (mass fraction 0.50: 0.50)] + n-octane + toluene at 293.15 K.
Figure 12. Binodal curve and tie lines for [sulfolane + 2-ethoxyethanol (mass fraction 0.25: 0.75)] + n-octane + toluene at 293.15 K.
Figure 13. Comparison of the phase equilibrium diagram for solvent + n-octane + toluene at 293.15 K.
+ toluene and the above four systems are included in Figure 13 for comparison.
From the binodal curves data shown in Figure 13, it can be seen that an increase in the 2-ethoxyethanol content in solvent mixture (from 0.05 to 0.75 mass fraction) results in a decrease in the area of two-phase region, i.e. the mutual solubility of the components are increased (the maximum solubility of n-octane in solvent mixture is 0.020, 0.022, 0.052, and 0.107 mass fraction, respectively, and the solubility of solvent
mixture in n-octane is 0.010, 0.030, 0.032, and 0.040 mass fraction, respectively). This implies that the ex-istence of more hydrogen bonding interaction between sulfolane and 2-ethoxyethanol results in a decrease in the area of the two-phase region.
3.2.2. Tie line data
3.2.2.1. Evaluation of the consistency of the experimental tie lines
From the slope of the tie lines, Figures 9-12, it can be clearly seen that the toluene is slightly more soluble in the n-octane-rich phase than in solvent mixture-rich phase.
It can also be seen from tie line data that as the content of 2-ethoxyethanol increases in the solvent mixture, the solubility of toluene in the solvent-rich phase increases, and, correspondingly, decreases in the n-octane-rich phase.
The consistency of the data was tested by the Bachman, Othmer-Tobias, Hand, and selectivity meth-ods [16,17,21]. All methmeth-ods gave good correlation for the equilibrium data. The results of the maximum likelihood principle method [24,25] are presented in Table 4. The values of the coecient of correlation (R) are close to unity. The goodness of the t conrms the reliability of the results.
The distribution coecient and selectivity of sol-vents are presented in Figures 14 and 15.
3.2.3. Distribution coecient and selectivity
The dissolving ability, i.e. the distribution coecient, k1, is dened as the ratio of the mass fraction of
toluene, in the solvent rich phase, to that in octane-rich phase. The eectiveness of the extraction of toluene (3) by a solvent is indicated by its separation factor (selectivity, S), that is used as a measure of the ability of solvent (sulfolane + 2-ethoxyethanol) (1) to separate toluene (3) from octane (2).
Figure 14. Distribution curves for solvent (1) + n-octane (2) + toluene (3) at 293.15 K.
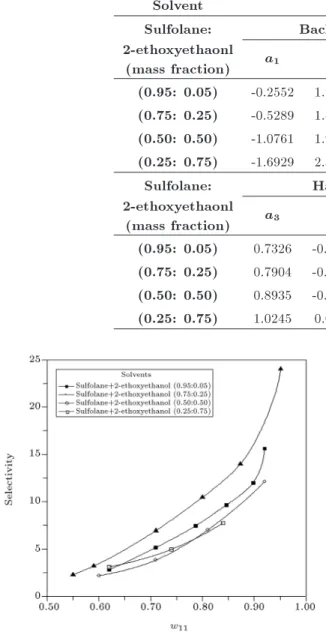
Table 4. Results of the maximum likelihood principle method for (sulfolane + 2-ethoxyethaonl) + n-octane + toluene at 293.15K.
Solvent Correlation
Sulfolane: Bachman Othmer - Tobias
2-ethoxyethaonl
(mass fraction) a1 b1 R1 a2 b2 R2
(0.95: 0.05) -0.2552 1.2023 0.9976 0.7291 -0.5722 0.9977 (0.75: 0.25) -0.5289 1.4805 0.9963 0.8241 -0.3844 0.9985 (0.50: 0.50) -1.0761 1.9462 0.9936 0.8679 -0.0748 0.9969 (0.25: 0.75) -1.6929 2.3134 0.9999 0.8297 0.2081 0.9992
Sulfolane: Hand Selectivity
2-ethoxyethaonl
(mass fraction) a3 b3 R3 a4 b4 R4
(0.95: 0.05) 0.7326 -0.6468 0.9781 0.6207 0.2094 0.9992 (0.75: 0.25) 0.7904 -0.4658 0.9939 0.4041 0.5236 0.9974 (0.50: 0.50) 0.8935 -0.2323 0.9930 0.2428 0.8861 0.9959 (0.25: 0.75) 1.0245 0.0745 0.9996 0.5608 0.1407 0.9995
Figure 15. Selectivity curves for solvent (1) + n-octane (2) + toluene (3) at 293.15 K.
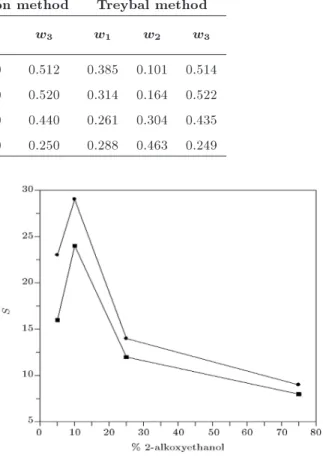
From Figures 14-15, the distribution coecients increases with increasing 2-ethoxyethanol concentra-tion (from 0.05 to 0.75 mass fracconcentra-tion), and the reverse is true for selectivities, but at lower concentrations of toluene, the solvent with 0.25 mass fraction 2-ethoxyethanol shows higher selectivities than that with 0.05 mass fraction 2-ethoxyethanol as shown in Fig-ure 15.
The slope of the tie lines (k1 values) shows that
toluene is more soluble in the octane phase than in the solvent phase for all of the percentage mass composition of the solvent studied, except for (sulfolane + 75% 2-ethoxyethanol) composition yielding k1 of about 1.
Selectivity, S, is an important factor in examining the eciency of solvent extraction processes. The
mea-sured selectivity of solvent for the extraction of toluene is greater than 1, and this means that extraction is possible. Furthermore, selectivity is decreased by more addition of co-solvent 2-ethoxyethanol, which reects the strong molecular interaction between sulfolane and 2-ethoxyethanol.
The solvent [sulfolane + 2-ethoxyethanol (0.25: 0.75)] shows higher capacity for toluene (k1 1:00)
compared to pure sulfolane, and for this reason, it can be used for higher recovery of aromtics at lower solvent to feed ratios and temperatures.
The eect of addition of 2-ethoxyethanol to the sulfolane on the selectivity of solvent for extraction of toluene from (toluene + octane) mixture is shown in Figure 15. It is shown that increase of 2-ethoxyethanol percentage decreases the selectivity of sulfolane (selec-tivity of pure sulfolane is 37). At lower concentration of toluene, the solvent with 0.25 mass fraction 2-ethoxyethanol shows higher selectivity than that with 0.05 mass fraction 2-ethoxyethanol, as shown in Fig-ure 15.
3.2.4. Estimation of the plait point
Compositions of plait points for the systems (sulfolane + 2-ethoxyethanol) (1) + n-octane (2) + toluene (3) at 293.15 k are listed in Table 5, as mass fraction.
As shown in Table 5, the plait points moved from region of high solvent concentration to a region of high n-octane concentration as the 2-ethoxyethanol increases in the solvent mixture.
3.3. General discussion
Selection of a solvent for extraction study depends on the solvent power measured by the solute distribution
Table 5. Compositions of the plait points for (sulfolane + 2-ethoxyethanol) (1) + n-octane (2) + toluene (3) at 293.15 K. Solvent Construction method Treybal method
Sulfolane: 2-ethoxyethanol
(mass fraction) w1 w2 w3 w1 w2 w3
(0.95: 0.05) 0.388 0.100 0.512 0.385 0.101 0.514 (0.75: 0.25) 0.310 0.170 0.520 0.314 0.164 0.522 (0.50: 0.50) 0.260 0.300 0.440 0.261 0.304 0.435 (0.25: 0.75) 0.290 0.460 0.250 0.288 0.463 0.249
coecient and also on its selectivity. In the case of recovery of aromatics from reformats, a solvent with largest possible capacity and highest selectivity toward aromatics is preferred. Sulfolane is an important industrial solvent having the ability to extract mono-cyclic aromatic hydrocarbons from petroleum prod-ucts. Thus this combination solvent system appears to be attractive for extraction of aromatics from naphtha reformate.
Polarity dierence between the (sulfolane + co-solvent) molecules and the aromatic compound in-creases as the polarity of the co-solvent inin-creases.
In the aromatic series, benzene, toluene, and xy-lene (ortho and meta) polarity increases as the molec-ular weight of the aromatic member increases [18], due to the greater amount of electrons, which are subject to electromeric shifts within the ring (inductive eect of the methyl groups). Rawat [26] found that the solvent power for many extractive solvents was always greater for benzene than for toluene or xylene. Other factors such as smaller molecular size and lower molecular weight also help in the association of the benzene with the solvent molecule, making benzene more eectively extracted. The polarity dierence between the solvent and an aromatic compound should not be too high for eective extraction. A low polarity dierence between the solvent and the aromatic compound results in attractive forces between dierent molecules, and as a result, the aromatic molecules are preferentially pulled toward the solvent [19].
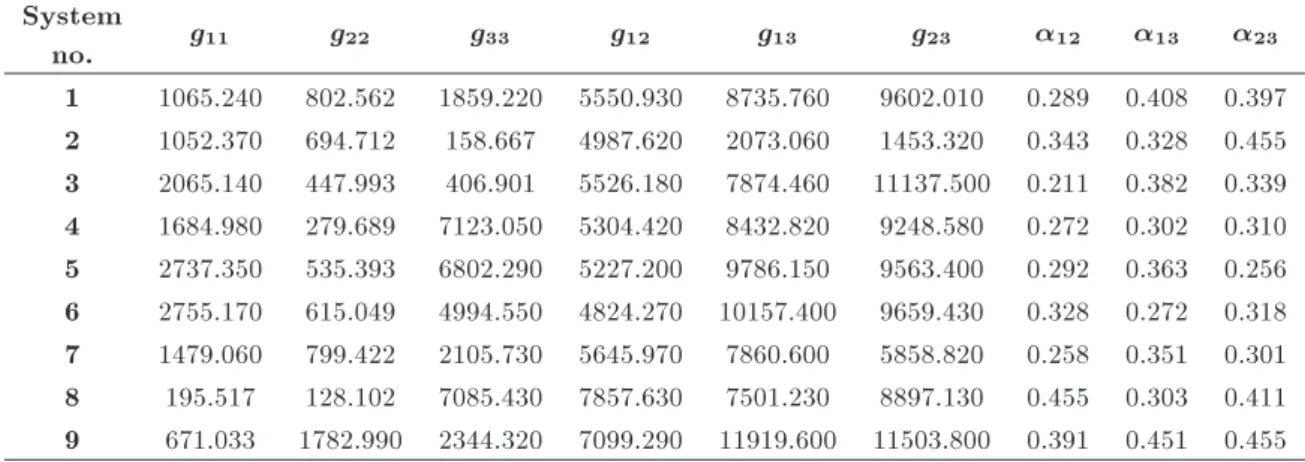
Combination solvent systems (sulfolane + 2-methoxyethanol and sulfolane + 2-ethoxyethanol), al-though less selective, have higher capacity compared to that of pure sulfolane. This may be attributed to the greater dipole moments of n-alkoxyethanols and to smaller intermolecular self-association. The exis-tence of intramolecular H-bonds in n-alkoxyethanols may enhance the dipolar interactions between n-alkoxyethanols and hydrocarbons, leading to an in-crease of the capacity and a dein-crease in selectivity. Consequently, such interaction is also stronger in mix-tures with methoxyethanol than in systems with 2-ethoxyethanol. Figure 16 shows the comparison of ex-perimental selectivity data for the (sulfolane +mass%
Figure 16. Experimental selectivity data for () sulfolane + 25% 2-methoxyethanol and () sulfolane + 25% 2-ethoxyetanol in f(sulfolane + 25% 2-alkoxyethanol) (1) + octane (2) + toluene (3)g system at 293.15 K.
2-ethoxyethanol) with those for the (sulfolane + mass% 2-methoxyethanol).
3.3.1. Prediction and correlation of experimental data If a liquid mixture of a given composition at a known temperature is separated into two phases (i.e. in equilibrium), the composition of the two phases can be calculated from the following equations:
I
ixIi= iIIxIIi ; (8)
zi= zIi+ zIIi ; (9)
where zi, ziI and ziII are the number of moles of
component i in the system and in phases I and II, respectively, and I
i and iII are the corresponding
activity coecients of component i in phases I and II, as calculated from the equilibrium equations, NRTL and UNIQUAC. The generated binary and ternary compo-nent equilibria data are used to determine interaction parameters between paranic/aromatic hydrocarbons and solvent; these in turn are used to estimate the activity coecients from the NRTL and the UNIQUAC
equations. In a similar fashion, the interaction param-eters between parnic/aromatic hydrocarbon groups and solvent groups were used to predict the activity coecients form the UNIFAC model. Interaction parameters between certain group pairs have already been reported in the literature [15], and these values have been used where required.
The Riand Qivalues for the UNIFAC groups and
the ri and qi for the UNIQUAC compounds are shown
in Table 6. Eqs. (8) and (9) were solved for the mole fraction (or mass fraction) xi of component i in each
liquid phase.
Optimal interaction parameters between com-pounds for NRTL and UNIQUAC and between func-tional groups for UNIFAC were found by using an optimized computer program, using maximum like-lihood principle method developed by Sorensen [24] and Anderson [25]. The objective function (F ) in this case was minimized by minimizing the square of the dierence between the mole fractions (or mass fractions) predicted by the respective method and these experimentally measured.
F =Xn
i=1
minX3
j=1 2
X
L=1
[xjL(exptl; i) xjL(caled; i)]2;
(10)
where xjL(exptl; i) is the experimental mole fraction
and xjL(caled; i) is the calculated mole fraction. The
subscripts and superscripts are i for the tie lines (1; 2; ; n), j for the components (1; 2; 3), and L for the phase (I,II).
Values of the parameters that minimized this ob-jective function were sought, using both the UNIQUAC model and the NRTL model. The values of the six parameters for the UNIQUAC model:
U11; U22; U33; U12; U13; U33 (J mol 1);
were calculated.
The values of the nine parameters for the NRTL model:
g11; g22; g33; g12; g13; g23; 11; 12; 13;
for the ternary systems were calculated by using maxi-mum likelihood principle method [25]. The parameters calculated in this way are shown in Tables 7 and 8.
The Root Mean Square Deviation (RMSD) is calculated from the results of each method, according to the following equation:
RMSD= 2 4Xn
i=1 3
X
j=1 2
X
L=1
(xjL(exptl; i) xjL(calcd; i))2
6n
3 5
1 2
: (11)
Table 6. The Ri=riand Qi=qivalues for the groups/components resent in the systems.
UNIFAC Model [15] UNIQUAC Model [14]
Group Ri Qi Component ri qi
Sulfolane 3.7220 2.936 Toluene 3.922 2.968 CH3 0.9011 0.848 n-octane 5.847 4.936
CH2 0.6744 0.540 Sulfolane 4.034 3.200
CH3O 1.1450 1.088 2-methoxyethanol 3.026 2.752
CH2O 0.9183 0.780 2-ethoxyethanol 3.698 3.292
ACH 0.5313 0.400 ACCH3 1.2663 0.968
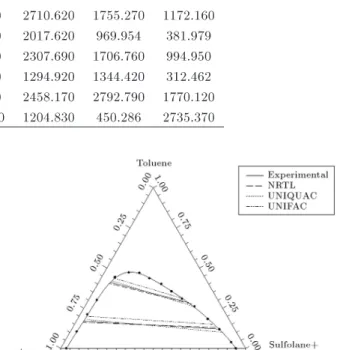
Table 7. NRTL parameters (gij(J mol 1)) and (ij) for the systems solvent (1) + n-alkane (2) + aromatic
hydrocarbons (3) at 293.15 K. System
no. g11 g22 g33 g12 g13 g23 12 13 23
1 1065.240 802.562 1859.220 5550.930 8735.760 9602.010 0.289 0.408 0.397 2 1052.370 694.712 158.667 4987.620 2073.060 1453.320 0.343 0.328 0.455 3 2065.140 447.993 406.901 5526.180 7874.460 11137.500 0.211 0.382 0.339 4 1684.980 279.689 7123.050 5304.420 8432.820 9248.580 0.272 0.302 0.310 5 2737.350 535.393 6802.290 5227.200 9786.150 9563.400 0.292 0.363 0.256 6 2755.170 615.049 4994.550 4824.270 10157.400 9659.430 0.328 0.272 0.318 7 1479.060 799.422 2105.730 5645.970 7860.600 5858.820 0.258 0.351 0.301 8 195.517 128.102 7085.430 7857.630 7501.230 8897.130 0.455 0.303 0.411 9 671.033 1782.990 2344.320 7099.290 11919.600 11503.800 0.391 0.451 0.455
Table 8. UNIQUAC parameters (Uij(J.mol 1)) for the systems solvent (1) + n-alkane (2) + aromatic hydrocarbons (3)
at 293.15 K.
System
no. U11 U22 U33 U12 U13 U23
1 888.593 1201.860 257.087 2813.580 1937.430 1465.200 2 573.380 2226.510 2664.090 3446.190 490.404 1105.830 3 1550.340 903.869 9382.230 2071.080 735.754 598.002 4 1074.150 1131.570 5911.290 2710.620 1755.270 1172.160 5 534.681 589.191 2347.290 2017.620 969.954 381.979 6 1123.650 719.878 4729.230 2307.690 1706.760 994.950 7 292.298 5482.620 1137.510 1294.920 1344.420 312.462 8 1386.990 868.199 1242.450 2458.170 2792.790 1770.120 9 78.605 4433.220 13355.100 1204.830 450.286 2735.370
RMSD is a measure of the agreement between the experimental data and the calculated data.
The calculated tie lines using the three models for systems studied are compared with the experimental data in Figures 17-19.
The average RMSD values for the three methods for all system studied are 0.165, 0.491 and 1.304 for NRTL, UNIQUAC and UNIFAC, respectively. The
Figure 17. Experimental and calculated tie lines for the system [sulfolane + 2-methoxyethanol (mass fraction 0.75: 0.25)] + n-octane + toluene at 293.15 K.
Figure 18. Experimental and calculated tie lines for the system [sulfolane + 2-methoxyethanol (mass fraction 0.25: 0.75)] + n-octane + toluene at 293.15 K.
Figure 19. Experimental and calculated tie lines for the system sulfolane + 2-ethoxyethanol (mass fraction 0.50: 0.50) + n-octane + toluene at 293.15 K.
calculations based on both the UNIQUAC and NRTL models gave a good representation of the tie line data. However, the NRTL model, tted to the experimental data, is more accurate than the UNIQUAC model. The UNIFAC model has also predicted the overall composition with a reasonable error, though its average RMSD value is higher than those of the NRTL and UNIQUAC models, as would be expected. It is there-fore considered to be less accurate than the NRTL and UNIQUAC models in correlating the phase equilibria of the studied systems.
4. Conclusions
From the results of this work, it can be concluded that: 1. As a result of phase diagrams produced, the addi-tion of n-alkoxyethanol to sulfalone in (n-octane+ toluene) mixture leads to a decrease in the two-phase area, and reects the increase in the solubility of n-octane in the solvent mixture.
2. In multistage, counter current extraction (using sulfolane) of toluene from the (n-octane + toluene) mixture, the extract purity can evidently be
in-creased to any desired level by using a modied solvent.
3. Combination solvent systems (sulfolane+2-methoxyethanol and sulfolane + 2-ethoxyethanol), although less selective, have higher capacity compared to that of pure sulfolane. Moreover, viscosities of the combination solvent systems are very low in relation to the viscosity of pure sulfolane, which should improve the extraction eciency.
4. The solvent (25% sulfolane+75% 2-ethoxyethanol) shows a distribution coecient around unity for toluene, and for this reason, it can be used for higher recovery of aromatics at lower solvent to feed ratios and temperatures.
5. The consistency of the data was tested by the Bachman, Othmer-Tobias, Hand, and selectivity methods. All methods gave good correlations for the equilibrium distribution data.
6. The NRTL, UNIQUAC, and UNIFAC models were used to correlate the experimental data and to pre-dict the phase compositions of the ternary systems. Agreement between the predicted and experimental results was good with the three models. However, the calculated values based on the NRTL model are found to be better than those based on the UNIQUAC and UNIFAC models.
7. From the selectivity values, the separation of toluene from octane by extraction with (sulfolane + 2- ethoxyethanol) is feasible. The comparison between experimental selectivity data of (sulfolane + ethoxyethanol) with that of (sulfolane + 2-methoxyethanol) for the extraction of toluene from (toluene + octane) mixture at 293.15 K indicate that the latter is more ecient than former. Nomenclature
Abbreviations
LLE Liquid-Liquid Equilibrium
NRTL Non-Random Two Liquid activity
coecient model
RMSD Root Mean Square Deviation
UNIFAC UNIQUAC Functional Group Activity Coecients model
UNIQUAC Universal Quasi-Chemical Activity Coecient model
Symbols
a1; b1 Parameters of Bachman equation
(Eq. (1))
a2; b2 Parameters of Othmer-Tobias equation
(Eq. (2))
a3; b3 Parameters of Hand equation (Eq. (3))
a4; b4 Parameters of selectivity equation
(Eq. (4))
F Objective function
gij Parameters of the NRTL model (J
mol 1)
ki Distribution coecient
n No. of experimental points
qi Surface area parameter of the
UNIQUAC model
Qi Surface area parameter of the UNIFAC
model
ri Volume parameter of the UNIQUAC
model
Ri Volume parameter of the UNIFAC
model
Rj Correlation coecient
S Selectivity
Uij Parameters of the UNIQUAC model (J
mol 1)
w Mass fraction
xI
i Mole fraction of component i in phase
I xII
i Mole fraction of component i in phase
II
Zi Number of mole of component i in the
system Greek litters
ij Non-randomness parameters of the
NRTL model
Activity coecient
Superscript
caled Calculated value
exptl Experimental value
I Phase I
II Phase II
Subscript
i Component i
j Component j
11 Solvent in the solvent phase 12 Solvent in the octane phase
21 Octane in the solvent phase
22 Octane in the octane phase
31 Toluene in the solvent phase
References
1. Hassan, M.S., Fahim, M.A. and Mumford, C.J. \Cor-relation of phase equilibria of naphtha reformate with sulfolane", J. Chem. Eng. Data, 33, pp. 162-165 (1988).
2. Letcher, T.M., Redhi, G.G., Radlo, S.E. and Do-manska, U. \Liquid liquid equilibria of the Ternary mixtures with sulfolane at 303.15 K", J. Chem. Eng. Data, 41, pp. 634-638 (1996).
3. Kao, F.K. and Lin, W.C. \Liquid-liquid equilibria of the systems 2-methoxyethanol or 2-ethoxyethanol + n-alkanes , dodecane + 2-ethoxyethanol, and tetradecane + hexadecane", J. Chem. Eng. Data, 44, pp. 338-342 (1999).
4. Tripathi, R.P., Ram, A.R., Rao, P.B. \Liquid-liquid equilibria in ternary system toluene-n-heptane-sulfolane", J. Chem. Eng. Data, 20, pp. 261-264 (1975).
5. Lee, S. and Kim, H. \Liquid liquid equilibria of the ternary systems sulfolane + octane + benzene, sulfolane + octane + toluene and sulfolane + octane + p-xylene at elevated temperatures", J. Chem. Eng. Data, 43, pp. 358-361 (1998).
6. Rawat, B.S. and Gulati, I.B. \Liquid-liquid equilibria studies for separation of aromatics", J. Appl. Chem. Biotechnol., 26, pp. 425-435 (1976).
7. Masohan, A., Nanoti, S.M., Sharma, K.G., Puri, S.N., Gupta, P. and Rawat, B.S. \Liquid-liquid equilibria studies on hydrocarbon (c10-c20)-sulfolane systems", Fluid Phase Equilib., 61, pp. 89-98 (1990).
8. Chen, J., Mi, J., Fei, W. and Li, Z. \Liquid-liquid equilibria of quaternary and quinary systems including sulfolane at 298.15 K", J. Chem. Eng. Data, 46, pp. 169-171 (2001).
9. Awwad, A.M., Al-Dujaili, A.H., Al-Haidri, A.A. and Essa, H.M. \Liquid-liquid equilibria for sulfolane + 2-methoxyethanol + octane + toluene at 293.15 K", J. Chem. Eng. Data, 50(3), pp. 788-791 (2005).
10. Hauschild, T. and Knapp, H. \Liquid - liquid-equilibria and densities of multicomponent mixtures containing heptane-ethylbenzene in sulfolane", J. Solution Chem., 20, pp. 125-138 (1991).
11. Chen, J.M., Fei, W. and Li, Z. \Liquid liquid equi-libria of quaternary systems including cyclohexane, 1-heptane, benzene, toluene and sulfolane at 298.15 K", J. Chem. Eng. Data, 45, pp. 689-692 (2000).
12. Awwad, A.M., Al-Dujaili, A.H., Al-Haidri, A.A. and Essa, H.M. \Liquid-liquid equilibria for pseudo-ternary systems: (Sulfolane + 2-ethoxyethanol) + octane + toluene at 293.15 K", Fluid Phase Equilibria, 270, pp. 10-14 (2008).
13. Renon, H. and Prausnitz, J.M. \Local compositions in thermodynamic excess functions for liquid mixtures", AICHE J., 14, pp. 135-144 (1968).
14. Abrams, D.S. and Prausnitz, J.M. \Statistical thermo-dynamics of liquid mixtures: A new expression for the excess gibbs energy of partly or completely miscible systems", AIChE J., 21, pp. 116-128 (1975).
15. Gmehling, J., Rasmussen, P. and Fredenslund, Aa. \Vapor-liquid equilibria by unifac group contribution: Revision and extension 2", Ind. Eng. Chem. Process Des. Dev., 21, pp. 118-127 (1982).
16. Hand, D.B. \Dineric distribution", J. Phys. Chem., 34, pp. 1961-2000 (1930).
17. Othmer, D.F. and Tobias, P.E. \Tie-line correlation", Ind. Eng. Chem., 34, pp. 693-700 (1942).
18. Riddick, J.A., Bunger, W.B. and Sakano, T.K., Or-ganic Solvents: Physical Properties and Methods of Purication, Wiley-Interscience: New York (1986).
19. Wisniak, J. and Tamir, A. Liquid-Liquid Equilibrium and Extraction: A Literature Source Book, Elsevier: Amsterdam (1980-1981).
20. Hadded, P.O. and Edmister, W.C. \Phase equilibria in acetic acid-diethylketone-water system", J. Chem. Eng. Data, 17, pp. 275-278 (1972).
21. Briggs, S.W. and Comings, E.W. \Tie-line correlation and plait point determination", Ind. Eng. Chem., 35, pp. 411-415 (1943).
22. Treybal, R.A., Weber, L.D. and Daley, J.F. \The sys-tem acetone-water-1,1,2-trichloroethane. Ternary liq-uid and binary vapor equilibria", Ind. Eng. Chem., 38, pp. 817-821 (1946).
23. Francies, A.T. \Algebraic representation of thermody-namic properties and classication of solutions", Ind. Eng. Chem., 40, pp. 345-348 (1948).
24. Sorensen, M., Hoen, S. and Nagahama, K., Computer Aided Data Book of Vapor-Liquid Equilibria, Kodansha Limited, Tokyo (1975).
25. Anderson, T.F., Abrams, D.S. and Grens, E.A. \Eval-uation of parameters for nonlinear thermodynamic models", AIChE J., 24, pp. 20 (1978).
26. Rewat, E.R., Elements of Extraction, 4th Ed., McGraw-Hill Book Co., New York (2001).
Biography
Khalid Farhod obtained his PhD degree in Chemical Engineering in 2002. Since then he has worked in dierent projects in the eld of Thermodynamics, Vapor-Liquid Equilibrium, Liquid-Liquid Equilibrium. Currently, he is working at Chemical Engineering Department, Oil & Gas renery engineering branch, University of Technology, Baghdad, Iraq. He pub-lished two books under the following titles \Vapor-Liquid Equilibrium of Ternary Systems" and \Gasoline Additives (Gasoline Oxygenates)".


![Figure 12. Binodal curve and tie lines for [sulfolane + 2-ethoxyethanol (mass fraction 0.25: 0.75)] + n-octane + toluene at 293.15 K.](https://thumb-us.123doks.com/thumbv2/123dok_us/8393439.2230077/7.892.94.427.432.635/figure-binodal-curve-sulfolane-ethoxyethanol-fraction-octane-toluene.webp)