Design and implementation of weighted clustering
algorithm
Basant Kumar Verma#1, Dr.Binod Kumar*2, Dr.Pratima Gautam#3 #1
Research Scholar, AISECT University, Bhopal, India #3
Professor & Dean, CSIT Department, AISECT University, Bhopal, India
3
Professor & Director, JSPM, Pune, India 2
Abstract– the wireless communication leads effective solutions.But still there are a number of performance and security issues are remains to be fixed. In most of the wireless ad hoc infrastructures the problem of continuous connectivity and resources optimization issues are a major concern. In this context the experts are suggested to deploy the network in clustered organization for improving the network efficiency and the resource utilization. In this paper a weighted clustering algorithm is proposed for implementation and their performance evaluation. In addition of that the effect of the performance improvement is also noticed in comparison of the normal AODV routing technique. The obtained results show that the performance of the network is increases when the network nodes are functioning a clustered organization.
Keywords: wireless networks, WCA, performance improvement, traditional AODV, resource preservation
I. INTRODUCTION
In configuration point of view the networks can be wired or wireless. As compared to wired network technology the wireless networks are low cost and easy to maintain. Therefore the popularity of wireless networks are increases much rapidly as compared to wired networks. In addition of that setup and the binding up of these networks are also rapid and due to this a wide range of applications are supporting the use of wireless communication technology. Wireless networks not only support the communication it is also used for other critical computational task. Among them a much popular technology is wireless sensor network.
Wireless sensor networks are configured with the help of independent sensing nodes or devices which are capable to compute, sense the surroundings and communicate with other similar nodes. The ability of these nodes make it much expensive for various real world applications and the scientific
applications. But the key constraint is their limited resources i.e. sensing range, battery or power source and the computational and storage limits. Therefore the resource utilization in efficient manner in such network is a key issue.
If the network nodes or devices are arranged in some specific manner then their performance can be scaled and the better performance can expected. One of such kind of organized network is termed as network clustering. In network clustering the network nodes are divided in three major roles first the cluster heads, cluster clients and the gateway nodes. The cluster heads are responsible for monitoring and serving the nodes which are belongs to the particular cluster. Additionally the route discovery is also a major role of the cluster head for efficient data delivery. The client nodes are the end devices which are participating in communication and become the member of a cluster.Finally the cluster members who are members of more than one cluster is known as the cluster gateways. These nodes are responsible to bridge the communication between two clusters.
In this context the cluster heads are the super nodes. Therefore the selection of super nodes in network is a effective task. A number of techniques for efficient, effective and stable cluster formation is available. Among them the node quality of service based cluster head selection technique is a most suitable and effective technique. In this manner in this work the weighted grouping calculation is shown for bunch head choice and group arrangement. This segment the diagram of the proposed work is given. In next segment the system of the proposed weighted grouping calculation is depicted.
II. PROPOSED WORK
A. Issues Addressed
The objective of proposed clustering algorithm is to find stable and efficient clusters. Thusoptimum cluster head selection is required.Due to this the following parameters are considered.
1. Cluster head must have sufficient energy:energy of node affect network performance. Additionally low node not able to perform normal functioning therefore cluster head with low energy fails any time and existing routes become abandoned. Thus to serve better sufficient energy of nodes required.
2. Cluster head much have fresh route
information:the cluster heads are responsible for route discovery process thus need to maintain recent routing information that helps to reduce time overhead introduced duringroute discovery.
3. Cluster head communicate with maximum
possible nodes: connectivity of nodes shows ability to serve maximum nodes thushigher connective node is essential property of cluster head.
4. Cluster head having lessworkload:cluster head need to survivelong time additional load on cluster head exhaust it therefore cluster head with enough processing workloads is not suitable for cluster. 5. Stable cluster formation:The mobility of nodes
effect performance of network and can change cluster formation. Therefore need to include cluster headswith less mobility.
B. Parameter selection
Keeping in mind the end goal to locate the steady and effective system bunch head determination procedure the accompanying system obliges are proposed to incorporate for weighted grouping development.
1. Energy: the node with higher battery power able to participate in communication for long time. It is assumed at initial configuration entire nodes have full battery and can be denoted by 𝐸𝑖𝑛.
Thus the energy is 100%. After a time interval ∆𝑡 node consumes a part of energy that is∆𝑒. Therefore remain energy at sampling time 𝑡𝑠𝑎𝑚𝑝𝑙𝑒is:
𝐸𝑟𝑒𝑚𝑎𝑖𝑛 = 𝐸𝑖𝑛 − ∆𝑒
Where ∆𝑒 is consumed energy between time ∆𝑡 and∆𝑡 = 𝑡𝑠𝑎𝑚𝑝𝑙𝑒 − 𝑡𝑖𝑛𝑖𝑡𝑖𝑎𝑙
2. Lowest sequence number: freshness of routing information is identified by lowest sequence number in AODV routing. That is a part of routing table information. To find most recent routing information the lowest sequence number is involved as decision indicator. The lowest sequence number is given as𝐿𝑠.
3. Connectivity:The network is graph therefore nodes are connected with each other using links. In network usually links are known as connections. Thus degree of node connection is termed as connectivity of node. The figure 1 shows an example of connectivity. The maximum numbers of nodes connected through a node showshigher serving ability. That is represented hereusing 𝐶𝑛𝑜𝑑𝑒.
Figure 1 connectivity of node
4. Buffer length:The transmission and
receivebetween nodes are usages a memory which is known as buffer. That is used to store, process and forward data. The buffer length of a node show work load on node. Thus highly used buffer show high workload on node. In this discussion node’s buffer is represented as B. The nodes are initialized with 100% free buffer, and when node samples are collectedit is filled by M bytes thus∆𝑏 amount of buffer is consumed.The remaining buffer size is used for weight computations. The remain buffer length is denoted by:
𝐵 = 𝐵𝑖𝑛𝑖𝑡𝑖𝑎𝑙 − ∆𝑏
Where 𝐵𝑖𝑛𝑖𝑡𝑖𝑎𝑙 is initial buffer length assigned
5. Mobility:mobility of nodes impact on
performance of networks thus less mobile nodes create stable clusters. Therefore less relative mobility based nodes are selected. To compute mobility let node with initial position at time 𝑡1
is (𝑥1, 𝑦1) and after time interval ∆𝑡it changes
their position to(𝑥2, 𝑦2). The change in position
between point (𝑥1, 𝑦1) and(𝑥2, 𝑦2) calculated as.
Further the rate of change in a nodeposition with respect to time is given by.
𝑀 = 𝐷
∆𝑡
C. Weight computation
The computed parameters which are derived in previous section are measured in different scale.Therefore to normalize these values a technique is required to convert into weight. Therefore some normalization factors are involved 𝑤1, 𝑤2, 𝑤3 𝑎𝑛𝑑 𝑤4. The values of these factors are between
0-1 and regulated in such manner by which the combined weight values are also obtained between 0-1. The following formula is used for weight computation.
𝑊 = 𝑤1∗ 𝑀 + 𝑤2∗ 𝐵 + 𝑤3∗ 𝐸 + 𝐶 ∗ 𝑤4
Another factor is also involved named as𝐿𝑠 which is recent
sequence number that is used when two nodes having same weight values to decide cluster head.
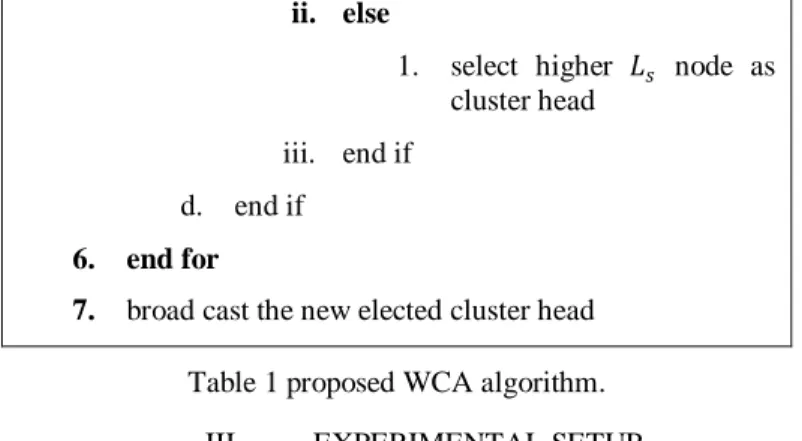
D. Proposed algorithm
The understanding about proposed algorithm’s steps for performing clustering operation in network is described in this section using table 1.
Info: number of hubs N
Yield: the bunched organize
Process:
1. A hub communicate the bunching demand
2. if demand got
a. compute versatility M, connectivity C, buffer length B, energy consumption E and recent sequence number 𝐿𝑠
b. work out weight of self
𝑊 = 𝑤1∗ 𝑀 + 𝑤2∗ 𝐵 + 𝑤3∗ 𝐸 + 𝐶 ∗ 𝑤4
3. end if
4. switch over weight to neighbour
5. for𝑖 = 1; 𝑖 ≤ 𝑛𝑒𝑖𝑔𝑏𝑜𝑢𝑟𝑠; 𝑖 + +
a. if self-weight >𝑤𝑒𝑖𝑔𝑡𝑖𝑛𝑜𝑑𝑒
i. select self as cluster head
b. elseif self-weight <𝑤𝑒𝑖𝑔𝑡𝑖𝑛𝑜𝑑𝑒
i. select higher weighted node as cluster head
c. else if self-weight = 𝑤𝑒𝑖𝑔𝑡𝑖𝑛𝑜𝑑𝑒
i. if𝑠𝑒𝑙𝑓𝐿𝑠 ≥ 𝑤𝑒𝑖𝑔𝑡𝑖𝐿𝑠𝑛𝑜𝑑𝑒
1. select self as cluster head
ii. else
1. select higher 𝐿𝑠 node as
cluster head
iii. end if
d. end if
6. end for
7. broad cast the new elected cluster head
Table 1 proposed WCA algorithm.
III. EXPERIMENTAL SETUP
This section introduces details of simulation development. Therefore it includes network environment and configuration details additionally simulation scenarios are also discussed.
A. Simulation setup
The table 2shows the parameters and simulation environments configuration for comparative analysis of clustered networks. That includes the network parameters and corresponding values for development.
Parameters Values
Channel Type Wireless Channel
Dimension 750 X 550
Antenna model Omni Antenna
Radio-propagation Two Ray Ground
No of Mobile Nodes 10, 20, 30, 40
Time of simulation 10 sec
Routing protocol AODV with WCA
Table 2 simulation setup
B. Simulation Scenarios
Simulation scenario is sequence of processes involved in simulation configuration and communication performed. Using these scenarios the performance of simulated network is also approximated. For demonstrating proposed WCA algorithm and traditional WCA algorithm following simulation scenarios are proposed.
WCA algorithms. The network generated trace is used for performance analysis and comparative study.
2. Simulation of proposed WCA algorithm:The
proposed WCA routing technique is configured in wireless sensor networkenvironment.The simulation scenario of this technique is provided in figure 2. After simulation performance of proposed WCA algorithm is compared with previous scenario’s performance in same parameters.
Figure 2 simulation screen
IV. RESULTS ANALYSIS
This segment gives a point by point discourse about the system execution got by the near examination. In this manner distinctive execution factors are assessed utilizing the created organize follows and these follows are utilized for processing the system execution.
A. Throughput
The degree or rate ofsuccessfully delivery of messages in a communication medium is known as network throughput. This data either travelled in physical or logical path ways, or it is passing through device to device.
Figure 3 comparative throughput
The measurement of throughputis given as far as bits every second (BPS) and here and there in information bundles per
vacancy. Figure 3 shows similar throughput of both the weighted grouping calculations. Red line of graph indicates throughput of proposed system and green line show customary WCA execution. As per execution of proposed system, it devours higher transfer speed when contrasted with conventional WCA calculation. Moreover execution of both the system with expanding number of hubs is given in figure 4. The similar execution with expanding number of hubs demonstrates proposed weighted bunching calculation out performs as for customary WCA. In this way proposed strategy is productive and adequate for enhancing system execution in specially appointed systems.
Figure 4 comparative throughputs
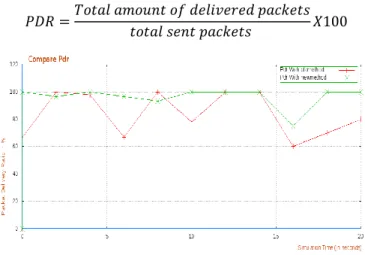
B. Packet delivery ratio
The ratio of total packet transmitted and successfully delivered packets to target network node is called packet delivery ratio. The computation of PDR is provided using following formula in terms of percentage:
𝑃𝐷𝑅 =𝑇𝑜𝑡𝑎𝑙 𝑎𝑚𝑜𝑢𝑛𝑡 𝑜𝑓 𝑑𝑒𝑙𝑖𝑣𝑒𝑟𝑒𝑑 𝑝𝑎𝑐𝑘𝑒𝑡𝑠
𝑡𝑜𝑡𝑎𝑙 𝑠𝑒𝑛𝑡 𝑝𝑎𝑐𝑘𝑒𝑡𝑠 𝑋100
Figure 5 comparative PDR
conventional WCA directing convention. Furthermore the examinations with expanding number of hubs are likewise performed for both WCA calculations that are shown in figure 6. As per assessed execution of both steering convention, the proposed system outperform concerning the customary WCA procedure.
Figure 6 comparative PDR (number of nodes)
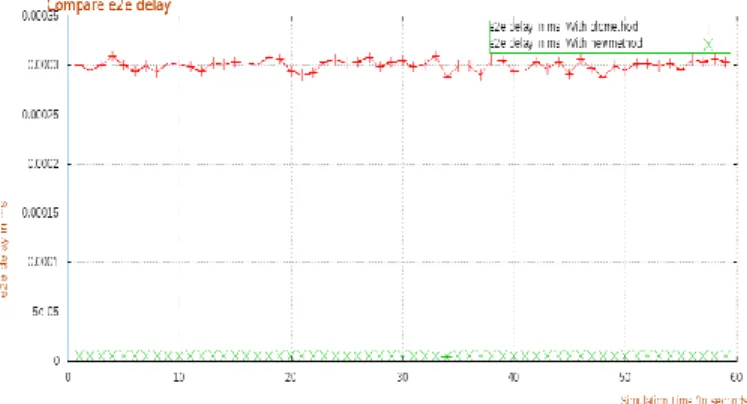
C. End to End Delay
Between sender and receiver communication leads a time difference for sending and receiving the data packets successfully. The amount of time to deliver a data packet to network device is termed as end to end delay. The end to end delay of routing protocols demonstrates communication cost of network. The comparative E2E delay of both WCA is given in figure 7 and 8. In first diagram figure 7 X axis contains simulation time and Y axis includes end to end delay with respect to simulation time. The measured delay of network is described here in terms of milliseconds.The red line in figure 7, shows E2E delay of traditional WCArouting and green line shows performance of proposed WCA algorithm.
Figure 7 comparative End to end delay
As indicated by exploratory outcomes conventional procedure's E2E delay is higher as for proposed WCA strategy. Besides it the execution with expanding number of hubs is additionally exhibited in figure 8. Acquired outcomes with expanding number of hubs as far as end to end postpone demonstrates that the proposed WCA steering produces less E2E delay when contrasted with conventional WCA approach.
Consequently proposed procedure is proficient and satisfactory for security associations planned.
Figure 8 End to end delay (number of nodes)
V. CONCLUSION AND FUTURE WORK
This paper provides a detailed study about routing protocols supported by wireless sensor networks and mobile ad hoc networks. Moreover it cluster based routing is also explained in detailed with their advantage and limitations. In investigation it is found that the clustering of network enhances the performance of network. In this context a new weighted clustering is proposed. That technique includes the different network and node’s properties for selection of efficient cluster head. This algorithm is implemented using NS2 network simulation. The main advantage of the presented weighted clustering algorithm is, it able to scale network performance. That is reflected on the evaluated performance parameters in comparison of the traditional AODV routing in wireless network scenarios. According to obtained results performance of proposed WCA technique it is efficient as compared with traditional WCA technique. The simulation performance demonstrates after implementation of the proposed clustering technique throughput of network, and packet delivery ratio of the network is improved. Additionally the end to end delay of network is reduced as compared to traditional WCA protocol. Thus the designed simulation based routing algorithm is able to improve network performance.
REFERENCES
[1] Basant Kumar Verma, Dr. Binod Kumar, “A Survey on WSN Routing and Routing Attacks”, International Journal of Research in Computer Science and Management Vol. 1(2), July 2014
[2] Basant Kuamr Verma, Dr. Binod Kumar, “A Secure AdHoc Wireless Clustering Scheme for Improving Security”, International Journal on Recent and Innovation Trends in Computing and Communication Volume: 3 Issue: 3, March 2015
Engineering and Electronics. Page 1, ISSN 2319-376X, VOl : 3 ISSUE : 5 (Sept-Oct’14)
[4] G. Nivetha, “Energy Optimization Routing Techniques in Wireless Sensor Networks”, International Journal of Advanced Research in Computer Science and Software Engineering, Volume 2, Issue 7, July 2012
[5] Jamal N. Al-Karaki, Ahmed E. Kamal, “Routing techniques in wireless sensor networks: A Survey”, IEEE wireless communications volume 11, pp.6-28, December 2004.
[6] Lindsey, S.; Raghavendra, C.S., “PEGASIS: Power-Efficient Gathering in Sensor Information Systems”. In Proceedings of the Aerospace Conference, Big Sky, MT, March, 2002; pp. 1125–1130.
[7] Th. Arampatzis, J. Lygeros, and S. Manesis, “A Survey of Applications of Wireless Sensors and Wireless Sensor Networks”, Proceedings of the 13th Mediterranean Conference on Control and Automation Limassol, Cyprus, June 27-29, 2005.
[8] HarmanjitKaur, “Survey on Routing Protocols of Wireless Sensor Networks”, International Journal of Advanced Research in Computer Science and Software Engineering, Volume 5, Issue 4, April 2015
[9] S.R.BoselinPrabhu, S.Sophia, “A Survey of Adaptive Distributed Clustering Algorithms for Wireless Sensor Networks”, International Journal of Computer Science & Engineering Survey (IJCSES) Vol.2, No.4, November 2011
[10] Prashant Kumar Maurya, Gaurav Sharma, Vaishali Sahu, Ashish Roberts, MahendraSrivastava, “An Overview of AODV Routing Protocol”, International Journal of Modern Engineering Research (IJMER), Vol.2, Issue.3, May-June 2012 pp-728-732
[11] RajuDutta, Shishir Gupta, Mukul K. Das, “Power Consumption and Maximizing Network Lifetime during Communication of Sensor Node in WSN”.
Basant Kumar Verma obtained his Master degree from Department of Computer Science, Guru Ghasidas University, Bilaspur, Chhattisgarh, India in 2003. He is currently a Ph. D. student under the supervision of Dr. Binod Kumar (Guide) & Dr. PratimaGautam (Co-Guide). His research is centered on development of cluster-based intrusion detection system.
Dr. Binod Kumar is Professor & Director at Jayawant Institute of Computer Applications (JSPM's Group), affiliated to SavitribaiPhule Pune University, India. He is having around 19.5 years of experience in various capacities in research, teaching and academic administration. He has obtained PhD (Computer Sc.) in 2010, MCA (NIT Jamshedpur) in 1998 and M.Sc.(BHU) in 1995. He worked as Associate Professor at School of Engineering and Computer Technology, Quest International University,
MALAYSIA .
He has been an evaluator for Ph.D. dissertations of various Universities like Sardar Patel University (Gujarat), Bharathiar University (Coimbatore), Karpagam University (Coimbatore), Banasthali University (Rajasthan).He served as Conference Chairman Committee Member at QUAESTI 2015, The 3rd Virtual Multidisciplinary Conference, Slovakia.
He is Advisory Board Member of RNB Global University, Rajasthan, India. He is reviewer of Journals like Elsevier,
SpringerPlus and TPC of various IEEE sponsored
conferences. He is Editorial Board member of nearly 45 International Journals. He has been associated with Technical Program Committee member (TPC) of nearly 60 International Conferences in India and abroad. He isSenior Member of
IEEEComputer Society.He has published nearly 40 papers in International and National Journals. His areas of interest are Data Mining, Soft Computing and Machine Learning.