Open Access
Research
Response coefficient analysis of a fed-batch bioreactor to dissolved
oxygen perturbation in complementary cultures during PHB
production
Pratap R Patnaik
Address: Institute of Microbial Technology, Sector 39-A, Chandigarh-160036, India
Email: Pratap R Patnaik - [email protected]
Abstract
Background: Although the production of poly-β-hydroxybutyrate (PHB) has many biological, energetic and environmental advantages over chemically synthesized polymers, synthetic polymers continue to be produced industrially since the productivities of fermentation processes fr PHB are not yet economically competitive. Improvement of a PHB fermentation requires good understanding and optimization under the realistic conditions of large bioreactors.
Laboratory-scale studies have shown that co-cultures of Ralstonia eutropha and Lactobacillus delbrueckii generate better fermentation efficiencies than R. eutropha alone. In large bioreactors, incomplete dispersioin and perturbations in the dissolved oxygen (DO) concentration, both of which affect the fermentation, have to be considered. This study analyzes the effect of DO fluctuations on bioreactor performance for both ideal and optimally dispersed broths.
Results: Response coefficient analysis was employed to obtain quantitative information on the effect of DO perturbations on different variables. Three values of the Peclet number (Pe) cheracterized three levels of dispersion: Pe = 0.01 for nearly complete dispersion, Pe = 20 for optimum dispersion and Pe = 60 for insufficient dispersion. The response coefficients (RCs) of the pairs of bacterial concentrations and the main substrates, glucose and ammonium chloride, showed contrasting variations with time. Lactate, a critical intermediate, and PHB had similar RC profiles but those of lactate were one to two orders of magnitude larger than other RCs. Significantly, the optimum Pe also resulted in the largest RCs, suggesting a balance between productivity and reactor stability.
Conclusion: Since R. eutropha requires oxygen for its growth whereas L. delbrueckii does not, fluctuations in the DO concentartion have a strong influence on the fermentation. Apart from this, the mechanism of PHB biosynthesis indicates that control of lactate is a critical determinant of fermentation efficiency. The RC profiles indicate that, under non-ideal conditions, a compromise may be required between PHB formation and reactor stability, especially in the latter half of the process.
Background
Under conditions adverse to cell growth, many bacteria
synthesize polyhydroxyalkanoates (PHAs) as energy stor-age devices. Poly-β-hydroxybutyrate (PHB) is possibly the
Published: 27 March 2008
Journal of Biological Engineering 2008, 2:4 doi:10.1186/1754-1611-2-4
Received: 14 September 2007 Accepted: 27 March 2008
This article is available from: http://www.jbioleng.org/content/2/1/4 © 2008 Patnaik; licensee BioMed Central Ltd.
most prominent member of the PHA family. There is growing commercial interest in PHB since many of its physical, chemical and rheological properties are compa-rable to those of widely used polymers such as polyethyl-ene and polypropylpolyethyl-ene [1]. While the latter polymers are synthesized chemically from petroleum sources under harsh conditions, PHB can be synthesized microbially under mild conditions. In addition, PHB can be readily biodegraded, whereas petroleum-based polymers are dif-ficult to degrade and therefore create disposal problems [2]. These advantages makes PHB a potential replacement for petroleum-based polymers in a variety of applications such as food packaging films, biodegradable carriers for medicines and insecticides, disposable cosmetic products and absorbable surgical sutures [3,4].
Bacteria such as Ralstonia eutropha (formerly Alcaligenes eutrophus), Alcaligenes latus and Azotobacter vivelandii may be induced to synthesize PHB by imposing a chemical stress. This is normally done by depriving the organism of a nutrient such as nitrogen or phosphorus or sulfur, which are required for cell growth [2-4]. Of these, nitrogen is the preferred stress-creator [5-8], but recent work [9] points to the possibility of limiting the supply of phosphorus to generate PHB. Even though a shortage of nitrogen induces PHB synthesis, an excessive lack of this nutrient retards cell growth [5] and promotes depolymerization of PHB [10]. In addition, there should be sufficient amount of a carbon source at all times. However, similar to nitrogen, an abundance of carbon is detrimental to the growth of R. eutropha [5]. Therefore, the proper supply of these two substrates is critical to the overall production of PHB.
The complexity of the metabolic network [2,3] and the involvement of carbon and nitrogen suggest that the feed rates of these substrates may have to be varied nonlinearly with time. This requirement is best provided by fed-batch fermentation. While the two feed rates for fermentations based on R. eutropha alone have been varied either through on-line control based on glucose or PHB or the CO2 evolution rate [11,12] or through discrete changes decided in advance [6-8], the rates where two cultures are employed have been controlled through the lactate con-centration [13], a key intermediate in a two-culture sys-tem. Since such a mixed culture fermentation has been studied here, it will be described later in detail.
While the effects of manipulating carbon and nitrogen supply have been analyzed adequately [6-9,11], the role of dissolved oxygen (DO) has received less attention. Nev-ertheless, the importance of maintaining a proper level of the DO concentration has been recognized by many investigators [5-8,14] without quantitatively modeling its effects. Most of these studies have implicitly accommo-dated Kim's [15] observation that a low DO concentration
favors PHB formation but inhibits cell growth, and main-tained DO at around 30% of saturation. The role of DO in a metabolic context has been discussed in section 4, and it becomes more significant when two complementary cul-tures are used. In large (production-scale) bioreactors, dis-turbances in the DO level are more likely and more difficult to control than those in the biomass and the liq-uid substrates [16,17]. Since, as explained below, DO plays as important a role as carbon and nitrogen, sensitiv-ity of the fermentation to a perturbation in the DO con-centration has considerable practical importance and is therefore the subject of the present work.
Description of the fermentation
R. eutropha is the most widely used organism for PHB pro-duction because it is easy to cultivate, its metabolism is well understood and it can accumulate large amounts of PHB (up to 80% of dry cell mass [3,4]) inside the cells. As mentioned in the Introduction, the synthesis of PHB may be triggered by stress created by a shortage of nitrogen or phosphorus and adequate supply of carbon. However, an exceedingly low concentration of nitrogen and a prepon-derance of carbon inhibit growth [5] and promote degra-dation of the polymer [10]. Therefore, the supply of these two substrates have to be controlled as the fermentation progresses, and this is best achieved by fed-batch opera-tion [6-9].
Fructose and glucose are the common carbon sources, and either ammonium chloride or ammonium sulfate pro-vides nitrogen. The fermentation is aerobic and the oxy-gen content of the broth influences PHB formation. A low DO concentration leads to an excess of reduced co-enzymes (NADH and NADPH), thus enabling a higher carbon flux directed toward PHB synthesis for reoxidation of these co-enzymes [18]. However, a severe limitation of oxygen causes formation of intermediates of the Krebs cycle that inhibit the formation of PHB [2].
Now, L. delbrueckii is anaerobic whereas R. eutropha is aer-obic. In a fed-batch system, L. delbrueckii is introduced at the start so as to utilize glucose and produce lactate. This requires a low concentration of DO. After sufficient amount of lactate has been generated, the reactor is inoc-ulated with R. eutropha. At this stage there are conflicting requirements. R. eutropha requires a high DO concentra-tion to metabolize lactate, where producconcentra-tion of lactate by L. delbrueckii requires a low DO concentration. Thus, con-trol of lactate concentration by manipulating DO becomes a critical factor.
The DO concentration is usually controlled by varying the stirring speed or the flow rate of the gas [5,6,11,12]. The implication here is that faster agitation or flow promotes better gas-to-liquid mass transfer of oxygen and thereby increases the DO level. A change in the DO level can occur due to many reasons such as a disturbance in the gaseous feed stream, fluctuations in the stirring speed and a change in the rheology of the broth. These effects become reflected in the DO concentration only after transfer of oxygen into the liquid phase. The involvement of more than one variable in determining the DO concentration and the intervention of inter-phase transport resistance may complicate, delay and attenuate the sensing of a change in the DO concentration after the occurrence of the source of disturbance. Since the DO is usually moni-tored and used as a measure of oxygenation, sensitivity of the fermentation to a perturbation sensed in the DO con-centration is important for its performance. The sensitivity method and the fermentation model on which it is based are described next.
Mathematical modeling
The analysis presented here is based on the fed-batch fer-mentation with L. delbrueckii and R. eutropha, studied by Tohyama et al. [21,22] and modeled in their latter work. They resolved the problem of conflicting oxygen require-ments by maintaining a low DO concentration (0.5 ppm) initially to favor L. delbrueckii and then increasing this (3.0 ppm) after inoculation by R. eutropha. Thereafter, since both bacteria have to function in tandem, the DO was alternated between the two levels every hour. The fermen-tation was run for 30 h.
In the absence of flow terms and for a completely homo-geneous broth, Tohyama et al. [21,22] proposed the equa-tions presented below.
The rate of growth of L. delbrueckii is
and that of R. eutropha has a similar form:
Glucose is utilized by L. delbrueckii at the rate
Lactate is the product of glucose consumption and it is the carbon substrate for R. eutropha, so its net rate of forma-tion is
The specific rates in Eqs. (1)–(4) have the forms given below.
σ1 (S, P, O) = αμ1 (S, P, O) + β(S, O) (7)
Note that the specific rate of lactate formation, Eq. (7), has a constitutive component, β, and a growth-related compo-nent, αμ1. This arises because glucose is utilized by L. del-brueckii for growth as well as lactate synthesis. The constitutive rate has the form
Similar to Eqs. (1)–(3), the rate of consumption of the nitrogen source is
and that of PHB formation is
r dX
dt S P O X
1= 1 =m1( , , ) 1 (1)
r dX
dt N P O X
2 = 2 =m2( , , ) 2 (2)
r dS
dt S P O X
S = = −n1( , , ) 1 (3)
r dP
dt S P O X N P O X
P = =s1( , , ) 1−n2( , , ) 2 (4)
m1( , , )S P O mm O S1( ) 1 K S S
P Pm
n
=
+ − ⎛ ⎝
⎜ ⎞ ⎠
⎟ (5)
n1( , , ) m1( , , ) s1 ( )
( , , )
/ ( )
S P O S P O
YX1/S O
S P O YP S O
= + (6)
m2 m 2
2
( , , ) ( )
/
N P O m O P
K P P P K i
N K N N
=
+ + ⎛
⎝ ⎜ ⎜
⎞ ⎠ ⎟ ⎟ +
⎛ ⎝
⎜ ⎞ ⎠ ⎟ (8)
n2 m2
2
( , , ) ( , , )
/ ( )
N P O N P O
YX P O
= (9)
b(S,O) bm O S( ) K S S
=
+ (10)
r dN
dt N P O X
The specific rates in Eqs. (11) and (12) follow
and
While Tohyama et al. [22] have discussed the model in detail, certain salient features may be noted here. Equa-tion (11) might imply that nitrogen is consumed by R. eutropha and not by L. delbrueckii. This may appear implausible. In fact, Eq. (11) is a practical approximation based on the experimental observations [21,22] that ammonia concentration changed little during the cultiva-tion of L. delbrueckii (X1) compared to the changes gener-ated by R. eutropha (X2). This observation is also reflected in the absence of a nitrogen term for μ in Eq. (5). Equa-tions (8) and (13) similarly express the observaEqua-tions that cell growth increased with ammonium concentration while PHB was favored by reducing the ammonium con-centration.
Lactate is the critical intermediate linking the growth of L. delbrueckii and R. eutropha. As the model shows, the car-bon substrate (glucose) and DO concentrations control the production of lactate whereas ammonium sulfate and DO control its consumption. This establishes the central role of DO and consequently the importance of any per-turbations in this concentration.
The degree of dispersion in a stirred reactor may be char-acterized by the Peclet number
Pe = uL/De (15)
where the 'characteristic length' L is usually the diameter of the vessel. For finite dispersion, the kinetics of Eqs. (1)–(4), (11) and (12) may be incorporated into the mass balances for a fed-batch bioreactor [23,24] to obtain the model presented below.
Here F = FS + FN is the total inflow rate. The total inflow enters as a term in all equations since it dilutes the concen-trations appropriately. However, only Eqs. (20) and (21) contain the inflow (or feed) concentrations because the flow stream contains only the carbon (S) and nitrogen (N) substrates.
Equations (16)–(22) are subject to the following initial and boundary conditions:
t = 0: X1 = X10, X2 = X20, P = P0 = 0, Q = Q0 = 0, S = S0, N =
N0, V = V0 (23)
z = 1: X1 = X2 = P = Q = 0, S = Sf, N = Nf (25)
Given that z = 0 corresponds to the central axis of the reac-tion vessel and z = 1 the periphery at the point of intro-duction of the feed stream, Eq. (24) expresses symmetry around the impeller shaft.
In their experiments, Tohyama et al. [22] applied discrete injections of glucose and ammonium to control lactate concentration at a set point. This, however, does not gen-erate a truly optimum feed policy, which can be derived by Pontryagin's maximum principle. However, the maxi-mum principle is susceptible to singularities that necessi-tate difficult manipulations [12]. The chemotaxis algorithm provides a simpler, more practical alternative that generates solutions close to the optimum solution, and it has been effective in improving a fed-batch PHB
fer-r dQ
dt N X
Q= =s2( ) 2 (12)
s2 N q mk N
k N N ( )=
+ (13)
n3 m2
2
( , , ) ( , , )
/ ( )
N P O N P O
YX N O
= (14) V F X t X z Pe X z V F r ∂ ∂ = ∂∂ − ∂ ∂ +
1 2 1
2 1 1 (16)
V F X t X z Pe X z V F r ∂ ∂ = ∂∂ − ∂ ∂ +
2 2 2
2 2 2 (17) V F P t P z Pe P z V F rP
∂ ∂ = ∂∂ − ∂ ∂ + 2 2 (18) V F Q t Q z Pe Q z V F rQ
∂ ∂ = ∂∂ − ∂ ∂ + 2 2 (19) V F S t S z Pe S z V F r FC F S S f ∂ ∂ = ∂∂ − ∂ ∂ + + 2 2 (20) V F N t N z Pe N z V F r FN F N N f ∂ ∂ = ∂∂ − ∂ ∂ + + 2 2 (21) dV
dt =F (22)
z X z X z P z Q z S z N z = ∂ ∂ = ∂∂ = ∂∂ = ∂∂ = ∂∂ = ∂∂ =
0: 1 2 0
mentation with R. eutropha alone [24]. Here the feed rate (of either substrate) is expressed as a polynomial function of time:
For a fully dispersed broth, De → ∞ and hence Pe → 0. When there is no dispersion, called segregated or plug flow, De → 0 and Pe →∞. Both these are idealized limits. Since production-scale reactors have finite non-zero val-ues of Pe, the effect of Pe on the sensitivity is part of the current analysis. Given a value of Pe, the mass balances for a fed-batch bioreactor may be written by incorporating the kinetics presented above.
The complete model was solved numerically for Pe = 0.01, 20 and 60, using the parameter data in Table 1. The signif-icance of these choices is explained later. Then the DO value was perturbed both positively and negatively, and the model solved again. Let yl, and yu denote the
(time-dependent) outputs of a variable y at the lower, the aver-age and the upper values of DO.
The effect of a disturbance in the DO level on an output variable y may be quantified by the response coefficient, defined as [25]
Using the perturbed values mentioned above, Eq. (27) may be approximated as [26]
where h is the distance between two consecutive values of the DO concentration. Since Eqs. (27) and (28) generate dimensionless numbers, it becomes possible to compare the responses of different variables. Obviously, the higher the coefficient the more sensitive is that variable.
Response coefficient analysis
Previous studies, for both PHB [24] and other fermenta-tions [20,27], have shown that a finite optimum degree of dispersion generated higher amounts of the product than complete dispersion or complete segregation. For fed-batch fermentation with R. eutropha, the productivity of PHB was maximum for dispersion corresponding to Pe ≈ 20 [24]. Therefore, sensitivity of the fermentation to DO perturbations was determined for this value of Pe and
compared with the two asymptotic limits corresponding to Pe = 0.01 and Pe = 60. The lowest limit corresponds to a case of complete dispersion that is typical of laboratory-scale bioreactors such as that used by Tohyama et al. [21], while the latter extreme (Pe = 60) indicates the absence of any significant dispersion, as in segregated flow. (Ideally, Pe = 0 for complete dispersion but this created numerical difficulties, and hence a small finite value of Pe was used). To calculate the response coefficients according to Eqs. (16) and (17), perturbations were applied to the DO con-centration in both the lean phase (DO = 0.5 ppm) and the rich phase (DO = 3 ppm). Disturbances during the lean
F ti ak t T k i S or N
k M
( )= ( / ) ; =
=
∑
0 (26)y
dy O
y y O
= ∂
∂( ) (27)
dy O u
y
y y h
h
y y y h
h
y y y
h y
= ⎡ − − ⎣
⎢ ⎤ ⎦
⎥ +⎡ − + ⎣
⎢ ⎤ ⎦
⎥ +⎡ − ⎣ ⎢ ⎤
⎦ ⎥
1 2 2 2
1
2 2 21
1
(28)
Table 1: List of parameter values and initial conditions [22].
Variable Units Value
α _ 1.23
βm h-1 1.8
μm1 h-1 0.375
μm2 h-1 0.734
Ki g L-1 2.5
kN g L-1 0.05
KN g L-1 0.146
KP g L-1 6.0
KS g L-1 35.8
N _ 1.0
Pm g L-1 42.9
qm h-1 0.687
YP/S g g-1 0.698
YX2/N g g-1 2.41
YX2/P g g-1 0.204
YX1/S g g-1 1.0
X10 g L-1 0.5
X20 g L-1 0.055
P0 g L-1 0.0
N0 g L-1 0.4
Nf g L-1 0.4
Q0 g L-1 0.0
S0 g L-1 10.0
Sf g L-1 10.0
a1 h-1 0.1605
a2 (ppm)-1 1.4967
a3 h-1 0.3395
b1 g g-1 0.2451
b2 (ppm)-1 3.584
b3 g g-1 0.6909
c1 h-1 3.3309
c2 (ppm)-1 3.2574
c3 h-1 1.6691
d1 h-1 - 8.241
d2 (ppm)-1 6.5279
d3 h-1 0.7469
f1 g g-1 2.36
f2 (ppm)-1 5.2653
f3 g g-1 0.1909
g1 g g-1 0.7772
g2 (ppm)-1 3.3097
phase did not have a significant effect on the performance, i.e. the response coefficients were close to zero. So the results presented are all for the rich phase. When the DO concentration is 0.5 ppm, the coefficients may be low because this phase is mainly to replenish lactate by reduc-ing oxygen availability to favor glucose metabolism by L. delbrueckii. Ralsonia, the oxygen-dependent partner in the mixed culture, is less active during this phase.
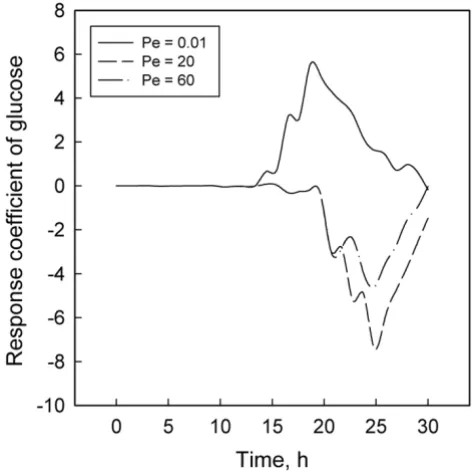
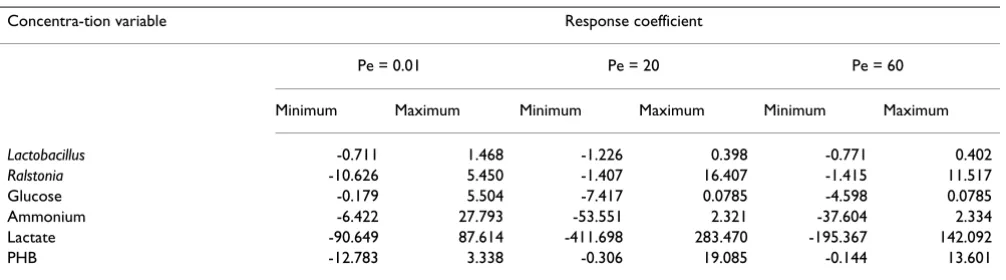
Figures 1 to 6 display the temporal variations of the response coefficients to a perturbation in the DO concen-tration for each of the three values of Pe considered. It is instructive to analyze these in four groups. First consider the two bacterial species. Their response coefficients (Fig-ures 1 and 2) show opposite trends at each Peclet number. This difference may be attributed to the dissimilar affini-ties of the organisms to oxygen. While L. delbrueckii grows in the absence of oxygen, R. eutropha is an aerobe and thus requires DO. For quantitative comparisons, the minimum and maximum coefficients for each concentration varia-ble and each Peclet number have been compiled in Tavaria-ble 2. The coefficients for L. delbrueckii and R. eutropha also differ by an order of magnitude, and this difference is con-tinued between the two principal substrates, glucose and ammonium sulfate (Figures 3 and 4).
Like R. eutropha vis-à-vis L. delbrueckii, ammonium sul-fate is present in much smaller concentrations than glu-cose, and their response coefficients too differ by an order of magnitude (Table 2). These differences and their
con-trasting profiles (Figures 3 and 4) illustrate the dynamic effects of the metabolic roles of oxygen and nitrogen in the PHB synthesis network. L. delbrueckii converts glu-cose first to pyruvate and then to lactate by utilizing NADPH. R. eutropha metabolizes this lactate to
acetyl-Response coefficient plots for glucose Figure 3
Response coefficient plots for glucose. Response coefficient plots for L. delbrueckii
Figure 1
Response coefficient plots for L. delbrueckii.
Response coefficient plots for R. eutropha Figure 2
CoA, which serves as a precursor for PHB through a sequence of three enzymatic reactions [2,3,13]. Under heterotrophic conditions, R. eutropha generates its ATP requirement through the TCA cycle. With lactate, this occurs either through a glyoxylate shunt or from pyruvate
via a phosphoenolpyruvate synthase reaction [2,13]. At high ammonium concentration, the NADPH is preferen-tially utilized for the reaction from α-ketoglutarate to glutamic acid and glutamin, thus reducing the availability of NADPH for PHB synthesis. Limiting the ammonium concentration blocks the synthesis of amino acids, decreases the flow of NADPH through the glyoxylate pathway, and thereby facilitates PHB synthesis.
The effect of DO is similar to that of ammonium. A low DO concentration also leads to an excess of NADH and NADPH, thus promoting PHB formation [13]. However, a severe shortage of oxygen in the medium retards PHB biosynthesis [28], just as strong starvation of nitrogen inhibits cell growth [5] and thus diminishes the PHB con-centration. By contrast, glucose utilization by L. delbrueckii is relatively unaffected by oxygen availability. Moreover, while nitrogen favors cell growth up to small concentra-tions and is then inhibitory, glucose and fructose have a positive effect over a much wider range before inhibition begins [5,14].
These differences may explain partly the contrasting pro-files for glucose (Figure 3) and ammonium sulfate (Figure 4). Another factor that may account for the differences between Figures 1 and 2 and between Figures 3 and 4 is the difference in the magnitudes of the pair of concentra-tions in each group. According to Table 1 and the concen-tration profiles obtained by Tohyama et al. [21,22], L. delbrueckii and glucose have much larger concentrations
Response coefficient plots for PHB Figure 6
Response coefficient plots for PHB. Response coefficient plots for ammonium sulfate
Figure 4
Response coefficient plots for ammonium sulfate.
Response coefficient plots for lactate Figure 5
than R. eutropha and ammonium sulfate. Therefore a dis-turbance in the DO concentration is likely to have a smaller effect on the former two than on the latter pair of variables. The possibility of large variables to function effectively as inertial sinks for disturbances is supported by similar observations with Klebsiella oxytoca [29] and Escherichia coli [30] cultures.
While the response coefficients of lactate (Figure 5) and PHB (Figure 6) qualitatively follow the same trends as the other variables, it is significant that the coefficients of lac-tate are one to two orders of magnitude larger than those of others. As explained before, lactate is produced by L. delbrueckii and consumed by R. eutropha. Tohyama et al. [21,22] observed that as the initial concentration of lac-tate increases, so does its inhibitory effect on both L.
del-brueckii and R. eutropha. So they recommended
maintaining a low lactate concentration at about .
Now, recall that glucose and DO concentrations control the production of lactate while DO and ammonium sul-fate control its consumption. Given that (a) DO affects the production and the consumption of lactate but Lactobacil-lus is anaerobic whereas Ralstonia is aerobic and (b) DO and ammonium have similar but complex metabolic effects [5,13,28], these results underline the pivotal role of lactate in establishing a link between metabolic flows and their destabilization by an external perturbation. This relation is analogous to the role of acetate in E. coli fer-mentations [30], where similar observations enhance the credibility of a mechanistic basis for bioreactor sensitivi-ties.
In addition to regulating the effect of DO concentration on the dynamics of lactate production and consumption, the degree of dispersion is also an important determinant of the balances between two other pairs of processes: (i) The synthesis and degradation of PHB and (ii) the
forma-tion and consumpforma-tion of acetate. Under strong dispersion (Pe → 0), the nitrogen and carbon substrates are freely available throughout the broth. Easy access to nitrogen is detrimental to PHB synthesis but favorable to acetate for-mation [2,3,31]; acetate suppresses cell growth, thus fur-ther lowering the overall concentration of PHB and rendering it more sensitive to DO perturbations (Figure 6). At the other extreme, weak dispersion (signified by a large Pe) segregates the cells and the substrates; while restricted access to nitrogen promoted PHB synthesis, the overall biomass growth is poor because of the lack of availability of glucose. The net result is again a low bulk concentration of PHB, in spite of a high intra-cellular con-centration [3,32].
These considerations imply that maximization of PHB yield requires an optimum finite dispersion, which is attained at Pe = 20 [24]. However, as Fig. 6 shows, the response coefficients at Pe = 20 turn out to be larger than at Pe = 0.01 and Pe = 60. Thus, in a production situation a pragmatic approach might require operating at a sub-optimal Pe to improve reactor stability even at the cost of some productivity loss. A similar observation for another two-substrate system, Klebsiella oxytoca cultivated on glu-cose and lactose [29], suggests that this kind of compro-mise between productivity and sensitivity may have general validity. The existence of a finite value of Pe that offers such a balance has significant practical utility as it enables the naturally present incomplete dispersion in large bioreactors to be gainfully exploited.
Conclusion
In view of its strong potential for many applications where petroleum-based chemically synthesized polymers are currently used, the microbial product of PHB by fed-batch fermentation was analyzed. This was done through a response coefficient analysis of a co-culture of L. del-brueckii and R. eutropha. Since the former is anaerobic and the latter is aerobic, dissolved oxygen (DO) has a crucial role in the fermentation.
K KP i Table 2: Minimum and maximum values of the response coefficients.
Concentra-tion variable Response coefficient
Pe = 0.01 Pe = 20 Pe = 60
Minimum Maximum Minimum Maximum Minimum Maximum
Lactobacillus -0.711 1.468 -1.226 0.398 -0.771 0.402
Ralstonia -10.626 5.450 -1.407 16.407 -1.415 11.517
Glucose -0.179 5.504 -7.417 0.0785 -4.598 0.0785
Ammonium -6.422 27.793 -53.551 2.321 -37.604 2.334
Lactate -90.649 87.614 -411.698 283.470 -195.367 142.092
In large bioreactors the broth is less than perfectly dis-persed and perturbations in oxygen supply are possible. Their effects were studied through the response coeffi-cients of six main variables: glucose, ammonium sulfate, lactate, PHB and the bacteria. The coefficients differ widely among the variables. In particular, the differences between the two substrates and between the two organ-isms have similarities that may be related to the mechanis-tic basis of PHB formation.
Lactate is a critical intermediate in a two-culture fermenta-tion for PHB. Its response coefficients were one to two orders of magnitude larger than those of other concentra-tions. Like lactate, ammonium sulfate also had large response coefficients, suggesting that small concentra-tions are more sensitive to a DO perturbation than large concentrations.
Results for three different degrees of dispersion showed that the dispersion at which PHB production is highest and the lactate concentration lowest (Pe = 20) [24] also makes the fermentation highly sensitive. Therefore, realis-tically it may be preferable to operate slightly sub-opti-mally to ensure greater stability.
Nomenclature
De effective dispersion coefficient (cm2 h-1)
FS inflow rate of glucose (L h-1)
FN inflow rate of ammonium sulfate (L h-1)
Ki inhibition constant for μ2 (g L-1)
kN reaction rate constant for PHB (g L-1)
KN Monod constant for μ2 with respect to ammonium (g L-1)
KP Monod constant for μ2 with respect to lactate (g L-1)
KS Monod constant for μ1 (g L-1)
L characteristic dimension of bioreactor (cm)
n empirical exponent (-)
N concentration of ammonium sulfate (g L-1)
Nf feed concentration of ammonium sulfate (g L-1)
O concentration of dissolved oxygen (ppm)
P concentration of lactate (g L-1)
Pm limiting concentration of lactate (g L-1)
Pe Peclet number (-)
Q concentration of PHB (g L-1)
qm maximum specific PHB production rate (h-1)
r1 rate of growth of L. delbrueckii (g L-1 h-1)
r2 rate of growth of R. eutropha (g L-1 h-1)
rN rate of consumption of ammonium sulfate (g L-1 h-1)
rP net rate of formation of lactate (g L-1 h-1)
rQ rate of formation of PHB (g L-1 h-1)
rS rate of consumption of glucose (g L-1 h-1)
S concentration of glucose (g L-1)
Sf feed concentration of glucose (g L-1)
t elapsed time (h)
T duration of the fermentation (h)
u mean velocity of fluid in bioreactor (cm h-1)
V volume of the broth (L)
X1 concentration of L. delbrueckii (g L-1)
X2 concentration of R. eutropha (g L-1)
YQ/P yield coefficient for PHB with respect to lactate (g g-1)
YP/S yield coefficient for lactate with respect to glucose (g g-1)
YX1/S yield coefficient for L. delbrueckii with respect to glu-cose (g g-1)
YX2/N yield coefficient for R. eutropha with respect to ammonium (g g-1)
YX2/P yield coefficient for R. eutropha with respect to lactate (g g-1)
αempirical constant (-)
βconstitutive component of σ1 (h-1)
μ1 specific rate of growth of L. delbrueckii (h-1)
μ2 specific rate of growth of R. eutropha (h-1)
μm1 maximum value of μ1 (h-1)
μm2 maximum value of μ2 (h-1)
ν1 specific rate of consumption of glucose (h-1)
ν2 specific rate of consumption of lactate by R. eutropha (h -1)
ν3 specific rate of consumption of ammonium sulfate (h -1)
σ1 specific rate of production of lactate by L. delbrueckii (h -1)
σ2 specific rate of formation of PHB (h-1)
Appendix. The effect of DO concentration on
model parameters
Based on their experimental results, Tohyama et al. [22] proposed the equations given here for different parame-ters in their model.
μm1 = a1 exp(-a2O) + a3 (A1)
YP/S = b1 exp(-b2O) + b3 (A2)
βm = c1 exp(-c2) + c3 (A3)
μm2 = d1 exp(-d2O) + d3 (A4)
YX2/P = f1 exp(-f2O) + f3 (A5)
YQ/P = g1 exp(-g2O) + g3 (A6)
The values of the empirical constants are given in Table 1.
Acknowledgements
Financial support from the Department of Biotechnology, Government of India, through grant no. BT/PR7839/BRB/10/504/2006 is gratefully acknowl-edged.
References
1. van der Walle GAM, de Koning GJM, Weusthuis RA, Eggink G: Prop-erties, modifications and applications of biopolyesters. Adv Biochem Eng Biotechnol 2001, 71:263-291.
2. Babel W, Ackermann J-W, Breuer U: Physiology, regulation and limits of the synthesis of poly (3 HB). Adv Biochem Eng Biotechnol
2001, 71:125-157.
3. Braunegg G, Lefebre G, Genser KF: Polyhydroxyalkanoates, biopolymers from renewable resources: physiological and engineering aspects. J Biotechnol 1998, 65:127-161.
4. Khanna S, Srivastava AK: Recent advances in microbial polyhy-droxyalkanoates. Process Biochem 2005, 40:607-619.
5. Khanna S, Srivastava AK: A simple structured mathematical model for biopolymer (PHB) production. Biotechnol Prog 2005,
21:830-838.
6. Patwardhan PR, Srivastava AK: Model-based fed-batch cultiva-tion of R. eutropha for enhanced biopolymer production. Bio-chem Eng J 2004, 20:21-28.
7. Shahhosseini S: Simulation and optimization of PHB produc-tion in fed-batch culture of Ralstonia eutropha. Process Biochem
2004, 39:963-969.
8. Wang F, Lee SY: Poly(3-hydroxybutyrate) production with high productivity and high polymer content by a fed-batch culture of Alcaligenes eutrophus under nitrogen limitation.
Appl Envion Microbiol 1997, 63:3703-3706.
9. Shang L, Jiang M, Chang HN: Poly(3-hydroxybutyrate) synthesis in fed-batch culture of Ralstonia eutropha with phosphate limitation under different glucose concentrations. Biotechnol Lett 2003, 25:1415-1419.
10. Jendrossek D: Microbial degradation of polyesters. Adv Biochem Eng Biotechnol 2001, 71:293-325.
11. Kim BS, Lee SC, Lee SY, Chang HN, Chang YK, Woo SI: Production of poly(3-hydroxybutyric acid) by fed-batch culture of Alcali-genes eutrophus with glucose concentration control. Biotechnol Bioeng 1994, 43:892-898.
12. Lee JH, Lim HC, Hong J: Application of nonsingular transforma-tion to on-line optimal control of poly(β-hydroxybutyrate) fermentation. J Biotechnol 1997, 55:135-150.
13. Tohyama M, Shimizu K: Control of a mixed culture of Lactoba-cillus delbrueckii and Ralstonia eutropha for the production of PHB from glucose via lactate. Biochem Eng J 1999, 4:45-53. 14. Groethe E, Moo-Young M, Chisti Y: Fermentation optimization
for the production of poly(β-hydroxybutyric acid) microbial thermoplastic. Enzyme Microb Technol 1999, 25:132-141. 15. Kim BS: Production of poly(3-hydroxybutyrate) from
inex-pensive substrates. Enzyme Microb Technol 2000, 27:774-777. 16. de Leon A, Hernandez V, Galindo E, Ramirez OT: Effects of
dis-solved oxygen on the production of recombinant penicillin acylase in Escherichia coli. Enzyme Microb Technol 2003,
33:689-697.
17. Diaz C, Dieu P, Feuillerat C, Lelong P, Salom A: Adaptive predic-tive control of dissolved oxygen concentration in a labora-tory-scale bioreactor. J Biotechnol 1995, 43:21-32.
18. Lafferty RM, Korsatto B, Korsatto W: Biotechnology. In Special Microbial ProcessesVolume 6B. Edited by: Rehm H-J, Reed G. Wein-heim, Germany, VCH; 1986:136-176.
19. Shi H, Shiraishi K, Shimizu K: Metabolic flux analysis for biosyn-thesis of poly(β-hydroxybutyric acid) by Alcaligenes eutrophus from various carbon sources. J Ferment Bioeng 1997, 84:579-587. 20. Tanaka K, Katamune K, Ishizaki A: Fermentative production of poly(β-hydroxybutyric acid) from xylose via L-lactate by a two-stage culture method employing Lactococcus lactis IO-1 and Ralstonia eutropha. Can J Microbiol 1995, 41:257-261. 21. Tohyama M, Takagi S, Shimizu K: Effect of controlling lactate
concentration and periodic change in DO concentration on fermentation characteristics of a mixed culture of Lactoba-cillus delbrueckii and Ralstonia eutropha for PHB production.
J Biosci Bioeng 2000, 89:323-328.
22. Tohyama M, Patarinska T, Qiang Z, Shimizu K: Modeling of the mixed culture and periodic control for PHB production. Bio-chem Eng J 2002, 10:157-173.
23. Froment GF, Bischoff KB: Chemical Reactor Analysis and DesignVolume Ch 12. New York, John Wiley; 1990:509-565.
24. Patnaik PR: Dispersion optimization to enchance PHB produc-tion in fed-batch cultures of Ralstonia eutropha. Bioresource Technol 2006, 97(16):1994-2001.
25. Leaf TA, Srienc F: Metabolic modeling of polyhydroxybutyrate biosynthesis. Biotechnol Bioeng 1998, 57:557-570.
26. Carnahan B, Luther HA, Wilkes O: Applied Numerical MethodsVolume Ch 2. New York, John Wiley; 1969:128-129.
27. Patnaik PR: Effect of fluid dispersion on cybernetic control of microbial growth on substitutable substrates. Bioproc Biosyst Eng 2003, 25(5):315-321.
Publish with BioMed Central and every scientist can read your work free of charge "BioMed Central will be the most significant development for disseminating the results of biomedical researc h in our lifetime."
Sir Paul Nurse, Cancer Research UK
Your research papers will be:
available free of charge to the entire biomedical community
peer reviewed and published immediately upon acceptance
cited in PubMed and archived on PubMed Central
yours — you keep the copyright
Submit your manuscript here:
http://www.biomedcentral.com/info/publishing_adv.asp
BioMedcentral
29. Patnaik PR: Transient sensitivity of a cybernetic model of microbial growth on two substrates. Bioproc Eng 1999,
21:135-140.
30. Patnaik PR: Start-up sensitivity to the initial state of a batch bioreactor for a recombinant Escherichia coli in a complex medium. Bioproc Eng 1996, 15:215-219.
31. Steinbuchel A: PHB and other polyhydroxyalkanoic acids. In
BiotechnologyVolume 6, Ch 13. Edited by: Rehm H-J, Reed G. Wein-heim, Germany, VCH; 1996:403-464.
32. Wang J, Yu J: Kinetic analysis on the formation of poly(3-hydroxybutyrate) from acetic acid by Ralstonia eutropha under chemically defined conditions. J Ind Microbiol Biotechnol
![Table 1: List of parameter values and initial conditions [22].](https://thumb-us.123doks.com/thumbv2/123dok_us/9119276.1904841/5.612.313.552.99.559/table-list-parameter-values-initial-conditions.webp)