Issue 3
Journal of Computer & Information Law
-Spring 2011
Article 2
Spring 2011
The Need for Better Analysis of High Capacity
Services, 28 J. Marshall J. Computer & Info. L. 343
(2011)
George S. Ford
Lawrence J. Spiwak
Follow this and additional works at:
http://repository.jmls.edu/jitpl
Part of the
Computer Law Commons
,
Internet Law Commons
,
Privacy Law Commons
, and the
Science and Technology Law Commons
http://repository.jmls.edu/jitpl/vol28/iss3/2
This Article is brought to you for free and open access by The John Marshall Institutional Repository. It has been accepted for inclusion in The John Marshall Journal of Information Technology & Privacy Law by an authorized administrator of The John Marshall Institutional Repository.
Recommended Citation
THE NEED FOR BETTER ANALYSIS
OF HIGH CAPACITY SERVICES
G
EORGES. F
ORD, P
HD†
L
AWRENCEJ. S
PIWAK, E
SQ.‡
ABSTRACT
In 1999, the Federal Communications Commission (“FCC”) began to grant incumbent local exchange carriers (“LECs”) pricing flexibility on special access services in some Metropolitan Statistical Areas (“MSAs”) when specific evidence of competitive alternatives is present. The pro-priety of that deregulatory move by the FCC has been criticized by the purchasers of such services ever since. Proponents of special access price regulation rely on three central arguments to support a retreat to strict price regulation: (1) the market(s) for special access and similar services is unduly concentrated; (2) rates of return on special access services, computed using FCC ARMIS data, are very high; and (3) prices for spe-cial access services are lower in more heavily regulated markets than in markets with the most pricing flexibility. As shown in this article, these arguments, even if factually correct (which they are not), do not prove the presence of undue market power and, therefore, the need for addi-tional price regulation. Moreover, those lines of inquiry do not consider the potential costs or risks of regulatory intervention, which must be part of any serious cost/benefit analysis. That said, given the importance of this issue, we provide several recommendations for policymakers that are evaluating the special access regulatory paradigm. First and fore-most, data collection must be improved. Second, any revision to the spe-cial access price regulation paradigm must be subject to a stringent cost/ benefit test, with explicit consideration of the costs of regulation. Fi-nally, when gathering and analyzing more comprehensive data, policy-makers should distinguish between economic definitions of “geographic
† Chief Economist, Phoenix Center for Advanced Legal & Economic Public Policy Studies.
‡ President, Phoenix Center for Advanced Legal & Economic Public Policy Studies. The views expressed in this article are the authors’ alone and do not represent the views of the Phoenix Center, its Adjunct Fellows, or any of its individual Editorial Advisory Board members. We are indebted to Professor Randy Beard, Phoenix Center Senior Fellow, for his assistance in formulating the economic model presented in this article.
market” and geographic areas for proper and efficient administration of its special access rules.
I. INTRODUCTION
One of the most vexing issues confronting policymakers for the last decade has been how much the Federal Communications Commission (“FCC”) should regulate the rates, terms, and conditions of high-capacity special access services sold by incumbent local exchange carriers (“LECs”). The prices for such services have been regulated in one form or another for decades, and remain so today in most areas. In 1999, how-ever, the FCC began to grant incumbent LECs pricing flexibility on spe-cial access services in some Metropolitan Statistical Areas (“MSAs”) when specific evidence of competitive alternatives are proven to be pre-sent. As to be expected, the propriety of that deregulatory move by the FCC has been criticized by the purchasers of such services ever since.
Proponents of special access price regulation essentially rely on three central arguments to support their belief that there is a presence of excess market power and the need for a retreat to strict price regulation:
(1) The market(s) for special access and similar services is unduly concentrated;
(2) Rates of return on special access services, computed using FCC ARMIS data, are very high; and
(3) Prices for special access services are lower in more heavily regu-lated markets than in markets with the most pricing flexibility.
Most analytical attempts to justify additional FCC intervention over spe-cial access services center around at least one of these lines of argument. Making any of these arguments, however, requires the collection and study of a substantial amount of data from competitive providers of high capacity services that, quite simply, have not been gathered. In particu-lar, two studies, one by the U.S. Government Accountability Office (“GAO”) and the other by the National Regulatory Research Institute (“NRRI”), specifically note that despite serious efforts to do so, they did not collect sufficient data on competitive providers of high capacity ser-vices to make definitive findings on market power.1
1. U. S. GOV’T ACCOUNTABILITY OFFICE, GAO-07-80, TELECOMMUNICATIONS: FCC
NEEDS TO IMPROVE ITS ABILITY TO MONITOR AND DETERMINE THE EXTENT OF COMPETITION IN
DEDICATED ACCESS SERVICES(2006), available at http://www.gao.gov.new.items/d0780.pdf
(hereinafter “GAO REPORT”); PETER BLUHM & ROBERT LOUBE, NAT’L REGULATORY R E-SEARCH INST., COMPETITIVE ISSUES IN SPECIAL ACCESS MARKETS (2009), available at http://
www.naruc.org/Publications/09%200121%20NARUC%20NRRI_spcl_access_mkts_jan09-02 %20_2_.pdf (hereinafter NRRI STUDY). The NRRI Study was commissioned by the
Moreover, these three lines of argument standing alone or together are insufficient to justify rate regulation. While proponents of additional regulation contend that these arguments—market concentration, rates of return from ARMIS data, and relative pricing—are relevant to differ-ent degrees, the application of modern economic and empirical analysis shows that they are insufficient to justify regulatory intervention. Even if established, they do not prove the presence of undue market power.2
Additionally, those lines of inquiry do not consider the potential costs or risks of regulatory intervention, which must be part of any serious cost/ benefit analysis.
This article discusses in detail the lines of inquiry and types of infor-mation that policymakers should be examining with regard to the regu-lation of high capacity services. Getting the regulatory framework for these services correct is paramount. High capacity services are a multi-billion dollar industry, and these services provide dedicated high capac-ity connections for businesses, competitive network providers, and wire-less service networks. Moreover, despite the current financial situation, entry, competition and investment into these services is still occurring— a fact that is a testament to the importance of these services. Additional rate regulation can stifle investment and stop competitive entry in its tracks.
After a brief background on special access services and their regula-tion in Secregula-tions II and III, Secregula-tion IV describes in detail the significant shortcomings in each of the three arguments used to support additional rate regulation of special access services. First, even if one sets aside the challenges of calculating market concentration indices when data is in-complete, the fact that a market is concentrated is not a per se indication of poor market performance or of market power. Second, rate of return statistics using the FCC’s ARMIS data are an unreliable indicator of eco-nomic profits. The data is based on regulatory accounting standards and non-economic, often arbitrary, allocation rules. ARMIS is, in essence, an artifact of a bygone era. Finally, simple comparisons of prices in areas subject to different forms of regulation have little meaning as to whether market power is being exercised and indicate only that regulators can force a price lower than prevailing market prices. In fact, observing that regulated prices are different from market prices can, frankly, be an in-dictment of the rate regulation just as easily as it can be a criticism of deregulation.
That said, given the complexity of this important issue, Section V provides several recommendations for policymakers that are evaluating the special access regulatory paradigm. Our recommendations are
tively simple and straightforward. First and foremost, data collection must be improved. Indeed, it is impossible to get an accurate picture of the market when only few firms provide data, particularly given that data from only a few firms can present a radically different picture of the competitive landscape. The inability of the GAO and the NRRI to gather sufficient information strongly limits the ability to draw any justifiable conclusion from their analysis. Recently, several parties have asked the FCC to gather particular types of data from all industry participants, and that type of information-gather approach ought to continue. Second, any revision to the special access price regulation paradigm must be sub-ject to a stringent cost/benefit test, particularly in this difficult current economic environment. Finally, when gathering and analyzing more comprehensive data, policymakers should distinguish between economic definitions of “geographic market” and “geographic areas” for proper and efficient administration of its special access rules. The two are not nec-essarily the same—the formal economic definition of a geographic mar-ket may reflect economic analysis but may be difficult to administer as a matter of policy efficiency. As a result, a cost/benefit analysis of the proper geographic scope of a regulatory policy does not necessarily have to be entirely consistent with the economic definition of a geographic market for these services.
II. BACKGROUND: THE REGULATION OF SPECIAL ACCESS SERVICES
Special access services are dedicated, high-speed data transmission lines that guarantee a certain level of capacity throughput between two points. Businesses and other telecom service providers, such as wireless carriers, use these special access circuits to provide dedicated bandwidth between business locations, cell phone towers and, increasingly, the pub-lic Internet. According to FCC data, the special access revenues of in-cumbent LECs alone totaled about $16 billion annually.3 Given the lack
of data on high capacity services provided by competitors to the LECs, it is not possible today to accurately size total expenditures for such high-capacity services.
When provided by incumbent local exchange carriers like AT&T and Verizon, these services are typically provided using time-division mul-tiplexing (“TDM”) technology and are sold in bandwidth increments orig-inally developed by Bell Labs for use over twisted copper wire infrastructure. These increments include Digital Service Level 1 (DS-1)
3. FED. COMMUNICATIONS COMM’N, STATISTICS OF COMMUNICATIONS COMMON C ARRI-ERS, Table 2.11 (2006/2007), available at http://hraunfoss.fcc.gov/edocs_public/attachmatch/
of 1.544 Mbps and Digital Service Level 3 (DS-3) of 44.736 Mbps.4 While
these service levels were originally developed to support the transmis-sion of multiple voice signals over a common copper wire infrastructure, over time the use of these dedicated connections solely for data services, or for a combination of voice and data applications, has grown. Although incumbent LECs are significant suppliers of these connections nation-wide, dozens of other firms—such as Time Warner Telecom and Com-cast—now offer similar services, both over their own facilities or over facilities acquired from other carriers, including incumbent LECs.
Special access services are generally regulated as interstate telecom-munications services subject to direct and exclusive FCC jurisdiction. Prior to 1991, like many other common carrier telecommunications ser-vices offered by incumbent LECs, special access serser-vices were subject to rate of return regulation. Under rate of return regulation, prices were set equal to the cost of production plus an allowable return on capital. It has been observed repeatedly that rate of return regulation does not en-courage efficient production and can render inefficient cost structures as firms inflate the cost base to produce “soft” profits (art, planes, and so forth) or inflate capital expenditures to increase the volume of profits (the Averch-Johnson effect).5 So, in 1991, the FCC implemented price
cap regulations for larger LECs for special access services.6 Price cap
regulation sets maximum prices for services or baskets of services that allow firms to increase profits by improving efficiency.7 These price caps
are adjusted over time both to account for inflation and to reflect im-proved efficiency. Profits for the regulated firm are allowed to rise, as long as the firm can be more efficient than the regulatory-mandated pro-ductivity factor. For special access services, price cap adjustments have generally resulted in a steady decrease in the prices for price-capped spe-cial access services.8 Under price cap regulation, there is theoretically
4. These service definitions were developed to facilitate the transmission of multiple voice circuits over copper wires—traditionally, DS-1 can support 24 digitized voice chan-nels, each of which occupies 64 kbps, while a DS-3 can support 672 voice channels. These traditional bandwidth designations remain in place today even though special access cir-cuits are no longer used exclusively for voice services and also are increasingly provided over optical fiber. Today, of course, with the tremendous capacity demands of the Internet, the capacities of circuits at higher levels of the network are substantially larger than DS-3. 5. Harvey Averch & Leland L. Johnson, Behavior of the Firm Under Regulatory Con-straint, 52 AM. ECON. REV., 1052, 1061 (1962).
6. Policy and Rules Concerning Rates for Dominant Carriers, CC Docket No. 87-313,
Second Report and Order, 5 FCC Rcd. 6786 (1990), available at http://www.gpo.gov/fdsys/ pkg/FR-1996-12-31/pdf/96-32934.pdf.
7. See generally, the thorough analyses of price-cap regulation in MICHAEL A. E IN-HORN, PRICE CAPS AND INCENTIVE REGULATION IN TELECOMMUNICATIONS 1(1991).
no reference to the rate of return earned, though the FCC’s approach originally deviated somewhat from this theoretical ideal by means of “sharing” rules and “low end adjustments.”9 Practically, the debate over
pricing under price caps, however, rarely strays too far from the rate of return mentality, even though the FCC no longer collects the data neces-sary to implement rate-of-return regulation.
After the 1996 Act, which mandated a deregulatory mentality at the FCC, competition and entry began to grow in the market and, in 1999, the FCC took a significant deregulatory step by granting “pricing flexi-bility” to incumbent LECs in metropolitan markets in which competition was (arguably) present and viable.10 The 1999 Pricing Flexibility Order
is a significant example of the FCC’s attempt to balance the goals of the 1996 Act of promoting competition and reducing regulation. Specifically, the FCC stated in the Pricing Flexibility Order that its policy:
was designed to grant greater flexibility to price cap LECs as competi-tion develops, while ensuring that: (1) price cap LECs do not use pricing flexibility to deter efficient entry or engage in exclusionary pricing be-havior; and (2) price cap LECs do not increase rates to unreasonable levels for customers that lack competitive alternatives.11
Importantly, the FCC concluded that pricing flexibility was justified even in the presence of market power, noting that “regulation imposes costs on carriers and the public, and the cost of delaying regulatory relief outweighs any costs associated with granting that relief before competi-tive alternacompeti-tives have developed to the point that the incumbent lacks market power.”12 The FCC also recognized that prices may rise as a
re-sult of eliminating price caps, noting its special access pricing rules “may
Exchange Carriers, CC Docket No. 94-1, Low-Volume Long Distance Users, CC Docket No. 99-249, Federal-State Joint Board on Universal Service, CC Docket No. 96-45, Sixth Report and Order in CC Docket Nos. 96-262 and 94-1, Report and Order in CC Docket No. 99-249, Eleventh Report and Order in CC Docket No. 96-45, 15 FCC Rcd. 12962 (2000), available at
http://digital.library.unt.edu/ark:/67531/metadc2974/m1/367/?q=15. Those moves were made in the context of an industry-wide negotiation and compromise over a multitude of compensation issues well beyond special access regulation.
9. Under sharing, if the observed rate of return is “too high,” the firm is forced to refund money to customers. Low end adjustments protect firms from returns that are “too low,” by allowing price increases. See Gregory J. Vogt, Cap-Sized: How the Promise of the Price Cap Voyage to Competition Was Lost in a Sea of Good Intentions, 51 FED. COMM. L.J. 349, 373 (1999).
10. Access Charge Reform, supra note 8; WorldCom, Inc. v. FCC, 238 F.3d 449 (D.C. Cir. 2001).
11. Access Charge Reform, CC Docket No. 96-262, Fifth Report and Order and Further Notice of Proposed Rulemaking, 14 FCC Rcd. 14221 (1999) (hereinafter “Pricing Flexibility Order”), available at http://transition.fcc.gov/Bureaus/Common_Carrier/Orders/1999/fcc99 206.txt.
have required incumbent LECs to price access services below cost.”13
With regard to price increases generally, the FCC explicitly voiced that its concern was focused upon preventing only price increases “to unrea-sonable levels” in areas that “lack competitive alternatives.”14
Under the FCC’s pricing flexibility regime, incumbent LEC’s obtain pricing flexibility for special access services in markets in which certain “triggers” designed to detect whether there are sufficiently robust com-petitive alternatives to incumbent LEC special access circuits are met. Pricing flexibility is granted in two phases: “Phase I” flexibility allows incumbent LECs to enter into contract tariffs and offer volume and term discounts for services which the incumbent LEC makes a specific com-petitive showing; and “Phase II” flexibility allows incumbent LECs to of-fer special access service at rates that are not subject to price caps, provided that those prices are posted as generally available tariffs or contract tariffs.
The trigger thresholds for Phase I and Phase II regulation differ. To obtain Phase I pricing flexibility, a price cap LEC must show that in each Metropolitan Statistical Area (MSA) competitors unaffiliated with the price cap LEC have collocated:
1. In fifteen percent (15%) of the petitioner’s wire centers, and that at least one such collocated provider in each wire center is using transport facilities owned by a transport provider other than the price cap LEC to transport traffic from that wire center; or
2. In wire centers accounting for thirty percent (30%) of the petitioner’s revenues from dedicated transport and special access services other than channel terminations between LEC end offices and customer premises . . . and that at least one such collocated provider in each wire center is using transport facilities owned by a transport provider other than the price cap LEC to transport traffic from that wire center.15
For channel terminations, a stricter standard is applied. Phase I relief for channel terminations requires collocations in fifty percent (50%) of wire centers or in wire centers accounting for sixty-five percent (65%) of revenues.
The parameters for Phase II pricing flexibility are nearly identical except that non-affiliated carriers must have collocated in fifty percent (50%) of the petitioner’s wire centers or in wire centers accounting for sixty-five percent (65%) of the petitioner’s revenues from dedicated transport and special access services other than channel terminations between LEC end offices and customer premises.16 Phase II flexibility
therefore requires a higher “competition” standard than Phase I, since
13. Pricing Flexibility Order, supra note 11.
14. Id.
the incumbent LEC can remove services sold in such markets from price cap regulation, whereas Phase I flexibility retains price caps but allows the ILEC to provide volume and term discounts of current rates or enter into contract tariffs. Consumers can continue to purchase special access services at price-cap rates in areas subject to Phase I deregulation, but special access services are not subject to price caps in areas where Phase II relief has been granted. In other words, the price cap rates are no longer a backstop in Phase II markets.
Because the Pricing Flexibility Order was one of the FCC’s first at-tempts to satisfy the statutory mandate of the 1996 Act to “reduce regu-lation,” the effectiveness of the FCC’s approach has been challenged virtually ever since the ink was dry on the Order. The FCC’s Pricing Flexibility Order was appealed and eventually upheld by the D.C. Circuit Court.17 In 2002, only one year after the D.C. Circuit’s decision, AT&T
Corp. filed a petition for rulemaking to revise or repeal the rules.18 In
2003, the Phoenix Center released a study critical of the FCC’s approach to special access pricing flexibility, arguing that the agency’s treatment of sunk costs was incomplete.19 In that same year, the FCC responded to
these requests and initiated its own investigation, which remains open at this point.20 However, after a November 2006 report by the U.S.
Gov-ernment Accountability Office (“GAO”),21 the FCC requested additional
information to refresh the record concerning special access competition, a proceeding that remains open to this day.22
17. WorldCom, Inc., 238 F.3d 449; Pricing Flexibility Order, supra note 11.
18. AT&T Corporation Petition for Rulemaking to Reform Regulation of Incumbent Local Exchange Carrier Rates for Interstate Special Access Services. WC Docket No. 02-250, Petition for Rulemaking (Oct. 15, 2002).
19. George S. Ford & Lawrence J. Spiwak, Set it and Forget It? Market Power and the Consequences of Premature Deregulation in Telecommunications Markets, PHOENIX CENTER
POL’Y PAPER NO. 18 (2003) available at http://www.phoenix-center.org/pcpp/PCPP18.pdf),
reprinted in 1 N.Y.U. J.L. & BUS. 675 (2006). Unfortunately, the FCC has long-struggled
with the concept of sunk costs. See also George S. Ford, You’re Not Impaired Because You Are Impaired, PHOENIX CENTER PERSP. 04-05 (2004) available at
http://www.phoenix-center.org/perspectives/Perspective04-05Final.pdf.
20. Special Access Rates for Price Cap Local Exchange Carriers, WC Docket No. 05-25, Order and Notice of Proposed Rulemaking, 20 FCC Rcd. 1994 (2005)(hereinafter “2005 Spe-cial Access NPRM”) available at http://digital.library.unt.edu/ark:/67531/metadc4105/m27 68?q=20FCCrcd.
21. GAO REPORT,supra note 1.
III. RECENT STUDIES OF COMPETITION FOR HIGH CAPACITY SERVICES
In this Section, we summarize the findings of the two recent studies of the current state of competition for high capacity services: a 2006 study by the Government Accountability Office (“GAO”) and a 2008 study by the National Regulatory Research Institute (“NRRI”) that was commissioned by the National Association of Regulatory Utility Commis-sioners (“NARUC”). As noted below, while both the GAO and the NRRI studies acknowledge a severe deficiency in available data, both studies nonetheless focus on the same questions of market concentration and comparisons of prices in areas subject to price caps to those areas that are not subject to price caps. The NRRI Study calculates incumbent LEC rates of return using adjusted ARMIS data, but the GAO study does not.
A. THE 2006 GAO REPORT
The GAO Report studied the competitive conditions for special ac-cess services in sixteen major metropolitan areas. In particular, the GAO examined: (i) the extent that alternatives are available in areas where FCC granted pricing flexibility; and (ii) how prices have changed since the granting of pricing flexibility. Telcordia, a provider of telecom-munications network software and services, and GeoResults, a firm that regularly analyzes Telcordia data, provided the GAO with data on the availability of alternative providers of special access services. Competi-tive alternaCompeti-tives were evaluated at the building level (implying a very narrow geographic market definition). Price data was gathered from tar-iffs and contracts filed at the FCC. The GAO recognized some limita-tions in their data, and explicitly observed that “the results are not generalizable to all MSAs in the United States.”23 By this recognition,
the GAO concluded that its findings were strictly limited to the sixteen MSA considered and could not be used to make statements about special access services generally.
For buildings in the sixteen MSAs studied, the GAO concluded that competitive alternatives for dedicated access were not widely available. Buildings with higher levels of demand (i.e., two DS3’s or more) had more alternatives, with fifteen to twenty-five percent of buildings
show-05-75, Memorandum Opinion and Order, 20 FCC Rcd. 18433 (2005) (hereinafter “Verizon and MCI Applications”), available at http://digital.library.unt.edu/ark:/67531/metadc4087/ m1/479/?q+20FCCrcd18433; SBC Communications Inc. and AT&T Corp. Applications for Transfer of Control, WC Docket No. 05-65, Memorandum Opinion and Order, 20 FCC Rcd. 18290 (2005), available at http://digital.library.unt.edu/ark:/67531/metadc4087/m1/479/?q+ 20FCCrcd18433.
ing competitive alternatives.24 As for prices, the GAO concludes that
both list prices and average revenues for special access services had de-creased over the study period (2001 to 2005, adjusted for inflation). The GAO also found that prices were often higher in areas with Phase II pric-ing flexibility relative to areas that are still subject to price caps. The GAO’s study estimated special access prices based on list price data to support its assertion that incumbent LEC prices in Phase II areas were higher than prices in non-Phase II areas.
Importantly, the GAO Report did not make sweeping claims on ei-ther competition or the need for regulation, noting in particular that “[w]e are not making a judgment on the legal sufficiency of competition in dedicated access services,” and that the report “does not call for the reregulation of dedicated access prices.”25 Stronger recommendations
were precluded, perhaps, by the GAO’s recognition of the “limits of avail-able data on the extent and effect of competition in the market for dedi-cated access services,”26 and the inability to generalize their results from
an analysis of sixteen MSAs to other areas. Final recommendations were limited. The GAO Report concludes that “in order to better meet its regulatory responsibilities, [the] FCC needs a more accurate measure of effective competition and needs to collect more meaningful data.”27 The
GAO’s sentiment echoes the proposal in our 2003 study on special access regulation.28
B. THE 2009 NRRI STUDY
In 2008, the National Association of Regulatory Utility Commissions (“NARUC”) commissioned the National Regulatory Research Institute (“NRRI”) to “conduct an analysis of the existing data focusing on whether incumbent local exchange carriers (ILECs) have market power” over spe-cial access services and “whether ILECs are using that market power to increase prices above competitive levels.”29 Two efforts by NARUC to
collect data from carriers and customers in 2007 received responses from
24. This finding is predictable from theory. See generally George S. Ford, et al., Com-petition After Unbundling: Entry, Industry Structure and Convergence, PHOENIX CENTER
POL’Y PAPER NO. 21 (2005), available at
http://www.phoenix-ceneter.org/pcpp/PCPP21Fi-nal.pdf, reprinted in 59 FED. COMM. L.J. 331 (2007).
25. GAO REPORT,supra note 1.
26. Id.
27. Id.
28. Ford & Spiwak, supra note 19, at 3 (“responsible public policy requires the Com-mission to return the core unresolved issue of incumbent market power to center-stage and address it in an intellectually honest and definitive manner”).
29. PETER BLUHM & ROBERT LOUBE, NAT’L REGULATORY RESEARCH INST., COMPETITIVE
ISSUES IN SPECIAL ACCESS MARKETS 1-2 (2009) available at
only six firms, so NRRI was tasked in 2008 with collecting more data and providing a market power analysis.30 This latest effort at data collection
resulted in the January 2009 report entitled Competitive Issues in Spe-cial Access Markets by authors Peter Bluhm and Robert Loube.31
Unlike the GAO Report, which inferred the extent of competition from a large database, the NRRI sought data from both buyers and sell-ers in the fifty largest MSAs. However, the survey approach did not fare well: the NRRI received responses from only seven firms and did not re-ceive any data from fixed wireless providers or cable companies that offer special access services—two alternatives that are the most significant competitors to LEC special access services.32 The NRRI admitted that
the data it collected is “too incomplete to support a comprehensive analy-sis of long-term pricing trends between 2001 and 2006,” and that the incomplete data “limited [NRRI’s] ability to verify market concentrations and verify buyer reports on the prices charged.”33
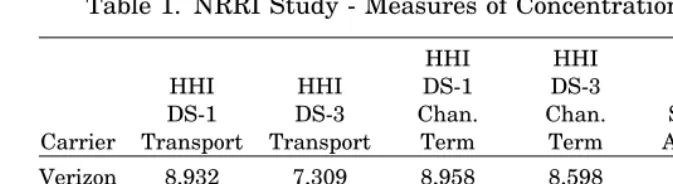
The evidence presented in the NRRI Study covers three main areas. First, the report summarizes the calculations of the Hirschman-Herfindahl Index (“HHI”) calculated from its survey responses.34 The
study defines four product markets: (i) DS1 transport; (ii) DS1 channel terminations; (iii) DS3 transport; and (iv) DS3 Channel Terminations. The NRRI Study never specifically defines the geographic market and instead calculates market concentration at the national, MSA, and city levels. While the NRRI found its measures of market concentration to be
30. NRRI STUDY, supra note 29, at 1-2, 35 (describing background of the study and
NRRI’s role). McLeod USA, Sprint, Time Warner Telecom, T-Mobile and XO Communica-tions responded to NARUC’s May 2007 survey of special access customers, and only AT&T responded to NARUC’s June 2007 survey of special access suppliers.
31. Id.
32. Id. at 36-37. Respondents included Covad, Sprint, T-Mobile, TW Telecom, XO, Ver-izon, and Embarq. The absence of any response from cable providers is significant, as cable networks tend to be the largest, nearly-ubiquitous landline high capacity network chal-lenger to incumbent LECs. As the National Cable & Telecommunications Association re-cently told the FCC, “many cable operators provide high-capacity services that compete with special access services offered by incumbent local exchange carriers” and “many cable operators view such services as a growing segment of their business.” Letter from Stephen F. Morris, Assoc. Gen. Counsel, Nat’l Cable & Telecomms. Ass’n, to Marlene H. Dortch, Secretary, FCC (May 8, 2009) available at http://fjallfoss.fcc.gov/ecfs/comment/view?id=551 5360780.
33. NRRI STUDY, supra note 29 at 37-38.
34. The HHI is an accepted measure of market concentration but has limitations in dynamic markets. The index is calculated by summing the squared market shares of each firm. For example, a market consisting of three equal sized firms has an HHI of 3,333 (= 332 + 332 + 332). The number’s equivalent is simply [1/(HHI/1000)], where this ratio
mea-sures the number of hypothetical, equally sized firms in a market (irrespective of the actual distribution of market shares). On the HHI, seeU.S. DEP’T OF JUSTICE & FED. TRADE
COMM’N, HORIZONTAL MERGER GUIDELINES at §5.3 (2010), available at http://www.justice.
very high in most instances, without a geographic market definition and comprehensive collection of data, it is not clear what those calculations mean.
Second, the NRRI Study computes a regulatory rate of return for the larger incumbent LECs (AT&T, Qwest, and Verizon). Using “adjusted” ARMIS data, these rates of return are estimated to be near 40% for Qwest and 30% for AT&T. Alternately, for Verizon, the rate of return is only 15%. These are large differences in returns, yet no explanation is provided to explain these differences across LECs.
Third, like the GAO Report, the NRRI Study compares the prices between areas with different regulatory schemes. The NRRI Study found that list prices were lower in markets with greater pricing flexibil-ity.35 This result conflicted with the GAO report, which found higher
prices in Phase II areas. Discount prices, in contrast, were typically higher in Phase II markets, but rarely by a statistically significant amount.36 However, as discussed in more detail below, the NRRI Study
examined nominal pricing data, not real pricing data, which is a signifi-cant defect in the analysis.
Unlike the GAO Report before it, however, the NRRI issued several strong conclusions about market power in so-called “special access mar-kets.” In particular, the NRRI claimed that ILECs “maintain strongly dominant market shares” for DS-1 and DS-3 channel terminations and transport.37 As a consequence of this finding, the NRRI Study makes
several policy recommendations, including a recommendation that the FCC should change its standard for granting price deregulation and that it should “reset” special access rates for AT&T, Verizon, and Qwest.38
IV. DECONSTRUCTING THE ARGUMENTS FOR REGULATING SPECIAL ACCESS PRICES
Consistently, those calling for the elimination of pricing flexibility and strict price regulation of special access prices adopt a rather stan-dard template for evaluating the potential for welfare improving regula-tion. The NRRI Study, for example, states its intent to “assess . . . whether ILECs have market power and, if so, whether they are using that power to increase prices above competitive levels.”39 Market power,
likewise, has a standard definition: “[m]arket power for a seller is the
35. NRRI STUDY, supra note 29, at 65. Mean discounted prices were found to be higher.
36. Id. The NRRI Study does not describe the statistical test employed or the sample sizes.
37. Id. at 45-46. 38. Id.
ability to profitably maintain prices above competitive levels for a signifi-cant period, without signifisignifi-cant customer loss and without attracting en-try by competitors.”40 Market power, then, is quantified in the
relationship of actual price to the competitive price.
If competitive prices are observable, then the quantification of mar-ket power is fairly straightforward. For example, economists have for years estimated the price and quality differentials between monopolistic and duopolistically-competitive cable television markets.41
Unfortu-nately, in many cases relevant to regulatory proceedings, it is difficult to find competitive prices for a particular product or service, typically due to the influence of existing or historical regulation on observed prices. Absent measurable prices of service or those for useful analogies, the de-bate becomes more theoretical. In fact, it is theory, not empirics, that provides the foundation for most of the pro-regulatory arguments for spe-cial access services today. As shown below, while theory can be informa-tive and very useful for public policy, there are some limitations on the use of the theories invoked in the special access case.
A. A SINGULAR FOCUS ON MARKET CONCENTRATION IS MISGUIDED
While much of the empirical debate over special access regulation focuses upon the market concentration levels and the ostensible small share of rivals to incumbent LECs, this singular focus on market share is not a proper way to engage in a comprehensive competitive analysis. In-deed, as we show in this Section, the issue is not so simple. While con-centration statistics certainly have their uses, economic theory,42
antitrust,43 and FCC precedent44 all make clear that such data is not the
40. Id. at 23.
41. See, e.g., GAO REPORT,supra note 1; U.S. GOV’T ACCOUNTABILITY OFFICE,
GAO-04-8, TELECOMMUNICATIONS: ISSUES RELATED TO COMPETITION AND SUBSCRIBER RATES IN THE
CABLE TELEVISION INDUSTRY (2003), available at http://gao.gov/new.items/d048.pdf; U.S.
GOV’T ACCOUNTABILITY OFFICE, GAO-03-130, TELECOMMUNICATIONS: ISSUES IN PROVIDING
CABLE AND SATELLITE TELEVISION SERVICES (2002), available at http://www.gao.gov/new.
items/d03130.pdf; U.S. GOV’T ACCOUNTABILITY OFFICE, GAO/RCED-00-164, T ELECOMMUNI-CATIONS: THE EFFECT OF COMPETITION FROM SATELLITE PROVIDERS ON CABLE RATES (2000),
available at http://www.gao.gov/archive/2000/rc00164.pdf; T. Randolph. Beard, et al., Frag-mented Duopoly: A Conceptual and Empirical Investigation, 78 J. BUS. 2377-96 (2005).
42. See generally Duncan Cameron & Mark Glick, Market Share and Market Power in Merger and Monopolization Cases, 17 MANAGERIAL & DECISION ECON. 193 (1996) (legal
pre-cedent requiring courts to draw inferences about market power based primarily or exclu-sively on market shares and/or market concentration can often be misleading; the only alternative to such bright line rules is to utilize modern economic tools to undertake more extensive competitive analyses); see also MICHAEL L. KATZ & HARVEY S. ROSEN,
MICROECONOMICS 508 (2d ed. 1994); John E. Kwoka, Jr., Regularity and Diversity of Firm
Size Distribution in U.S. Industries, 34 J. ECON. & BUS. 391 (1982).
end of the analysis—it is merely the beginning.45 As a result, the
near-singular focus that the NRRI places upon (poorly constructed) market concentration measurements leads to a myopic interpretation of the ac-tual competitive dynamic in the market.
1. The Theory of Prices and Concentration
The implicit theoretical underpinning of the argument for special ac-cess regulation based on industry concentration statistics is that more firms implies lower prices.46 The concentration measure in the NRRI
Study is the HHI, which is the sum of the squared market shares for the firms determined to be in both the product and geographic market of interest. The GAO Report, alternately, focuses solely on the market share of the incumbent LEC.
Of course, the key assumption in these studies is that there is a rela-tionship between market concentration and above-market prices. In eco-nomic terms, this assumption is that firms in markets for high capacity services compete in what is commonly called “Cournot competition” or “competition in quantities.”47 With Cournot competition, price and
prof-Pac. Commc’ns Co. v. AT&T, 740 F.2d 980, 1000 (D.C. Cir. 1984), cert. denied, 470 U.S. 1005 (1985) (When a “predominant market share may merely be the result of regulation, and regulatory control may preclude the exercise of market power . . . in such cases market share should be at most a point of departure in determining whether market power ex-ists.”); Metro Mobile CTS, Inc. v. NewVector Commc’ns Inc., 892 F.2d 62, 63 (9th Cir. 1989) (“Reliance on statistical market share in cases involving regulated industries is at best a tricky enterprise and is downright folly where . . . the predominant market share is the result of regulation.”).
44. See, e.g. Motion of AT&T Corp. to Be Reclassified as Non-Dominant Carrier, FCC 95-427, Order, 11 FCC Rcd. 3271 (1996) (hereinafter “Motion of AT&T Corp.”) available at
http://digital.library.unt.edu/ark:/67531/metadc2058/ml404/?q=11FCCRcd3271; In the Ap-plication of NYNEX Corporation, Transferor, and Bell Atlantic Corporation, Transferee, For Consent to Transfer Control of NYNEX Corporation and Its Subsidiaries, File No. NSD-L96-10, Memorandum Opinion and Order, 12 FCC Rcd. 19985 (1997), available at
http://digital.library.unt.edu/ark:/67531/metadc2308/m1/583/?q=12FCCRcd19985. (“mar-ket share and concentration data provide only the starting point for analy[sis]”).
45. 2005 Special Access NPRM, supra note 20 (“According to the DOJ Merger Guide-lines, a high market share does not necessarily confer market power, but it is generally a condition precedent to a finding of market power (at 19391).”).
46. The connection can be demonstrated theoretically under certain conditions. See, e.g.,STEPHEN MARTIN, ADVANCED INDUSTRIAL ECONOMICS 7 (1993).
47. In the Cournot setting, firms choose the quantities they will offer to the market, and then the market price is determined by the market that liquidates those quantities. (Such a setting is akin to firms that set sales targets.) With Cournot competition, price and profits fall as the number of firms increases, converging on the competitive equilibrium. This “more firms, lower price” mentality dominates regulatory debates, and it is reasonable to say that Cournot competition is the benchmark in regulatory settings. SeeMARTIN,
supra note 46 at 17-35; DENNIS W. CARLTON AND JEFFERY M. PERLOFF, MODERN INDUSTRIAL
its fall as the number of firms increases, converging on the competitive equilibrium as the number of firms gets large.48 It is reasonable to say
that Cournot competition is the benchmark of most regulatory settings, because its central hypothesis of “more firms, lower price” is echoed throughout most regulatory debates.
The assumption about the behavior of firms embedded in the Cournot model, however, does not necessarily comport with reality; Cournot competition is, in fact, just one set of assumptions as to how firms behave in concentrated markets. Firms need not behave in this fashion. An alternative and frequently employed formulation of competi-tion is “Bertrand Competicompeti-tion” or “competicompeti-tion in prices.”49 Here, firms
choose price and sell whatever quantities consumers demand at that price. The differences in the assumptions (at least in the simple cases) have profound effects on equilibrium.50 Unlike the Cournot model,
where prices and profits fall gradually as the number of firms increases, with Bertrand competition the perfectly competitive outcome is obtained with only two firms. In this sense, Bertrand is often viewed as “more competitive” than Cournot. An interesting and important point is that in a Bertrand setting, the HHI is a meaningless indicator of market power, since after the second entrant, the number of firms has no impact on price.51
At the other extreme from Bertrand competition, firms may cooper-ate, implicitly or explicitly, to not compete at all. This outcome is collu-sion. If collusion is perfect, then prices and profits remain at the monopoly level irrespective of the number of firms. As a result, simply measuring the number of firms in an industry need not have a direct relationship to price—a highly collusive industry can have many
partici-48. In the Cournot framework, the price reductions (or quantity increases) from addi-tional firms are very low after about five firms. JOHN SUTTON, SUNK COST AND MARKET
STRUCTURE 30-34 (1995).
49. SUTTON, supra note 48, at 32; MARTIN, supra note 46, at 35-43; CARLTON &
PERLOFF, supra note 47, at 157-187.
50. In more complex settings, they may be more alike. For example, if firms must first choose capacity levels prior to competing, the equilibrium of Bertrand competition in prices is identical to that of the simple Cournot model. See David M. Kreps & Jose A. Scheinkman, Quantity Precommitment and Bertrand Competition Yield Cournot Outcomes, 14 BELL J. ECON. 326, 326-37 (1983). Product differentiation also leads to prices above
marginal cost under Bertrand Competition. See, e.g., MARTIN, supra note 46 at 39.
51. For example, moving from two to three firms reduces the HHI from 0.50 to 0.33, but the price is unchanged. Differences in the HHI do not lead to differences in the price or price-cost margin, except for the move from monopoly to duopoly. MARTIN, supra note 46, at
pants (think OPEC, with twelve members) while reasonably competitive industries can have very few major participants (think Coke and Pepsi).
Figure 1. Price and the Number of Firms
1 2 3 4
N
= (1/HHI)
Collusion
Cournot Bertrand
c
Price
pM
Indeed, under conditions of either Cournot or Bertrand competition, an industry does not require many firms to achieve price and output levels that approach conditions of perfect competition. Figure 1 illus-trates this effect.52 In the figure, price is measured on the vertical and
the number of firms N (or 1/HHI) on the horizontal.53 The monopoly
price is labeled pM and marginal cost is labeled c. First, consider the
relationship between the number of firms and price under Cournot com-petition. As shown by the line labeled “Cournot,” as the number of firms increases the price gradually falls toward marginal cost (that is, the per-fectly competitive outcome in the simplest settings). Note that while price continually falls with increases in N under Cournot competition, most of the price cuts from competition are realized with the first few firms.
In contrast to this steady decline in prices under Cournot competi-tion, with Bertrand competicompeti-tion, marginal cost pricing is obtained with only two firms (i.e., duopoly).54 The line labeled “Bertrand” reveals this
sharp decline in price from pM to c between the first and second firm. As
52. The figure adapted from SUTTON, supra note 48, at 34.
53. If firms are identical, then HHI = 1/N. If there are two equal sized firms, then the market shares are 50% and the HHI is 0.50. With three firms, the shares are 33% and the HHI is 0.33.
competi-just mentioned, after the second entrant, additional firms have no effect on price, so the HHI and other measures of concentration are meaning-less in the Bertrand framework. Finally, there is a line labeled “Collu-sion.” If firms are able to collude perfectly, then the price is held at the monopoly price regardless of the number of firms. As with Bertrand, the number of firms infers almost nothing about price.
Figure 1 illustrates a very simple point. Even at duopoly, the theo-retical equilibrium price covers the entire range from perfect competition to monopoly.55 Therefore, without first specifying the nature of
competi-tion, or better yet, estimating it, there is no per se relationship between the number of firms (or concentration statistic) and price. Backing out market power information from concentration data requires an assump-tion about or empirical estimate of the nature of competiassump-tion. As we dis-cuss later, in telecommunications markets, the linkage between market power and concentration is exceedingly complex. As the authors of the NRRI Study observe (and then ignore), “market concentration does not, by itself, prove that a seller has excessive market power.”56
2. The Threat of Entry
Another problem with simple concentration/market power argu-ments is that high profits may attract entry, thereby encouraging incum-bent firms to lower price to avoid attracting additional competitors. The exercise of market power may be limited if the threat of entry is high. The economic theory of contestability holds that efficient prices can be obtained even under monopoly supply, a conclusion supporting the rele-vance of entry to market outcomes.57 The theory of contestability is
widely accepted as a theory and widely contested in application. Indeed, even the NRRI Study observes that “government has less reason to inter-vene in regulating a contestable market, even if that market is concentrated.”58
Practically, the theory of contestability simply demonstrates how the threat of entry can restrain prices, and the continuum of pricing
out-tion is so intense that it never happens. J. TIROLE, THE THEORY OF INDUSTRIAL ECONOMICS
205-6 (1995).
55. Economists have developed more general models of firm interactions than allow the interaction of firms to vary between monopoly and perfect competition. See, e.g., S TE-PHEN MARTIN, ADVANCED INDUSTRIAL ECONOMICS 13-46 (1993).
56. NRRI STUDY, supra note 29, at 44.
57. Contestability theory holds that competitive-like outcomes can be obtained with monopoly supply as long as there is a threat of hit-and-run entry. If the monopolist raises its price above average cost, then firms enter. If the price falls, then firms exit. The free-flow of profit seekers keeps price at average cost, thereby attracting no attention. WILLIAM
J. BAUMOL ET AL., CONTESTABLE MARKETS AND THE THEORY OF INDUSTRY(1982).
comes depends on entry and exit costs. If entry and exit costs are high, then entry is unlikely, and incumbent firms will have more pricing free-dom. If entry is easy, then any attempt to extract profits in the market will attract new rivals.
Certainly, the ease of entry into markets for high capacity services is disputed. But in the recent NRRI Study, the conclusion is that entry and exit costs are low for some significant rivals in the markets for high ca-pacity services. Markets for high caca-pacity services are, according to NRRI, contestable to a significant degree. First, as the NRRI Study finds, “many firms compete in special access markets, including wireline CLECs, cable television providers, and fixed wireless providers. These competitors are claiming larger market shares.”59 So, there are
competi-tors already in the market, and they are growing.60 The NRRI Study,
however, wrongly concludes that this evidence is consistent with contest-ability theory. Contestcontest-ability is about pricing decisions when entry does not occur, not when it does. The presence of competitors is actual, not potential, competition.
Second, the NRRI Study concludes that contestability is relevant in cases where entry has yet to occur. The Report states correctly that “[t]he economic forces that limit landline competition for channel termi-nations have little or no bearing on newer technologies,” and that these newer “technologies can provide acceptable substitutes for special access channel terminations, and their providers can have lower entry and exit costs.”61 In fact, for cable systems, the NRRI Study concludes that “entry
cost is low,” since “[o]nce a cable television provider has made this transi-tion, it can offer a substitute for special access at a small incremental cost. Cable television systems also have low exit costs for special access, so long as they remain in the underlying cable business.”62 In addition,
the authors also claim that fixed wireless service has a “relatively low entry cost even in low-density areas. Since wireless transmitters can be used simultaneously for multiple customers, the cost of serving a single additional customer is usually very low. Likewise, where a provider serves multiple customers from a single broadcast unit, the provider faces little financial risk from losing a single customer.”63
59. Id. at 53.
60. C.f., Stephen Lawson, Sprint Picks Wireless Backhaul for WiMax,COMPUTERWORLD
(Jul. 10, 2008), http://news.idg.no/cw/art.cfm?id=0A60E6EC-17A4-0F78-310D53B63B82F1 6B (quoting Sprint CTO Barry West’s observation that “relatively abundant and inexpen-sive T-1 lines” exist in the U.S. market); see also Letter from Stephen F. Morris, supra note 32.
61. NRRI STUDY, supra note 29, at 56.
62. Id.
These statements suggest that both actual and potential competition are relevant in markets for high capacity services today. Consequently, even though one might observe highly concentrated market shares for high capacity services, the prices for those services may not be at super-competitive (and therefore socially undesirable) levels. In deriving con-clusions, however, the authors of the NRRI Study ignore their own dis-cussion and evidence on contestability.
3. Equilibrium Industry Structure
Another key consideration for modern communications policy ig-nored in the NRRI Study is that the sustainable number of firms in a market depends on the economic characteristics of the market, and not the desired, arbitrarily selected number of firms by some group of policy-makers, trade group presidents, legislators, or other types of social re-formers (no matter how well intentioned). Public policy cannot choose the long-run sustainable number of firms in a market, but can only take steps to affect the economic fundamentals of markets that influence the equilibrium number of firms.64 One clear example is investment tax
credits, which directly lower the fixed costs of entry by lowering taxes to offset (in part) such investments.65 In addition, since the sustainable
number of firms in a market is a function of the size of that market, public policy can help expand that market, say by removing interna-tional trade barriers (or ridding the influence of local franchise authori-ties over the entry decisions of those deploying advanced communications networks).66
Given the supply-side and demand-side conditions of the communi-cations markets (particularly the large fixed and sunk costs required by the business), these markets will always be relatively concentrated.67
64. See Ford et al., supra note 24, at 10.
65. See, e.g., Anastassios Gentzoglanis, Sunk Costs, Innovation, and Spillover Effects in R&D-Intensive Industries, 10 J. OF APPLIED BUS. RES. 1 (1994) (“grants, subsidies or tax
credits reduce the sunk character of firms’’ R&D investments”); SUTTON, supra note 48, at
31(“the number of entrants to the market increases steadily as the level of setup costs falls”).Whether or not tax incentives are sufficient to actually change industry structure is an empirical question.
66. The ability of international trade to expand markets and thereby reduce industry concentration is shown empirically in William F. Chappell & Bruce Yandle, An Entry Model of Import Penetration, 19 ATLANTIC ECON. J. 22 (1991).
67. Ford et al., supra note 24; see also Timothy F. Bresnahan et al., Do Entry Condi-tions Vary Across Markets? 1987 BROOKINGS PAPERS ON ECON. ACTIVITY 833 (1987); Ioannis
N. Kessides, Market Concentration, Contestability, and Sunk Costs, 72 REV. ECON. & STAT.
614 (1990); Ioannis N. Kessides, Advertising, Sunk Costs, and Barriers to Entry, 68 REV.
ECON. & STAT. 84 (1986); Catherine J. Morrison Paul, Cost Economies: A Driving Force for
Consolidation and Concentration?, 70 S. ECON. J. 110 (2003); Walter J. Mayer & William F.
But this fact need not imply regulation is needed or efficacious.68 The
mobile telephone industry, for example, has an HHI of nearly 3,000 (the number’s equivalent of about 3 equally sized firms), yet the industry per-forms well and has repeatedly been declared workably competitive by the FCC.69 Even in what used to be the long-distance industry, the three
largest firms (AT&T, MCI, and Sprint) controlled nearly 70% of that market for fifteen years after divestiture.70 Yet, this industry was easily
characterized as workably competitive, and the FCC did so.71 In essence,
workably competitive implies that the market is sufficiently competitive that regulation is unlikely to create any improvement in market per-formance and, in fact, is likely to make things worse.
There is an analogy in markets for high capacity services. In the Pricing Flexibility Order, the FCC granted pricing flexibility based on a proxy for competition and did so across a large geographic footprint. This decision was made with full recognition that “even if competition had not fully developed, the cost of regulating special access pricing was still greater than the benefits.”72 So, the motivation for special access
services cannot be based on an exceedingly na¨ıve view of competitive
out-Specifying the Dynamics of Industry Concentration, 34 J. INDUS. ECON. 55 (1985); Frederic
Jenny and Andre-Paul Weber, The Determinants of Concentration Trends in the French Manufacturing Sector, 26 J. INDUS. ECON. 193 (1978); Douglas F. Greer, The Causes of
Concentration in the US Brewing Industry, 21 Q. REV. ECON. & BUS. 87 (1981); Paul A.
Geroski et al,, The Dynamics of Market Structure, 5 INT’L J. OF INDUS. ORG. 93 (1987);
E.Woodward Eckard, Jr., Plant-level Scale Economies and Industrial Concentration, 34 Q. REV. ECON. & FIN. 173 (1994); and Mita Bhattacharya, Industrial Concentration and Com-petition in Malaysian Manufacturing, 34 APPLIED ECON. 2127 (2002).
68. In fact, the threshold for abandoning regulation has historically been quite low, and the thresholds have not been set only by the FCC. For example, history has shown that the presence of duopoly is generally sufficient grounds for deregulation. Congress de-cided in the 1992 Cable Act that an HHI of 8,600 (or 1.16 symmetric firms) was sufficient to deregulate cable television prices. See Communications Act Section 623 (l)(B), 47 U.S.C. § 543(l)(B). In the 1996 Telecommunications Act, the regulation of cable television prices was largely abandoned as the effort was widely recognized as an abysmal failure, despite very little terrestrial competition in cable. Telecommunications Act of 1996, Pub. L. No. 104-104, 110 Stat. 56 (1996).
69. In the Matter of Implementation of Section 6002(b) of the Omnibus Budget Recon-ciliation Act of 1993, Annual Report and Analysis of Competitive Market Conditions With Respect to Commercial Mobile Services, WT Docket 08-27, Thirteenth Report, DA 09-54 ¶¶ 1, 6 (2009), available at http://hraunfoss.fcc.edocs_public/attachmatch/DA-09-54A1.pdf (FCC found that “there is effective competition in the CMRS market” while noting that the HHI was 2674).
70. FCC, TRENDS IN TELEPHONE SERVICE (2003), available at http://transition.fcc.gov/
Bureaus/Common_Carrier/Reports/FCC-State_Link/IAD/trend803.pdf. 71. Motion of AT&T Corp., supra note 44.
comes or of regulatory effectiveness; intervention must be rooted in the realities of the market and the realities of regulatory intervention.
4. The Literature on Rivalry in Concentrated Markets
Empirical and experimental research has shown that there is sub-stantial variation in the relationship between the number of firms (or industry concentration) and prices/profits across industries or over time.73 There are many empirical studies showing a positive
relation-ship between concentration and prices/profits, but there also exists a large literature showing no link between the two.
Econometric research finds support for the Cournot outcome, as well as more and less competitive outcomes. Iwata (1974) could not reject Cournot outcome in the Japanese glass industry, and Brander and Zhang (1990, 1993) find evidence of Cournot outcomes in the U.S. airline industry.74 Haskel and Martin (1994) find support for Cournot over
Ber-trand behavior when firms face capacity constraints.75 But, Berg and
Kim (1994) reject Cournot behavior in the Norwegian banking industry, and Ford (2000) presents evidence that the international message tele-phone industry is more competitive than Cournot.76 Karp and Perloff
73. See, e.g., Michael Salinger et al., The Concentration-Margins Relationship Recon-sidered, 1990 BROOKINGS PAPERS ON ECON. ACTIVITY 287 (1990); Gary Whalen, The
Deter-minants and Performance Effects of Rivalry in Local Banking Markets, 31 Q.J. BUS. &
ECON. 38 (1992) (“concentration affected neither rivalry nor profitability in the expected
manner”); Myron B. Slovin et al., Deregulation, Contestability, and Airline Acquisitions, 30 J. FIN. ECON. 231 (1991) (“changes in concentration after deregulation have no positive
effect on carrier returns”); John R. Schroeter, Estimating the Degree of Market Power in the Beef Packing Industry, 70 REV. ECON. & STAT. 158 (1988) (“there has been no real
worsen-ing of the market’s performance durworsen-ing the period of increasworsen-ing concentration”); Stephan A. Rhoades, Market Share as a Source of Market Power: Implications and Some Evidence, 37 J. ECON. & BUS. 343 (1985) (“market share per se is a source of high profits, regardless of
the level of concentration and after controlling for firm size”); Roger L. Beck & Sheila Mozejko, Concentration and Price/Cost Margins Across Time in Canada, 9 CAN. J. ADMIN.
SCI. 40 (1992) (“when a shift occurs from a single-point-in-time to a
sequential-points-in-time approach, there is no longer a consistent relationship between changes in concentra-tion and changes in profit margins”).
74. Gyoichi Iwata, Measurement of Conjectural Variations in Oligopoly, 42 ECONOMETRICA 947, 947-66 (1974); James A. Brander & Anming Zhang, Market Conduct in
the Airline Industry: An Empirical Investigation, 21 RAND J. ECON. 567, 567-83 (1990);
James A. Brander & Anming Zhang, Dynamic Oligopoly Behavior in the Airline Industry, 11 INT’L J. INDUS. ORG. 407, 407-35 (1993).
75. Jonathan Haskel & Chistohper Martin, Capacity and Competition: Empirical Evi-dence on UK Panel Data, 42 J. INDUS. ECON. 23, 23-44 (1994).
76. Sigbjorn Berg & Moshe Kim, Oligopolistic Interdependence and the Structure of Production in Banking: An Empirical Evaluation, 26 J. MONEY, CREDIT & BANKING 309,
309-22 (1994); George S. Ford, Flow-Through and Competition in the International Mes-sage Telephone Service Market, PHOENIX CENTER POL’Y PAPER NO. 7 (2000), available at
(1989) show that the oligopolistic rice market is closer to the competitive than the collusive outcome.77
Experimental research is particularly interesting on this point. Fouraker and Siegal (1963) evaluated the competitive behavior of 16 pairs of “student duopolists.”78 In seven of 16 games, about half of the
total, the Cournot equilibrium was observed. Other outcomes included five Bertrand (perfect competition) outcomes, three collusive outcomes, and one outcome between collusion and Cournot.79 In all, 76% of the
outcomes were Cournot competition or better. The average outcome was Cournot, but there were significant departures from Cournot behavior. These experiments illustrate the variety of outcomes possible with small number competition. Interestingly, when the experiment was extended to three players, the Bertrand outcome was the most common. Holt (1985) and Plott (1982) also find support for the Cournot outcome in experiments.80
A particularly relevant experimental study for high capacity ser-vices is found in Plott, Sugiyama, and Elbaz (1994).81 In this article, the
experiment involves price setting in the context of declining average costs (i.e., natural monopoly). While multiple firm outcomes were feasi-ble (the number of competitors was endogenous), it rarely occurred in the experimental setting; the presence of scale economies typically rendered a single seller in equilibrium. However, the single emerging seller did not offer its product at the monopoly price. Rather, the price of the seller was just high enough so that the seller did not make a loss (the second-best efficient prices). Consumers, then, made purchases at approxi-mately the lowest possible price absent subsidies to the seller. The re-sult was consistent with the predictions of contestability theory, which holds that a monopolist facing relatively easy entry will charge a price lower than the monopoly level. If entry is very easy, the monopolist’s
77. Larry S. Karp & Jeffrey M. Perloff, Dynamic Oligopoly in the Rice Export Market, 71 REV. ECON. & STAT. 462 (1989).
78. S. Siegel & D. L. Harnett, Bargaining Behavior: A Comparison Between Mature Industrial Personnel and College Students, 12 OPERATIONS RESEARCH 334 (1964).
79. In Bertrand competition in prices, firms choose price and sell whatever quantities consumers demand at that price. The equilibriums are very different between the (simple) Cournot and Bertrand models. Unlike the Cournot model, with Bertrand competition the perfectly competitive outcome is obtained with only two firms. In this sense, Bertrand is often viewed as “more competitive” than Cournot. An interesting and important point is that in a Bertrand setting, the HHI is a meaningless indicator of market power, since after the second entrant, the number of firms has no impact on price. MARTIN, supra note 46 at 35-43; CARLTON & PERLOFF, supra note 47, at 157-187.
80. Charles A. Holt, Jr., An Experimental Test of the Consistent-Conjectures Hypothe-sis, 75 AM. ECON. REV. 314, 314-25 (1985); Charles R. Plott, Industrial Organization Theory
and Experimental Economics, 20 J. ECON. LITERATURE 1485 (1982).
price is equal to the welfare maximizing price (subject to the constraint of zero profits for the firm).
Without question, the empirical economics literature discussed above supports neither a simple nor consistent relationship between in-dustry concentration and prices or profits. Competition among small numbers of firms can produce a variety of outcomes and assuming blindly, high concentration leads to high prices or is bad for consumers is inappropriate. The NRRI Study’s leap from high HHIs (even if well mea-sured) to market power is inconsistent with economic theory and evi-dence. No simple linkage is permitted, and this fact is widely recognized among economists and the theoretical foundation for caution is very well developed.
B. WHY ARMIS RATES OF RETURN ARE POOR INDICATORS OF MARKET POWER
As noted above, the NRRI Study observes, “market concentration does not, by itself, prove that a seller has excessive market power.”82
The bulk of both the GAO and NRRI studies, however, focused exclu-sively on market concentration data. Perhaps recognizing the limita-tions of this data, an attempt is made to provide other evidence supporting the market power hypothesis. For the NRRI Study, this ad-ditional evidence includes an analysis of rate-of-return statistics for the incumbent LECs.83
There are (at least) two central and significant shortcomings of the ARMIS rate of return analysis. First, the ARMIS data has a number of serious defects. It is a regulatory database, and the revenues and costs are allocated across different services, different regulatory regimes, and different regulatory geographies. The prospect that these allocations can render economically meaningful data is slim. Additionally, the ARMIS data does not measure economic costs, but regulatory accounting costs. While allocating costs based on rules of thumb is bad enough, the regula-tory depreciation rules render the rate-of-return calculations meaning-less from an economic standpoint. Market power is an economic phenomenon, not an accounting or regulatory one.84
82. NRRI STUDY, supra note 29, at 44.
83. As with prices, it is possible to link concentration to rates of return via theory. As mentioned earlier, however, this linkage is possible only under particular assumptions, including primarily the assumption of Cournot competition. See, e.g.,MARTIN, supra note
46, at 499-507.
84. The FCC has recognized that ARMIS is accounting, not economic, data, as ac-knowledged in the NRRI Study. NRRI STUDY, supra note 29, at 8 n.17. See also 2005
The ARMIS data is typically viewed with great skepticism by ana-lysts familiar with the database. Yet, the data has been used in many analyses calling for the tighter regulation of special access services.85 In
the NRRI Study, however, the authors agree that the “ARMIS figures are virtually meaningless [and] . . . unreliable”86— a serious indictment
by a group calling for increased regulation in the sector. Furthermore, the FCC has rejected the ARMIS data as probative in this very context, noting that “high or increasing rates of return calculated using regula-tory cost assignments for special access services do not in themselves indicate the exercise of monopoly power.”87 In some instances, the
ex-ceedingly high rates-of-return computed by some parties fail even the proverbial “red face test.”88
A serious and recognized problem with the use of the ARMIS data is that the FCC “froze” separations categories for large carriers in 2001, thereby locking in such allocations at year 2000 levels. In an effort to salvage the ARMIS data from this particular defect (but not the others), the authors of the NRRI Study made some adjustments to the data hop-ing to counter the impacts of the separations freeze. They admit, how-ever, that “no adjustment technique is available to us that could match the accuracy of direct assignment studies.”89 Nevertheless, calculations
are made of returns using the adjusted ARMIS data. No effort is made to demonstrate that the adjustments are plausibly accurate, and no effort is made to adjust for the differences in regulatory and economic deprecia-tions. Other criticisms of the adjustments made in the NRRI Study have been made.90
supra note 46, at 517-22; Ira Horowitz, The Misuses of Accounting Rates of Return: Com-ment, 74 AM. ECON. REV. 494, 494-500 (1984).
85. NRRI STUDY, supra note 29, at 69-71; N. Uri & P. Zimmerman, Market Power and the Deregulation of Special Access Service by the Federal Communications Commission, 13 INFO. & TELECOMM. TECH. L. 129, 173 (2004).
86. NRRI STUDY, supra note 29, at 70.
87. 2005 Special Access NPRM, supra note 20.
88. See, e.g., Written Testimony of Paul Schieber, V.P. Access & Roaming, Sprint Nextel Corp. on An Examination of Competition in the Wireless Industry, Before the House Subcommittee on Communications, Technology & the Internet 11 (May 7, 2009) available at http://democrats.energycommerce.house.gov/Press_111/20090507/testimony_schieber. pdf (claiming a 138% rate-of-return at the firm level).
89. NRRI STUDY, supra note 29, at 71.
90. Harold Ware, et al., Is More Special Access Regulation Needed? Reactions to the NRRI Study on Special Access Competition,NERA ECON. CONSULTING (2009), available at