Available Online at www.ijpret.com
194
INTERNATIONAL JOURNAL OF PURE AND
APPLIED RESEARCH IN ENGINEERING AND
TECHNOLOGY
A PATH FOR HORIZING YOUR INNOVATIVE WORK
SOIL NITROGEN DETECTION USING NEAR INFRARED SPECTROSCOPY
SNEHA J. BANSOD
Department of Electronics and Telecommunication, Government College of Engineering Amravati, India.
Accepted Date: 27/02/2014 ; Published Date: 01/05/2014
\
Abstract: Spectroscopy is a rapid, simple, non-destructive and analytical technique, which has been increasingly used for agricultural and food analysis processes. Soil nitrogen, being an important macronutrient of the soil, measurement of total Nitrogen (TN) content can be used as an index of crop productivity. Near Infrared (NIR) spectroscopy can accurately predict the soil nitrogen content by evaluating reflected Near Infra-red rays intensity. The
designed Nitrogen estimation model resulted in correlation coefficient (R2) of 0.82. The need
of expensive and bulky spectrometers is eliminated by use of light-emitting diode (LED) as a Near Infra-red light source, making the system cost effective and portable.
Keywords: Spectroscopy, Near Infrared (NIR), Total Nitrogen (TN), Spectrometers, LED
Corresponding Author: MS. SNEHA J. BANSOD
Access Online On:
www.ijpret.com
How to Cite This Article:
Sneha Bansod, IJPRET, 2014; Volume 2 (9): 194-199
Available Online at www.ijpret.com
195 INTRODUCTION
Near Infrared reflectance spectroscopy (NIRS) is the rapid, non-destructive analytical technique which can estimate standard soil characteristics without using chemicals. It is a spectro-photometric method that deals with the interactions of near infrared radiation with the sample under investigation. It is based on the absorption of electromagnetic radiation at wavelengths in the range of 780-2500 nm. Each constituent of a complex organic mixture has unique absorption properties in the NIR region (780-2500 nm) due to stretching and bending vibrations of molecular bonds between elements (Morra et al 1991).
To generate a soil spectrum, radiation containing all relevant frequencies in the particular range is directed to the sample. Depending on the constituents present in the soil the radiation will cause individual molecular bonds to vibrate, either by bending or stretching and they will absorb light to various degrees with a specific energy quantum corresponding to the difference between two energy levels. As the energy quantum is directly related to frequency and inversely related to wavelength, the resulting absorption spectrum produces a characteristic shape that can be used for analytical purposes (Miller et al 2001).
The wavelength at which the absorption takes place (i.e. the size of the energy quantum) depends also on the chemical matrix and environmental factors such as neighbouring functional groups and temperature, allowing for the detection of a range of molecules which may contain the same type of bonds (Stenberg B., Raphael A. et al 2010).
This property of Spectroscopy, to characterize material according to the reflectance, has been used in many areas, such as the food industry, petrochemical industry, and in agriculture. The study shows that prediction of residual nitrate or nitrogen content is possible by spectroscopy. NIRS technology has been applied in many areas, such as the food industry, petrochemical industry, and in agriculture, because of its testing speed, low cost and non-destructive as well as real-time testing (Xiaofei A., Minzan L. et al 2013).
Available Online at www.ijpret.com
196 SOIL SAMPLE PREPARATION
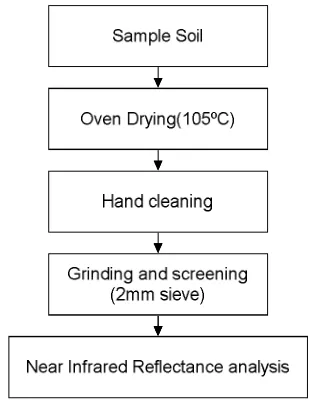
Soil moisture content and soil particle size are the main factors influencing the measurement accuracy in addition to soil colour. Similarly, spectra pre-processing, sample preparation, size of calibration area, spectrophotometer wavelength range and type of detectors and calibration methods also affect calibration accuracy. Before scanning soil samples, a preparation procedure need to be defined. Following is the sample preparation steps necessary before soil spectroscopic analysis.
Figure 1. Sample preparation steps
Based on the studies, it was decided to work with 2mm crushed and sieved soil samples. (Valerie G., Gilles C. et al 2011)
SYSTEM DESIGN
Available Online at www.ijpret.com
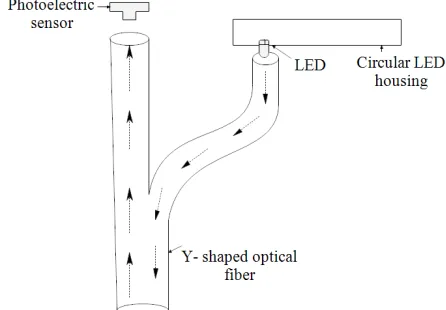
197 Figure 2. System design
and transferred to the photoelectric sensor, through which the optical signal is converted to an electrical signal. Subsequently, the electrical signal is amplified to achieve adequate voltage level and amplified signal thus obtained is then digitized using ADC, and the absorbance at each wavelength is calculated. Calibration of the result is done for estimation of Nitrogen content of the soil from the device output and known to achieve optimal accuracy. Finally, the calculated soil TN content is displayed on the LCD display.
RESULTS AND DISCUSSIONS
Absorbance is selected as the spectral parameter. A standard whiteboard is taken as reference, which is needed to obtain the absorbance of the soil samples. The output voltage Vi is obtained
from the reflected rays due to the standard whiteboard. Then, the output voltage Vo
corresponding to the required soil sample. The reflectance Ri and absorbance Ai of every soil
sample can be calculated according to equations (1) and (2) (Xiaofei A., Minzan L. et al 2013).
= × 100% (1)
= log (2)
Where, i indicates 1550, 1300, 1200, 1100, 1050 and 940 nm; Vi is the standard whiteboard
output voltage at i; V0 is the soil sample output voltage at i; Ri is the reflectance at i and Ai is the
Available Online at www.ijpret.com
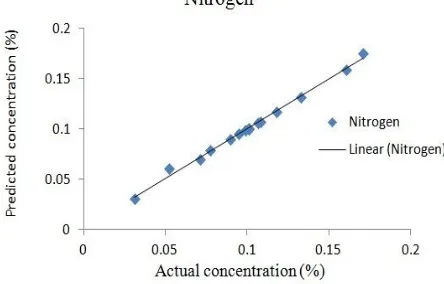
198 Figure 3. Calibration curve of Nitrogen
From the result, accurate predictions of nitrogen were obtained. The regression coefficient R2
obtained for the device is 0.82. Thus, the device can be used for determination of Nitrogen content of the soil. Results show that, prediction accuracy has increased due to pre-sample preparation procedure.
CONCLUSION
Nitrogen being the key component for plant growth, the knowledge about soil Nitrogen content will be beneficial for farmers to improve crop production. Spectroscopy technique has been
successfully used for soil Nitrogen contents with R2 equal to 0.82.
The accomplishments reviewed in this paper, have led to the modified model consisting of six LEDs corresponding to wavelengths 1550, 1300, 1200, 1100, 1050 and 940 nm, as a NIR light source. Thus, a portable and cost effective TN detector model is developed, eliminating the need of expensive and bulky spectrometers.
REFERENCES
1. Xiaofei A., Minzan L., Lihua Z., Yumeng L. and Hong S., A portable soil nitrogen detector
based on NIRS, Springer Science, 2013.
2. Sudduth K. A. and Hummel J. W.(1993), Soil organic matter, CEC, and moisture sensing with a
portable NIR spectrophotometer, Transactions of the ASAE,1993; 36(6): 1571-1582.
3. Adamchuk V. I., Hummel J. W., Morgan M. T. and Upadhyaya S. K., On-the-go soil sensors for
Available Online at www.ijpret.com
199
4. Wetterlind, Visible and Near Infrared Spectroscopy in Soil Science, Advances in Agronomy,
2010; 107: 163-215.
5. Stenberg B., Raphael A. Viscarra Rossel, Abdul Mounem Mouazen and Johanna Valerie G.,
Gilles C., Laurent B., Dominique V., Vorick R. and Pierre D., Near infrared reflectance spectroscopy for estimating soil characteristics valuable in the diagnosis of soil fertility, Journal of near Infrared Spectroscopy, 2011; 19: 117-120.
6. Morra M.J., HaLL M.H. and Freeborn L.L., Carbon and nitrogen analysis of soiL fractions using
near- infrared ref lectance spectroscopy, Soil Sd. Soc. Am. J., 1991; 55: 288-291.
7. Miller and C. E., Chemical principles of near-infrared technology, Near-Infrared Technology in
the Agricultural and Food Industries (P. Williams and K. Norris, Ed.), 2001: 19-37.
8. Viscarra R., Walvoort and A.B. Mc Bratney, Visible, near infrared, mid infrared or combined