Mounika et al. World Journal of Pharmaceutical and Life Sciences
ANALYTICAL METHOD DEVELOPMENT VALIDATION OF MEROPENEM AND
VABORBACTAM OF PURE AND DOSAGE FORMS USING RP-HPLC METHOD
K. Mounika*, L. Ramachandra Reddy and D. Dhachinamoorthi
Department of Pharm. Analysis and Quality Assurance, QIS College of Pharmacy, Ongole-523272.
Article Received on 20/07/2019 Article Revised on 10/08/2019 Article Accepted on 31/08/2019
INTRODUCTION
The quality of a drug plays an important role in ensuring the safety and efficacy of the drugs. Quality assurance and control of pharmaceutical and chemical formulations is essential for ensuring the availability of safe and effective drug formulations to consumers. Hence
Analysis of pure drug substances and their
pharmaceutical dosage forms occupies a pivotal role in assessing the suitability to use in patients. The quality of the analytical data depends on the quality of the methods
employed in generation of the data[1] Hence,
development of rugged and robust analytical methods is very important for statutory certification of drugs and their formulations with the regulatory authorities.
The quality and safety of a drug is generally assured by monitoring and controlling the assay and impurities effectively. While assay determines the potency of the drug and impurities will determine the safety aspect of the drug. Assay of pharmaceutical products plays an important role in efficacy of the drug in patients.
The wide variety of challenges is encountered while developing the methods for different drugs depending on its nature and properties. This along with the importance of achieving the selectivity, speed, cost, simplicity,
sensitivity, reproducibility and accuracy of results gives an opportunity for researchers to come out with solution to address the challenges in getting the new methods of analysis to be adopted by the pharmaceutical industry and chemical laboratories. Different physico-chemical methods (1) are used to study the physical phenomenon that occurs as a result of chemical reactions. Among the physico-chemical methods, the most important are optical (refractometry, polarimetry, emission and
fluorescence methods of analysis), photometry
(photocolorimetry and spectrophotometry covering UV-Visible, IR Spectroscopy and nepheloturbidimetry) and chromatographic (column, paper, thin layer, gas liquid and high performance liquid chromatography) methods. Methods such as nuclear magnetic resonance (NMR) and para magnetic resonance (PMR) are becoming more and more popular. The combination of mass spectroscopy (MS) with gas chromatography is one of the most powerful tools available. The chemical methods include the gravimetric and volumetric procedures which are based on complex formation; acid-base, precipitation and redox reactions. Titrations in non-aqueous media and complexometry have also been used in pharmaceutical analysis. The number of new drugs is constantly growing. This requires new methods for controlling their quality. Modern pharmaceutical analysis must need the following requirements.
World Journal of Pharmaceutical and Life Sciences
WJPLS
www.wjpls.org
SJIF Impact Factor: 5.088*Corresponding Author: K. Mounika
Department of Pharm. Analysis and Quality Assurance, QIS College of Pharmacy, Ongole-523272.
ABSTRACT
A simple, Accurate, precise method was developed for the simultaneous estimation of the Meropenem and Vaborbactam in Tablet dosage form. Chromatogram was run through Agilent C18 (150 x 4.6 mm, 5) Mobile
phase containing Buffer 0.01N KH2PO4: Methanol taken in the ratio 50:50 was pumped through column at a flow
rate of 0.8 ml/min. PH adjusted to 5.0 with dil. Orthophosphoric acid solution. Temperature was maintained at 30°C. Optimized wavelength selected was 260 nm. Retention time of Meropenem and Vaborbactam were found to be 2.1119 min and 2.654 min. %RSD of the Meropenem and Vaborbactam were and found to be 0.7 and 0.7 respectively. %Recovery was obtained as 99.52% and 100.04% for Meropenem and Vaborbactam respectively. LOD, LOQ values obtained from regression equations of Meropenem and Vaborbactam were 0.07, 0.21 µg/ml and 0.07, 0.21 µg/ml respectively. Regression equation of Meropenem is y = 8848.x + 698.1, and y = 8748.x + 998.1of Vaborbactam. Retention times were decreased and that run time was decreased, so the method developed was simple and economical that can be adopted in regular Quality control test in Industries.
1. The analysis should take a minimal time.
2. The accuracy of the analysis should meet the
demands of Pharmacopoeia.
3. The analysis should be economical.
4. The selected method should be precise and selective.
1.1 Chromatography
Chromatography (Chroma means „color‟ and graphein means to „write‟) is the collective term for a set of laboratory techniques for the separation of mixtures. It
involves passing a mixture dissolved in a "mobile phase" through a stationary phase,[2-4] which separates the analyte to be measured from other molecules in the mixture based on differential partitioning between the mobile and stationary phases. Differences in compounds partition coefficient results in differential retention on the stationary phase and thus changing the separation.
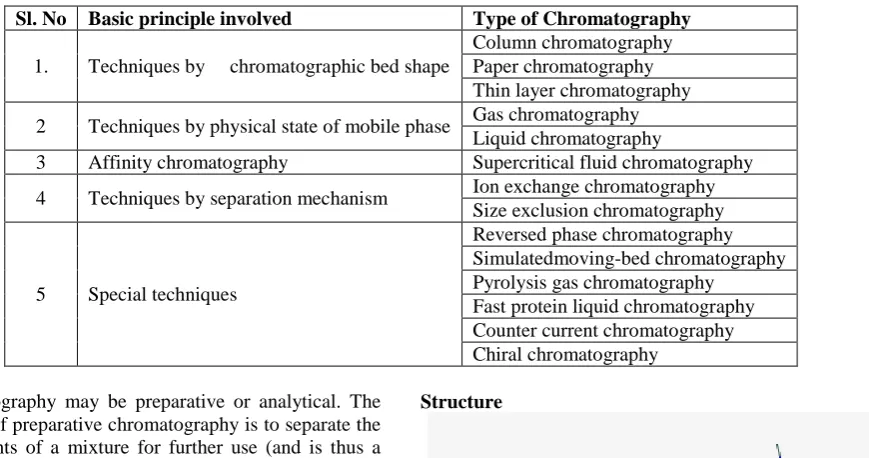
Different types of chromatographic techniques were summarized in
Table 1.1 Different types of chromatographic techniques.
Sl. No Basic principle involved Type of Chromatography
1. Techniques by chromatographic bed shape
Column chromatography Paper chromatography Thin layer chromatography
2 Techniques by physical state of mobile phase Gas chromatography
Liquid chromatography
3 Affinity chromatography Supercritical fluid chromatography
4 Techniques by separation mechanism Ion exchange chromatography
Size exclusion chromatography
5 Special techniques
Reversed phase chromatography Simulatedmoving-bed chromatography Pyrolysis gas chromatography
Fast protein liquid chromatography Counter current chromatography Chiral chromatography
Chromatography may be preparative or analytical. The purpose of preparative chromatography is to separate the components of a mixture for further use (and is thus a form of purification). Analytical chromatography is done normally with smaller amounts of material and is for measuring the relative proportion of analytes in a mixture.
3. Drug Profile[25-39] Meropenem
Meropenem is a broad-spectrum carbapenem antibiotic. It is active against Gram-positive and Gram-negative bacteria. Meropenem exerts its action by penetrating bacterial cells readily and interfering with the synthesis of vital cell wall components, which leads to cell death.
In August 2017, a combination antibacterial therapy under the market name vabomere was approved for treatment of adult patients with complicated urinary tract infections (cUTI). Vabomere consists of meropenem and Vaborbactam and is intravenously admininstered. The treatment aims to resolve infection-related symptoms and achieve negative urine culture, where the infections are proven or strongly suspected to be caused by susceptible bacteria.
Structure
Fig. 2.1: Meropenem structure.
Vaborbactam
Description: Vaborbactam has been used in trials studying the treatment of Bacterial Infections, Subjects With Normal Renal Function, and Subjects With Varying Degrees of Renal Insufficiency.
Structure
Fig.2.2: Vaborbactam.
5. MATERIALS AND METHODS
Materials
Meropenem and Vaborbactam pure drugs (API)
Combination Meropenem and Vaborbactam Injection (Vabomere) Manufactured by: Facta Farmaceutici
Distilled water, Acetonitrile, Phosphate buffer,
Methanol, Potassium dihydrogen ortho phosphate buffer, Ortho-phosphoric acid. All the above chemicals and solvents are from Rankem
Instruments
Electronics Balance-Denver
pH meter -BVK enterprises, India
Ultrasonicator-BVK enterprises
WATERS HPLC 2695 SYSTEM equipped with
quaternary pumps, Photo Diode Array detector and Auto sampler integrated with Empower 2 Software.
UV-VIS spectrophotometer PG Instruments T60
with special bandwidth of 2 mm and 10mm and matched quartz cells integrated with UV win 6 Software was used for measuring absorbances of Meropenem and Vaborbactam solutions.
Methods
Diluent: Based up on the solubility of the drugs, diluent was selected, Methanol and Water taken in the ratio of 50:50
Preparation of Standard stock solutions: Accurately
weighed 25mg of Meropenem and 25mg of Vaborbactam and transferred to 25ml volumetric flask. And 3/4 th of diluents was added to these flask and sonicated for 10 minutes. Flask were made up with diluents and labeled as Standard stock solution. (1000µg/ml of Meropenem and 1000µg/ml of vaborbactam).
Preparation of Standard working solutions (100% solution): 1ml from each stock solution was pipetted out and taken into a 10ml volumetric flask and made up with diluent. (100µg/ml Meropenem of and 100µg/ml of vaborbactam)
Preparation of Sample stock solutions: 1g of dry
powder (for injection) was weighed and transferred to 500 ml volumetric flask, to this 5 ml of acetonitrile was added and sonicated. Volume was made upto 500 ml with diluents and filtered through 0.45 µm or finer porosity membrane filter (1000µg/ml of Meropenem and 1000µg/ml of Vaborbactam)
Preparation of Sample working solutions (100% solution): 0.5ml of filtered sample stock solution was transferred to 10ml volumetric flask and made up with diluent. (100µg/ml of Meropenem and 100µg/ml of Vaborbactam).
Preparation of buffer
0.01N KH2PO4 Buffer:Accurately weighed 1.36gm of
Potassium dihyrogen Ortho phosphate in a 1000ml of Volumetric flask add about 900ml of milli-Q water added and degas to sonicate and finally make up the
volume with water then PH adjusted to 5.0 with dil. Orthophosphoric acid solution.
Validation
System suitability parameters
The system suitability parameters were determined by preparing standard solutions of Meropenem (100ppm) and Vaborbactam (100ppm) and the solutions were injected six times and the parameters like peak tailing, resolution and USP plate count were determined.
The % RSD for the area of six standard injections results should not be more than 2%.
Specificity: Checking of the interference in the
optimized method. We should not find interfering peaks in blank and placebo at retention times of these drugs in this method. So this method was said to be specific.
Precision
Preparation of Standard stock solutions: Accurately
weighed 25mg of Meropenem and 25mg of Vaborbactam and transferred to 25ml volumetric flask. and 3/4 th of diluents was added to these flask and sonicated for 10 minutes. Flask were made up with diluents and labeled as Standard stock solution. (1000µg/ml of Meropenem and 1000µg/ml of vaborbactam).
Preparation of Standard working solutions (100% solution): 1ml from each stock solution was pipetted out and taken into a 10ml volumetric flask and made up with diluent. (100µg/ml of Meropenem and 100µg/ml of Vaborbactam).
Preparation of Sample stock solutions: 1g of dry
powder (for injection) was weighed and transferred to 500 ml volumetric flask, to this 5 ml of acetonitrile was added and sonicated. Volume was made upto 500 ml with diluents and filtered through 0.45 µm or finer porosity membrane filter (1000µg/ml of Meropenem and 1000µg/ml of Vaborbactam).
Preparation of Sample working solutions (100% solution): 0.5ml of filtered sample stock solution was transferred to 10ml volumetric flask and made up with diluent. (100µg/ml of Meropenem and 100µg/ml of Vaborbactam).
Linearity
Preparation of Standard stock solutions: Accurately
weighed 25mg of Meropenem and 25mg of Vaborbactam and transferred to 50ml volumetric flask. and 3/4 th of diluents was added to these flask and sonicated for 10 minutes. Flask were made up with diluents and labeled as Standard stock solution. (1000µg/ml of Meropenem and 1000µg/ml of vaborbactam).
50% Standard solution: 0.5ml each from two standard stock solutions was pipetted out and made up to 10ml. (50µg/ml of Meropenem and 50µg/ml of Vaborbactam)
75% Standard solution: 0.75ml each from two standard stock solutions was pipetted out and made up to 10ml. (75µg/ml of Meropenem and 75µg/ml of Vaborbactam)
100% Standard solution: 1.0ml each from two standard stock solutions was pipetted out and made up to 10ml.
(100µg/ml of Meropenem and 100µg/ml of
Vaborbactam)
125% Standard solution: 1.25ml each from two
standard stock solutions was pipetted out and made up to 10ml. (125µg/ml of Meropenem and 125µg/ml of Vaborbactam)
150% Standard solution: 1.5ml each from two standard stock solutions was pipettede out and made up to 10ml
(150µg/ml of Meropenem and 150µg/ml of
Vaborbactam)
Accuracy
Preparation of Standard stock solutions: Accurately
weighed 25mg of Meropenem and 25mg of Vaborbactam and transferred to 50ml volumetric flask. and 3/4 th of diluents was added to these flask and sonicated for 10 minutes. Flask were made up with diluents and labeled as Standard stock solution. (1000µg/ml of Meropenem and 1000µg/ml of vaborbactam).
Preparation of 50% Spiked Solution: 0.5ml of sample
stock solution was taken into a 10ml volumetric flask, to that 1.0ml from each standard stock solution was pipetted out, and made up to the mark with diluent.
Preparation of 100% Spiked Solution: 1.0ml of
sample stock solution was taken into a 10ml volumetric flask, to that 1.0ml from each standard stock solution was pipetted out, and made up to the mark with diluent.
Preparation of 150% Spiked Solution: 1.5ml of
sample stock solution was taken into a 10ml volumetric flask, to that 1.0ml from each standard stock solution was pipetted out, and made up to the mark with diluent.
Acceptance Criteria
The % Recovery for each level should be between 98.0 to 102.
Robustness: Small deliberate changes in method like
Flow rate, mobile phase ratio, and temperature are made but there were no recognized change in the result and are within range as per ICH Guide lines.
Robustness conditions like Flow minus (0.9ml/min), Flow plus (1.1ml/min), mobile phase minus, mobile phase plus, temperature minus (25°C) and temperature plus(35°C) was maintained and samples were injected in
duplicate manner. System suitability parameters were not much effected and all the parameters were passed. %RSD was within the limit.
LOD sample Preparation: 0.25ml each from two standard stock solutions was pipetted out and transferred to two separate 10ml volumetric flasks and made up with diluents. From the above solutions 0.1ml each of Meropenem and Vaborbactam solutions respectively were transferred to 10ml volumetric flasks and made up with the same diluents
LOQ sample Preparation: 0.25ml each from two standard stock solutions was pipetted out and transferred to two separate 10ml volumetric flask and made up with diluent. From the above solutions 0.3ml each of Meropenem and Vaborbactam solutions respectively were transferred to 10ml volumetric flasks and made up with the same diluent.
Degradation studies Oxidation
To 1 ml of stock solution of Meropenem and Vaborbactam, 1 ml of 20% hydrogen peroxide (H2O2) was added separately. The solutions were kept for 30 min at 600c. For HPLC study, the resultant solution was diluted to obtain 100µg/ml&100µg/ml solution and 10 µl were injected into the system and the chromatograms were recorded to assess the stability of sample.
Acid Degradation Studies
To 1 ml o f stock s solution Meropenem and Vaborbactam, 1 ml of 2N Hydrochloric acid was added
and refluxed for 30mins at 600c .The resultant
solution was diluted to obtain 100µg/ml&100µg/ml solution and 10 µl solutions were injected into the system and the chromatograms were recorded to assess the stability of sample.
Alkali Degradation Studies
To 1 ml of stock solution Meropenem and Vaborbactam, 1 ml of 2N sodium hydroxide was added
and refluxed for 30mins at 600c. The resultant
solution was diluted to obtain 100µg/ml&100µg/ml solution and 10 µl were injected into the system and the chromatograms were recorded to assess the stability of sample.
Dry Heat Degradation Studies
The standard drug solution w a s placed in oven at 105°C for 1 h to study dry heat degradation. For HPLC
study, the resultant solution was diluted to
100µg/ml&100µg/ml solution and10µl were injected into the system and the chromatograms were recorded to assess the stability of the sample.
Photo Stability studies
to UV Light by keeping the beaker in UV Chamber for 1days or 200 Watt hours/m2 in photo stability chamber. For HPLC study, the resultant solution was diluted to obtain 100µg/ml&100µg/ml solutions and 10 µl were injected into the system and the chromatograms were recorded to assess the stability of sample.
Neutral Degradation Studies
Stress testing under neutral conditions was studied by refluxing the drug in water for 1h r s at a
temperature of 60º. For HPLC study, the resultant solution was diluted to 100µg/ml&100µg/ml solution and 10 µl were injected into the system and the chromatograms were recorded to assess the stability of the sample.
RESULTS AND DISCUSSION
Determination of λmax and Optimized wavelength
Fig. 6.1: Individual UV spectra of Meropenem and Vaborbactam.
Fig. 6.2: Overlay UV spectra of Meropenem and Vaborbactam.
Optimized method
Chromatographic conditions
Mobile phase: 50% 0.01N KH2PO4:50% Methanol
Flow rate: 0.8 ml/min
Column : Agilent C18 (4.6 x 150mm, 5µm) Detector wave length: 260nm
Column temperature: 30°C
Injection volume: 10L
Run time: 5min
Diluent: Water and Methanol in the ratio 50:50 Results: Both peaks have good resolution, tailing
Factor, theoretical plate count and resolution.
Fig. 6.8: Optimized Chromatogram.
Table 6.1: System suitability parameters for Meropenem and Vaborbactam.
S no Meropenem Vaborbactam
Inj RT(min) USP Plate Count Tailing RT(min) USP Plate Count Tailing Resolution
1 2.109 3461 1.29 2.639 5476 1.29 3.5
2 2.111 3569 1.24 2.64 5727 1.27 3.6
3 2.114 3477 1.24 2.642 5583 1.29 3.6
4 2.115 3396 1.24 2.645 5319 1.27 3.6
5 2.119 3306 1.29 2.654 5422 1.26 3.6
6 2.122 3485 1.29 2.654 4771 1.31 3.5
Linearity
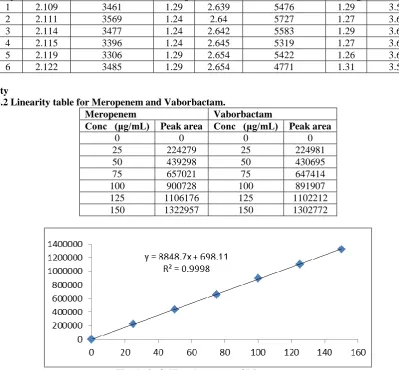
Table 6.2 Linearity table for Meropenem and Vaborbactam.
Meropenem Vaborbactam
Conc (μg/mL) Peak area Conc (μg/mL) Peak area
0 0 0 0
25 224279 25 224981
50 439298 50 430695
75 657021 75 647414
100 900728 100 891907
125 1106176 125 1102212
150 1322957 150 1302772
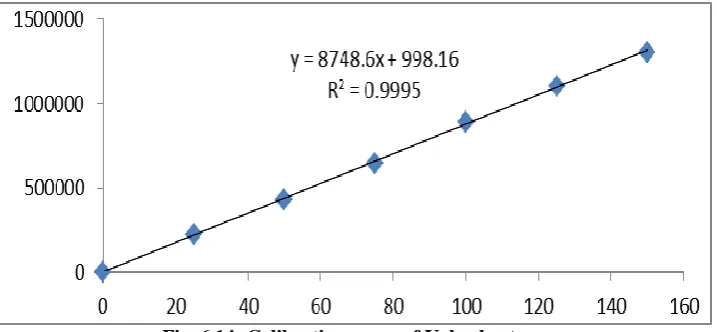
Fig. 6.14: Calibration curve of Vaborbactam.
Precision System Precision
Table 6.3 System precision table of Meropenem and Vaborbactam.
S. No Area of Meropenem Area of Vaborbactam
1. 891526 890233
2. 900923 899278
3. 892902 894054
4. 892658 892473
5. 899923 895535
6. 881770 878965
Mean 893284 891756
S.D 6908.4 6965.4
%RSD 0.8 0.8
Repeatability
Table 6.4 Repeatability table of Meropenem and Vaborbactam.
S. No Area of Meropenem Area of Vaborbactam
1. 892702 887557
2. 893419 889201
3. 893353 892464
4. 909064 904282
5. 898243 897765
6. 894669 890771
Mean 896908 893673
S.D 6278.0 6270.3
%RSD 0.7 0.7
Intermediate precision (Day_ Day Precision)
Table 6.5: Intermediate precision table of Meropenem and Vaborbactam.
S. No Area of Meropenem Area of Vaborbactam
1. 809316 797098
2. 813755 792039
3. 809719 801354
4. 799339 797164
5. 818320 790217
6. 801625 791052
Mean 808679 794821
S.D 7172.1 4393.1
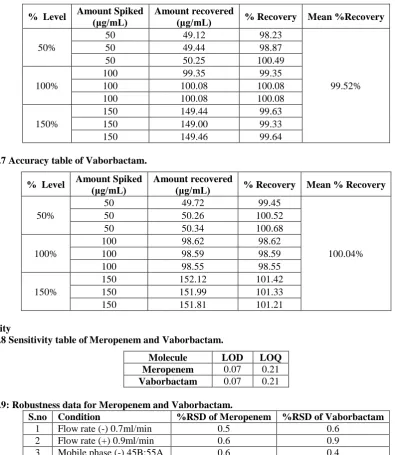
Accuracy
Table 6.6: Accuracy table of Meropenem.
% Level Amount Spiked
(μg/mL)
Amount recovered
(μg/mL) % Recovery Mean %Recovery
50%
50 49.12 98.23
99.52%
50 49.44 98.87
50 50.25 100.49
100%
100 99.35 99.35
100 100.08 100.08
100 100.08 100.08
150%
150 149.44 99.63
150 149.00 99.33
150 149.46 99.64
Table 6.7 Accuracy table of Vaborbactam.
% Level Amount Spiked (μg/mL) Amount recovered (μg/mL) % Recovery Mean % Recovery
50%
50 49.72 99.45
100.04%
50 50.26 100.52
50 50.34 100.68
100%
100 98.62 98.62
100 98.59 98.59
100 98.55 98.55
150%
150 152.12 101.42
150 151.99 101.33
150 151.81 101.21
Sensitivity
Table 6.8 Sensitivity table of Meropenem and Vaborbactam.
Molecule LOD LOQ
Meropenem 0.07 0.21
Vaborbactam 0.07 0.21
Table 6.9: Robustness data for Meropenem and Vaborbactam.
S.no Condition %RSD of Meropenem %RSD of Vaborbactam
1 Flow rate (-) 0.7ml/min 0.5 0.6
2 Flow rate (+) 0.9ml/min 0.6 0.9
3 Mobile phase (-) 45B:55A 0.6 0.4
4 Mobile phase (+) 55B:45A 0.5 0.1
5 Temperature (-) 25°C 0.4 0.2
6 Temperature (+) 35°C 0.3 0.4
Assay: The Medicines Company, bearing the label claim containing meropenem 1g + vaborbactam 1g (Vabomere (injection, sterile powder for reconstitution))Assay was
Table 6.10: Assay Data of Meropenem.
S. no Standard Area Sample area % Assay
1 891526 892702 99.54
2 900923 893419 99.62
3 892902 893353 99.61
4 892658 909064 101.36
5 899923 898243 100.15
6 881770 894669 99.75
Avg 893284 896908 100.00
Stdev 6908.4 6278.0 0.70
%RSD 0.8 0.7 0.7
.
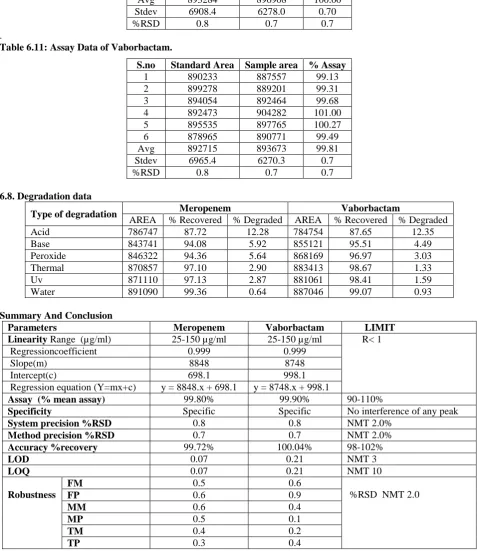
Table 6.11: Assay Data of Vaborbactam.
S.no Standard Area Sample area % Assay
1 890233 887557 99.13
2 899278 889201 99.31
3 894054 892464 99.68
4 892473 904282 101.00
5 895535 897765 100.27
6 878965 890771 99.49
Avg 892715 893673 99.81
Stdev 6965.4 6270.3 0.7
%RSD 0.8 0.7 0.7
6.8. Degradation data
Type of degradation Meropenem Vaborbactam
AREA % Recovered % Degraded AREA % Recovered % Degraded
Acid 786747 87.72 12.28 784754 87.65 12.35
Base 843741 94.08 5.92 855121 95.51 4.49
Peroxide 846322 94.36 5.64 868169 96.97 3.03
Thermal 870857 97.10 2.90 883413 98.67 1.33
Uv 871110 97.13 2.87 881061 98.41 1.59
Water 891090 99.36 0.64 887046 99.07 0.93
Summary And Conclusion
Parameters Meropenem Vaborbactam LIMIT
Linearity Range (µg/ml) 25-150 µg/ml 25-150 µg/ml R< 1
Regressioncoefficient 0.999 0.999
Slope(m) 8848 8748
Intercept(c) 698.1 998.1
Regression equation (Y=mx+c) y = 8848.x + 698.1 y = 8748.x + 998.1
Assay (% mean assay) 99.80% 99.90% 90-110%
Specificity Specific Specific No interference of any peak
System precision %RSD 0.8 0.8 NMT 2.0%
Method precision %RSD 0.7 0.7 NMT 2.0%
Accuracy %recovery 99.72% 100.04% 98-102%
LOD 0.07 0.21 NMT 3
LOQ 0.07 0.21 NMT 10
Robustness
FM 0.5 0.6
%RSD NMT 2.0
FP 0.6 0.9
MM 0.6 0.4
MP 0.5 0.1
TM 0.4 0.2
CONCLUSION
A simple, Accurate, precise method was developed for the simultaneous estimation of the Meropenem and Vaborbactam in injection dosage form. Retention time of Meropenem and Vaborbactam were found to be 2.119 min and 2.654 min. %RSD of the Meropenem and Vaborbactam were and found to be 0.7 and 0.7 respectively. %Recovery was obtained as 99.52% and 100.04% for Meropenem and Vaborbactam respectively. LOD, LOQ values obtained from regression equations of Meropenem and Vaborbactam were 0.07, 0.21 µg/ml and 0.07, 0.21 µg/ml respectively. Regression equation of Meropenem is y = 8848.x + 698.1, and y = 8748.x + 998.1 of Vaborbactam. Retention times were decreased and that run time was decreased, so the method developed was simple and economical that can be adopted in regular Quality control test in Industries.
REFERANCES
1. B.k Sharma, Instrumental methods of chemical
analysis, Introduction to analytical chemistry, 23rd Edition Goel publication, Meerut, 2007.
2. Lindholm.J, Development and Validation of HPLC
Method for Analytical and Preparative purpose. Acta Universitatis Upsaliensis, 2004; 13-14.
3. Rashmin, An introduction to analytical Method
Development for Pharmaceutical formulations. Indoglobal Journal of Pharmaceutical Sciences, 2012; 2(2): 191-196.
4. Malvia R, Bansal V, Pal O.P and Sharma P.K. A
Review of High Performance Liquid
Chromatography. Journal of Global Pharma
technology, 2010
5. Douglas A Skoog, F. James Holler, Timothy A.
Niemen, Principles of Instrumental Analysis, 725-760.
6. Dr.S. Ravi Shankar, Text book of Pharmaceutical analysis, Fourth edition, 13.1-13.2.
7. David G.Watson. Pharmaceutical Analysis, A text
book for Pharmacy students and Pharmaceutical Chemists. Harcourt Publishers Limited; 2nd Ed., 221-232.
8. Remingtonn‟s The Sciences and Practise of
Pharmacy, 20th Edition, 2000.
9. Connors Ka. A Textbook of Pharmaceutical
Analysis, Wiley intersciences Inc; Delhi, 3rd Ed, 1994; 373-421.
10. Gurdeep R. Chatwal, Sham K Anand, Instrumental Methods of Chemical Analysis, 2007; 2.566-2.638. 11. David G. Watson Pharmaceutical Analysis, A text
book for pharmacy students and Pharmaceutical Chemists. Harcourt Publishers Limited; 2nd Ed., 267-311.
12. Nasal A, Siluk. D, and Kaliszan.R. Chromatographic
Retention Parameters in Medicinal Chemistry and Pharmacology, Pubmed, 2003; 10(5): 381-426.
13. Ashok Kumar, Lalith Kishore, navpreet Kaur,
Anroop Nair. Method Development and Validation
for Pharmaceutical Analysis. International
Pharmaceutica Sciencia, 2012; 2(3).
14. Kaushal.C, Srivatsava.B, A Process of Method
Development: A Chromatographic Approach. J Chem Pharm Res, 2010; 2(2): 519-545.
15. Vibha Gupta, Ajay Deep Kumar Jain, N.S.Gill,
Kapil, Development and Validation of HPLC
method. International Research Journal of
Pharmaeutical and Applied Sciences, 2012; 2(4).
16. Hokanson GC. A life cycle approach to the
validation of analytical methods during
Pharmaceutical Product Development. Part 1: The Initial Validation Process. Pharm Tech, 1994; 92-100.
17. Green JM. A Practicle guide to analytical method validation, Anal Chem, 1996; 305A-309A.
18. ICH, Validation of analytical procedures: Text and
Methodology. International Conference on
Harmonization, IFPMA, Geneva, 1996.
19. Nicolau, David P., et al., Pharmacokinetic and
pharmacodynamic properties of meropenem.
Clinical infectious diseases: an official publication of the Infectious Diseases Society of America, 2008; 47(1): S32-40. PMID: 18713048.
20. IUPAC. Compendium of Chemical Terminology,
2nd edn. (The Gold Book). PAC69, 1137 (1997). Glossary of terms used in computational drug design (IUPAC Recommendations.
21. K. D. Tripathi, Essentials of Medical
Pharmacology, 6th Edition, Jaypee brother‟s medical publishers (P) LTD, 254-255.
22. Indian Pharmacopoeia, Indian Pharmacopoeial
Commission, Controller of Publication, Government of India, Ministry of health and Family Welfare, Ghaziabad, India, 2010; 2: 1657-1658.
23. British Pharmacopoeia, The British
Pharmacopoeial Commission, the stationary office, UK, London, 2011; 1408-1409.
24. “http://www.drugbank.ca/drugs/DB00331.
25. Benoit Viollet, Bruno Guigas, Nieves Sanz Garcia, Jocelyne Leclerc, Marc Foretz, and Fabrizio Andreelli, cellular and molecular mechanisms of
Meropenem: An overview, Clincal Science
(London), 2012; 122(6): 253–270.
26. K. D. Tripathi, Essentials of Medical
Pharmacology, 6th Edition, Jaypee brother‟s medical publishers (P) LTD, 254-255.
27. Indian Pharmacopoeia, Indian Pharmacopoeial
Commission, Controller of Publication, Government of India, Ministry of health and Family Welfare, Ghaziabad, India, 2010; 2: 1657-1658.
28. British Pharmacopoeia, The British
Pharmacopoeial Commission, the stationary office, UK, London, 2011; 1408-1409.
29. “http://www.drugbank.ca/drugs/DB00760.
30. Cottagnoud, P., et al., 2002. Cellular and molecular aspects of drugs of the future: meropenem. Cellular and molecular life sciences: CMLS, 59(11): 1928-33. PMID: 12530523.
chemotherapy, 1989; 24 Suppl A: 101-12. PMID: 2808202.
32. “http://www.drugbank.ca/drugs/DB12107.
33. "International Nonproprietary Names for
Pharmaceutical Substances (INN). Recommended International Nonproprietary Names: List 75"(PDF). World Health Organization, 161–2.
34.
“https://www.drugs.com/sfx/Vaborbactam-side-effects.html”.
35.
“http://www.rxlist.com/jardiance-drug/overdosage-contraindications.html” Terashima, H; Hama, K "Effects of a new aldose reductase inhibitor on various tissue in vitro". J Pharamacol Exp Ther., 1984; 229: 226–230.
36. Sreelakshmi. Ma. RP- HPLC Method for
Simultaneous Estimation of Meropenem and Vaborbactam in Bulk Samples. International Journal of Medical Science and Innovative Research (IJMSIR) September- October, 2017; 361 – 367.
37. Mojgan Sabet. Activity of Simulated Human Dosage
Regimens of Meropenem and Vaborbactam against Carbapenem-resistant Enterobacteriaceae in an In Vitro Hollow Fiber Model. Copyright © 2017 American Society for Microbiology. Accepted manuscript posted online13 November, 2017. doi:10.1128/AAC.01969-17.
38. Ramona khanum1. development and validation of a
rp-hplc method for the detection of meropenem as a pure compound, in a pharmaceutical dosage form and post thermal induced degradation. International Journal of Pharmacy and Pharmaceutical Sciences. Received: 05 Jan 2014 Revised and Accepted, 24 Jan 2014.
39. Zalewski P, Development and validation of
stability-indicating HPLC method for simultaneous
determination of meropenem and potassium
clavulanate. Acta Pol Pharm, 2014 Mar-Apr; 71(2): 255-60.
40. Olga Lomovskaya#. Vaborbactam: Spectrum of
Beta-Lactamase Inhibition and Impact of Resistance
Mechanisms on Activity in
Enterobacteriaceae American Society for
Microbiology. Accepted manuscript posted
online28 August 2017, doi:10.1128/AAC.01443- L.Venkateswara Rao, Reverse Phase HPLC and
Visible Spectrophotometric Methods for the
Determination of Meropenem in Pure and
Pharmaceutical Dosage Form. International Journal of Pharm Tech Research, July-Sept 2012; 4(3): 957-962.
41. Ping CHANG 1. Determination of Meropenem in
Human Plasma by HPLC: Validation and its Application to Pharmacokinetic Study. Latin American Journal of Pharmacy. 870-4 (2014) Received: December 22, 2013 Revised version: March 22, 2014 Accepted: March 25, 2014.
42. GregoriCasalsa: Development and validation of a UHPLC diode array detector method for meropenem quantification in human plasma The Canadian
Society of Clinical Chemists. Published by Elsevier Inc., November 2014; 47(16–17): 223-227.
43. Guanyang LIN 1. Determination of Meropenem in
Rabbit Plasma by LC–MS/MS. Latin American Journal of Pharmacy ,1895-1900 (2011) Regular Article Received: August 8, 2011 Revised version: November 2, 2011 Accepted: November 3, 2011.
44. Przemys£Aw Zalewski. development and validation
of stability-indicating hplc method for simultaneous
determination of meropenem and potassium