Issues
ISSN: 2146-4138
available at http: www.econjournals.com
International Journal of Economics and Financial Issues, 2019, 9(2), 1-11.
Analysis of Capital Structure and Performance of Banking Sector
in Middle East Countries
Hani El-Chaarani
1*, Zouhour El-Abiad
21Beirut Arab University, Beirut, Lebanon, 2Lebanese University, Lebanon. *Email: [email protected]
Received: 11 December 2018 Accepted: 13 February 2019 DOI: https://doi.org/10.32479/ijefi.7454
ABSTRACT
The research aims to empirically study the capital structure and the performance of the banking sector in Middle East countries during a period of
6 years (between 2011 and 2016). By using 143 banks and 723 observations, the study shows that the capital structure of the banking sector was very volatile during the studied period due to the economic conditions of the region. The results also reveal the existence of positive and significant impacts of total debt and short-term debt on the return on equity of the banking sector in Middle East region. However, the results show negative and significant impacts of total debt and short-term debt on the return on assets (ROA). Additional analysis reveals a positive impact of long-term debt on the ROA ratio. Finally, this study refuses the endogeneity hypothesis of the capital structure and the performance measured by the profitability of the banking sector, and considers that the capital structure design is highly influenced by the decision taken by the international and national regulatory boards. Keywords: Capital Structure, Performance, Banks, Leverage, Long and Short-Term Debts
JEL Classifications: G2, G32
1. INTRODUCTION
According to trade-off theory, banks should have a maximum leverage level to balance between the costs and benefits of holding debts (Kraus and Litzenberger, 1973). As explained by many researchers, the optimal capital structure of organizations is determined by a trade-off of the tax savings merit of debt (tax shield) and financial distress costs (bankruptcy). This would lead banks to maintain a specific capital structure and particular leverage ratio to maximize profitability.
The financial crisis of 2008 has renewed attention to the importance of capital structure in banking sector. Many financial boards and experts have indicated that the capital structure of banks is an important factor that may lead to financial distress during a period of crisis. For example, the Basel Committee has recommended that banks should increase the minimum capital requirement through additional capital buffers to protect depositors and cover the risks that emerge during periods of crisis without
incurring losses. The newest reform of the Basel Committee also requires a minimum leverage ratio which take into account both the off- and the on-balance sheet items.
Such capital requirement can however limit the financial flexibility and lower the profitability of the banking sector. Banks often argue that a higher capital requirement will lower their performance by increasing the total cost of financing (Bandt et al., 2014). Relying on the capital structure and its impact on performance, different analyses are used in the literature and empirical studies.
The first view argues that a higher debt level has a positive impact on the performance of the banking sector. Raising the inter-bank debt level can improve the controlling of bank managers by debtholders and decrease the banks’ cost of financing. Another view argues that high level of capital and low level of debts could prevent banks from financial distress and bankruptcy especially during crises. The last financial crisis of 2008 revealed that the highly levered banks had higher risks than that of other
banks. For the world’s best central bank governor, according to Euromoney magazine in 2007, Riad Salameh1 avoided international investments in subprime loans and had high capital and liquidity levels which protected the Lebanese banks against the international crisis of 20082. Finally, a last view considers capital structure irrelevant for the performance of the banking sector. In this view, there is no optimal capital structure for the banking sector. The pecking order theory (Myers, 1977) is one of the theories supporting the premise that the capital structure is not considered as a determinant factor of the performance level, and suggests that every firm has a preferred hierarchy for financial decisions.
To contribute to this debate, in this study we analyze the impact of capital structure on the performance of the banking sector of the Middle East countries during the current economic recession, political tensions and actual lower level of oil prices since the last decade.
This research provides new evidence to the existing literature in different ways. First, this study will bring evidence to the unsolved question of the impact of capital structure on the performance of the banking sector in Middle East region during the current economic recession and political tensions. Empirical studies over the last years were not able to reveal a clear impact of capital structure and leverage ratio on the profitability level of the banking sector especially in the Middle East region.
Second, this research will compare the different capital structures of the banking sector in Middle East countries to determine the specificity of capital structure in each country by using a large sample of banks from 2011 until 2016. The majority of empirical studies have studied the impact of capital structure on the performance of banking sector in one country. However, a cross-country study in the Middle East region can contribute positively to empirical findings.
Third, this research will examine the problem of endogeneity of the relationship between banks’ profitability and capital structure. All the studies in the Middle East and North Africa regions have ignored the problem of endogeneity. However, it is possible to have a bidirectional relationship between a bank’s profitability and its capital structure.
This paper shows that the capital structure of the banking sector has a significant impact on the performance measured by the profitability ratios (return on assets [ROA] and return on equity [ROE]). The nature of capital structure impact depends on the profitability measure. The results show negative impacts of total debt and short-term debt ratios on the ROA, whereas positive impacts have been detected on these two ratios with the ROE. In the first case, increasing the debt will increase the interest servicing this debt and decrease indirectly the ROA. In the second case,
1 Riad Salameh is a Lebanese banker and current Governor of Lebanon’s
Central Bank (Banque du Liban, BDL). He has been in this position since
August 1, 1993.
2 BBC news, Friday, December 5, 2008. Source:http://news.bbc.co.uk/2/hi/ middle_east/7764657.stm
increasing the debt will lead to increase the ROE by raising the leverage factor and lowering the total cost of capital.
The results reveal that the capital structure of the banking sector in Middle East countries was volatile from 2011 to 2016 due to the economic conditions and politic conflicts. The results also show that since 2016, the banking sector in Middle East countries is more willing to use leverage to decrease the cost of debt and compensate the decreasing of profitability under the last financial distress and economic recession.
Finally, the results refuse the endogeneity potential of capital structure and lead us to consider that the capital structure design is influenced by the requirements fixed by the regulators of the banking sector and not by the performance level.
The rest of the paper is organized as follows: Section 2 presents the literature review of capital structure theories and empirical findings. Section 3 describes the sample and methodology used. Section 4 presents and discusses the empirical findings. Finally, section 5 concludes the research.
2. LITERATURE REVIEW
The debate of capital structure and a firm’s performance started in 1958 with Modigliani and Miller who introduced the irrelevance theory, which stated that the debt level has no impact on the cash flows of a firm. Thus, changing the levels of debt and equity has no effect on the firm value under perfectly competitive capital market conditions. 5 years later, Modigliani and Miller (1963) proposed that the optimal capital structure of a firm should composed of maximum debt level due to the positive impact of tax-advantage on debt. Miller (1995) suggested that the Modigliani and Miller theory can be extended to the banking sector even in the presence of market imperfections. He argues that nothing prevents the decreasing of the cost of capital when capital increases.
The Modigliani and Miller theory stimulated other researches to measure the impact of capital structure on profitability. In 1973, Kraus and Litzenberger introduced the classical trade-off theory of capital structure. In this theory, firms have to set a maximum leverage ratio, and managers have to trade off the drawbacks debt (bankruptcy cost) and benefits debt (tax saving). According to Kayo and Kimura (2011), the trade-off theory assumes an indirect positive relationship between leverage and performance because a low performance level may increase bankruptcy risk. Kraus and Litzenberger (1973) consider that there is an optimal capital structure in which the firm value will be maximized and the cost of capital will be minimized. This optimal structure is reached when bankruptcy cost is equal to tax benefits. Despite the importance of the appealing concepts of this theory, researchers have failed until now to find the optimal level of capital structure.
its investment from internally generated funds rather than external sources. The investments should be financed by the retained earnings; when all the internal funds are employed, firms can issue new debt; and finally, when a firm reaches its maximum debt capacity, it can issue new equity. Fama and French (2000) indicate that the reason behind following this financing hierarchy stems from the signaling hypothesis. They consider that the issuing of new shares by the manager of a firm can send a negative signal to investors who might then consider that the firm’s shares prices are over-evaluated. The issuing of new debt is less likely to send a negative signal. The pecking order theory predicts a positive relationship between profitability and equity capital since firms prefer to use internal financing rather than debt.
The agency theory (Jensen and Meckling, 1976) posits that debt financing can be used to increase the performance of a firm by resolving the conflict of interests between the manager and shareholders. For Jensen and Meckling (1976) the manger can use free cash flows (FCF) for his own interests instead of following the interests of shareholders. Therefore, the existence of debt holders through the increasing of leverage level can be used to enhance firm performance, reduce FCF, monitor the manager and lower the agency costs (Jensen, 1986). However, in the case of the banking sector, the majority of debt is held by small depositors who have no tools to monitor bank managers, thereby limiting the disciplinary role of debt suggested by agency theory especially in countries characterized by low level of legal protection(El-Chaarani, 2015; 2017).
The market timing theory (Baker and Wurgler, 2002) suggests that the financing decisions of any firm depends on market conditions. In this theory, Baker and Wurgler (2002) state that the circumstances of investors’ sentiments and financial distress can create for mangers an opportunity and lead them to modify the leverage ratio and equity level. Based on this theory, firms will prefer to issue equity to avoid bankruptcy risk during financial distress. Alternatively, mangers will prefer to use debt when stock prices are over-evaluated to prevent any opposite signal of equity issues. Accordingly, the variation of market value of a firm is the result of managers’ perception of over evaluation.
Holmstrom and Tirole (1997) developed a model to test the costs and benefits of a high level of capital in the banking sector. In their dynamic model, they found that holding high levels of capital is costly but such a cost varies from one bank to another. In addition, they argue that a higher level of capital implies higher margins for the bank due to the extraction of interests from borrowers and a long-term vision by a bank’s owners. The model developed by Allen et al. (2011) confirms the positive impact of a higher capital ratio on the profit of the banking sector. The authors state that increasing the capital level induces a higher monitoring level and is an optimal financial decision. In the same line, Admati et al. (2011) note that highly leveraged banks are inclined to make worse lending decision than they would have made if they had been better capitalized.
Based on the above theories, many empirical studies have been conducted to analyze the impact of capital structure on the performance of firms and the banking sector.
Bandt et al. (2014) studied the impact of capital structure on the profitability of large French banks over the period of 1993-2012. They found that increasing capital equity leads to a significant increase in ROE, which comes in opposition with theories indicating the positive effect of debt in monitoring bank mangers. The authors found that the positive effect of capital increases when they took into consideration 2-year lags, which indicates that the modification of capital structure needs time to affect the profitability of banks.
The study of Mehran and Thakor (2011) confirmed the positive impact of high capital ratio in the US banks over the 1989-2007 period. The authors found that banks with a high capital level attract more loans and deposits. Berger and Bouwman (2013) tested the implication of international crises between 1984 and 2010 on the banking sector in United States. They found that well capitalized banks gained market shares and they had higher a high rate of survival banks during financial crises.
Saeed el al. (2013) studied the impact of capital and debt on the ROA and ROE of Pakistani banks over the period of 2007-2011. The authors revealed significant negative relationships between long-term debt to capital ratio with earnings per share (EPS), ROE and ROA.
El-Masry (2016) studied the mutual impact of credit rating and capital structure on the profitability of 169 banks in the MENA (Middle East and North Africa) region during 2014. They found that a bank’s ROA was positively associated with credit rating and negatively associated with debt ratio. The results of Nikoo (2015), confirmed the positive impact of capital level on the ROE, ROA and EPS ratios of listed banks in Tehran over the period of 2009-2014.
The results of Siddik et al. (2017) confirmed the impact of capital structure on the performance of 30 listed banks in Bangladesh over the period of 2005-2014. However, the authors found that the capital structure was inversely related to the bank’s ROE, ROA and EPS. They suggest that managers in the banking sector should rely on retained earnings rather than on debt capital. For the authors, the undeveloped bond and equity markets is the reason behind these results in developing countries such as Bangladesh.
Alternatively, many other researchers believe that the capital structure cannot be a determinant of a bank’s performance. They consider that performance is one of the most important factors affecting the capital structure of a bank. Along the same line of reasoning, the modification of capital requirement by the regulatory authorities (BASEL III) after the financial crisis of 2008 can be considered as the result of bad performance and financial distress.
Gropp and Heider (2010) studied the determinant factors of European and US banks’ capital structure from 1991 to 2004. They found that a bank’s profitability has a significant negative impact on the leverage level.
Finally, the last view of capital structure impact states that there is no relationship between capital structure and a bank’s performance because banks are not willing to increase their capital level, even when, at the same time, they are obliged to adopt the dictated structure by regulatory boards to insure stability and depositors’ protection. Therefore, the capital level of banks will stay stable at the minimum level required by financial authorities. Accordingly, Mishkin (2000) argues that the capital of banks often does not exceed the requirement fixed by regulatory to avoid a high cost level.
3. SAMPLE, METHODOLOGY AND
VARIABLES DEFINITION
This study examines the relationship between profitability and capital structure of the banking sector in the Middle East region, mainly in the following eight countries: Lebanon, Qatar, Kuwait, Jordan, Oman, Iran, Kingdom of Saudi Arabia (KSA), and United Arab Emirates (UAE). The sample of the study consists of 149 banks for a period of 6 years from 2011 to 2016. The number of observations is 723 (bank/year) collected from annul reports, Bankscope and central bank database of the eight countries included in this study. Banks with non-completed financial data were excluded from this study. To avoid any bias, the other Middle East countries such as Syria, Iraq, Bahrain, Yemen and Palestine were excluded from the sample due to their political conflicts and their impacts on the banking sector.
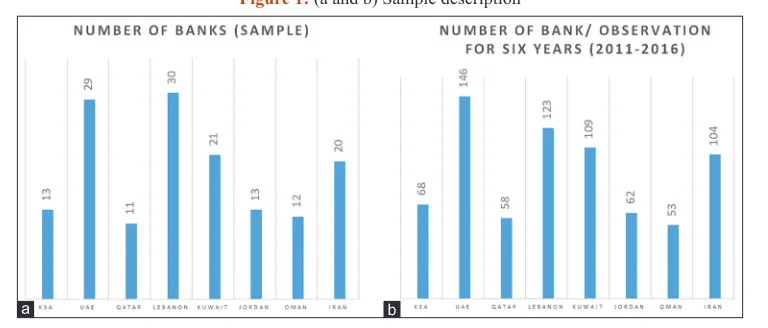
Table 1 and Figure 1 present the sample of the study and the distribution of observations per country. The data of Table 1 and
Figure 1 indicates that the sample of the study consists of 13 banks and 68 observations from KSA, 29 banks and 146 observations from UAE, 11 banks and 58 observations from Qatar, 30 banks and 123 observations from Lebanon, 21 banks and 109 observations from Kuwait, 13 banks and 62 observations from Jordan, 12 banks and 53 from Oman and 20 banks and 104 observations from Iran.
Table 2 and Figure 2 present the number of observations per year. From the studied countries in the Middle East region 143 banks/ year observations have been extracted from 2011, 144 observations from 2012, 125 observations from 2013, 112 observations from 2014, 109 observations from 2015 and 90 observations from 2016.
In the first step of the study, the descriptive statistics were employed to measure the profitability level and the capital structure of the banking sector in Middle East countries. In addition, the aim of this step was to compare the specificity and the characteristics of the banking sector in each of the eight countries considered in this study.
In the second step of the study, the classical linear regression was used to measure the direct impact of capital structure composition on the performance measured by the profitability of the banking sector. Heteroscedasticity and serial correlation of the error term were controlled.
In the final step of the study, the test of endogeneity between profitability and capital structure was employed since a bank can modify its capital structure based on the profitability level and not vice-versa. The dual-causality relationship has to be considered to avoid any bias and error.
As for the variables of this study’s regression, Table 3 presents the different variables used in this study. The dependent variable is measured through two main proxies: ROA and ROE measure
Table 1: Sample description
Country KSA UAE Qatar Lebanon Kuwait Jordan Oman Iran Total
Number of banks (Sample) 13 29 11 30 21 13 12 20 149
% of sample/country 8.72 19.47 7.39 20.13 14.10 8.72 8.05 13.42 100.00
Number of bank/observation for 6 years (2011-2016) 68 146 58 123 109 62 53 104 723
% of observation/country 9.41 20.19 8.02 17.01 15.08 8.58 7.33 14.38 100.00
Figure 1:(a and b) Sample description
the return on assets and the ROE, respectively. The independent variables are measured by three proxies; the total debt to total assets (TDTA), the short-term debt to total assets (SDTA) and the long term debt to total assets (LDTA). To isolate the effect of capital structure on the profitability of the banking sector, three control variables are considered in this study: Liquidity (LIQ), size (SIZ) and growth (GR). Liquidity is measured by the proportion of total loans to total assets; size is measured by the natural logarithm of total assets; and growth is measured by the proportion of assets growth between year (n) and year (n-1) over the assets of year (n-1).
4. DESCRIPTIVE STATISTICS
Table 4 and Figures 3-5 present the descriptive statistics of the study’s observations from 2011 to 2016 in Middle East
countries. The results indicate that the performance of the banking sector in Saudi Arabia is the highest in the region with 23.76 for ROE and 4.62 for ROA. Banks in Kuwait come in the last rank with 3.2 for ROE and 0.81 for ROA. The other performance results presented in Figure 3 are mixed, so it is not possible to fix a ranking in terms of performance. For example, Iranian banks come in second position in terms of ROE with 14.25, whereas banks in UAE come in second position in terms of ROA with 1.99.
The results of Figure 4 reveal that the banking sector in Middle East countries use short-term debt (SDTA) as the main source of funding. This result is normal because short-term deposits are considered the largest source of funds for the banking sector. Banking sectors in Iran and Lebanon have the highest total debt ratio (TDTA) with 0.9 and 0.86, respectively. Kuwaiti banks are in last position with 0.63 for total-debt ratio. Banks in Jordan, UAE, KSA, Qatar and Oman come in third, fourth, fifth, sixth and seventh places respectively. The results indicate that the banking sector in the eight countries of the Middle East respect the capital threshold defined by Basel III.
Figure 2: Number of observations per year Table 2: Number of observations per year
Year 2011 2012 2013 2014 2015 2016
Number of observations per year 143 144 125 112 109 90
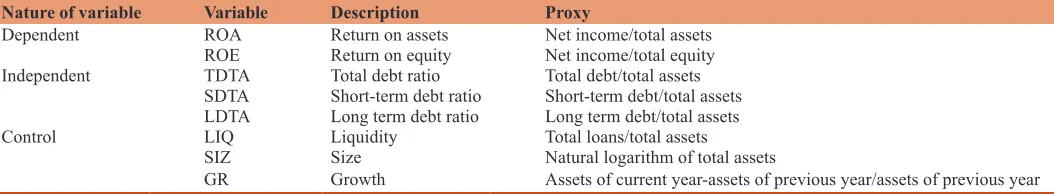
Table 3: Description of variables
Nature of variable Variable Description Proxy
Dependent ROA Return on assets Net income/total assets ROE Return on equity Net income/total equity Independent TDTA Total debt ratio Total debt/total assets
SDTA Short-term debt ratio Short-term debt/total assets LDTA Long term debt ratio Long term debt/total assets Control LIQ Liquidity Total loans/total assets
SIZ Size Natural logarithm of total assets
GR Growth Assets of current year-assets of previous year/assets of previous year
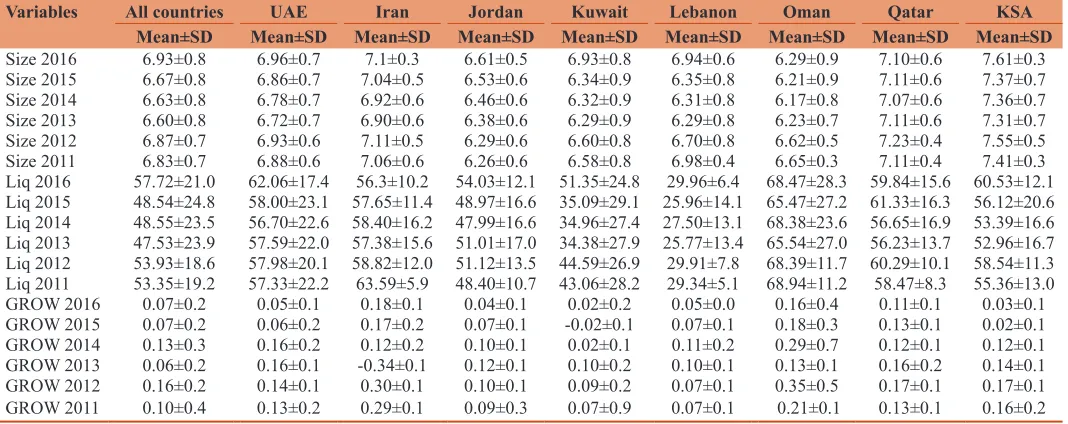
Despite its second position as the highest debt-holder in the region, the Lebanese banking sector has the highest liquidity3 and growth ratios (Table 4 and Figure 5). Omani banks have the lowest liquidity level and Kuwaiti banks have the lowest growth level. In term of size, Saudi banks are the largest whereas Omani banks are the smallest in the region.
The results of Table 5 and Figure 6 indicate that KSA consistently had the highest level of performance (ROA and ROE) compared to other countries in the Middle East region from 2011 till 2016. After 2013, it can be noticed that the performance of the banking sector in KSA and UAE decreased dramatically due to the economic recession in the region and the sharp drop of oil prices.
3 Higher L1 ratio indicates less liquidity, thus the ratio value must be interpreted inversely.
The volatility of performance levels was very high for Iran, Kuwait and Oman. The banking sector in Kuwait had the lowest level of ROE in the region from 2011 till 2016 and the lowest level of ROA in 2011, 2015 and 2016. The ROA of Omani banks declined to attain −3.41 in 2012. The same negative situation had been detected in Iran between 2011 and 2013 due to the international economic sanction on the Iranian nuclear program. The performance level for the other countries, such as Lebanon, Jordan and Qatar, declined slowly from 2011 to 2016, which reflects the economic recession and its negative impact on the whole region.
The results in Table 6 reveal that the required capital by the banking sector regulators is well applied and respected in the Middle East region and, many countries such Kuwait, Oman and Qatar have higher levels of capital than are required by Basel III.
Figure 4: Capital structure of the banking sector in the Middle East
Figure 5: Liquidity, size and growth of the banking sector in the Middle East
Table 4: Descriptive statistics for the study’s observations
Variables UAE Iran Jordan Kuwait Lebanon Oman Qatar KSA
Mean±SD Mean±SD Mean±SD Mean±SD Mean±SD Mean±SD Mean±SD Mean±SD
ROA 1.99±2.7 1.41±1.5 1.41±1.2 0.81±4.1 1.00±1.0 0.98±1.3 1.73±1.1 4.62±6.5
ROE 10.42±8.6 14.25±14.4 8.31±6.1 3.20±10.3 8.72±6.1 7.97±9.2 10.66±6.4 23.76±35.8
TDTA 0.80±0.3 0.90±0.1 0.83±0.1 0.63±0.3 0.86±0.1 0.72±0.2 0.76±0.2 0.77±0.2
SDTA 0.70±0.3 0.80±0.2 0.79±0.2 0.59±0.3 0.82±0.2 0.61±0.3 0.68±0.2 0.73±0.2
LDTA 0.10±0.1 0.09±0.1 0.04±0.0 0.12±0.2 0.04±0.1 0.13±0.1 0.08±0.1 0.07±0.1
SIZE 6.84±2.8 6.99±0.5 6.41±0.6 6.43±0.9 6.42±0.8 6.30±0.8 7.11±0.5 7.42±0.6
LIQ 58.17±30.1 58.72±13.4 49.75±14.8 38.85±27.7 27.06±12.4 67.27±23.8 58.81±13.9 55.84±15.6
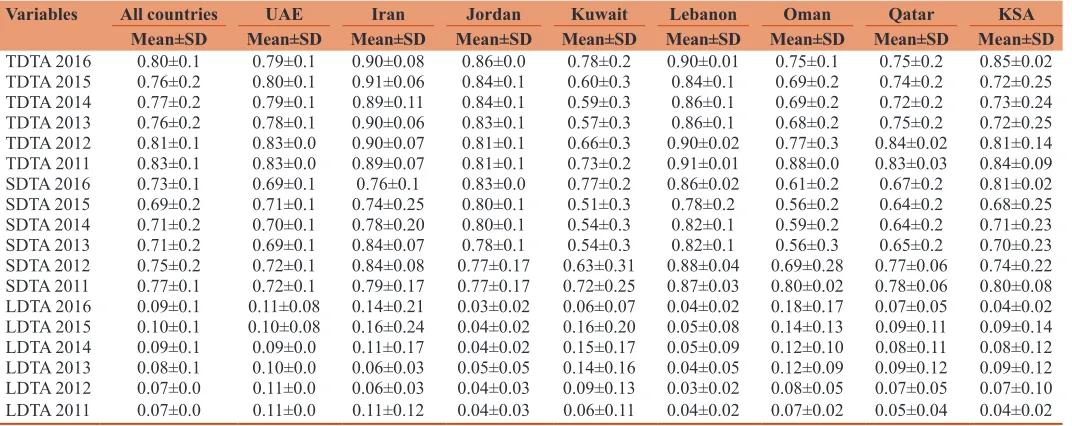
Moreover, it seems that the modification of the total-debt ratio (TDTA) in the banking sector in Middle East countries is mainly due to the modification of short-term debt ratio (SDTA). In other words, short-term deposits are the main source of funds for the banking sector in the region. They present between 70% and 90% of banks’ funds whereas the long-term debt presents between 10% and 20% of banks’ funds.
The total debt level was the lowest and the equity level was the highest for Kuwaiti banks between 2011 and 2015. The Iranian banks have the highest level of debt and the lowest level of equity in the region during the 6 years of the study.
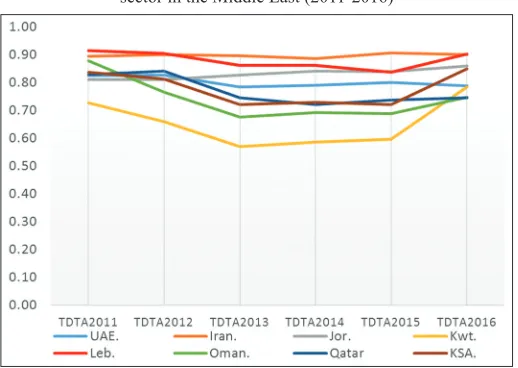
Figure 7 shows that the capital structure was very volatile in the Middle East region. The banking sector had the tendency Figure 6: (a and b) Development of return on assets and return on equity of the banking sector in the Middle East (2011-2016)
Table 5: Descriptive statistics of the dependent variables per country per year
Variables All countries UAE Iran Jordan Kuwait Lebanon Oman Qatar KSA
Mean±SD Mean±SD Mean±SD Mean±SD Mean±SD Mean±SD Mean±SD Mean±SD Mean±SD
(ROA) 2016 1.22±3.1 1.54±3.1 1.02±1.07 1.20±0.42 −0.33±5.1 0.93±0.3 1.16±1.6 0.82±1.8 2.85±3.9
(ROA) 2015 1.30±3.7 1.52±3.2 1.01±1.09 1.34±1.21 −1.00±5.1 1.06±1.1 1.46±2.2 1.70±0.9 5.05±6.9
(ROA) 2014 2.17±3.5 2.89±4.1 0.97±1.48 1.47±1.15 2.44±3.3 1.06±1.0 1.67±2.5 1.93±0.8 5.47±7.5
(ROA) 2013 1.95±3.2 2.17±2.0 1.58±1.67 1.37±1.36 1.92±3.8 0.91±1.0 1.38±3.4 1.65±0.8 5.42±7.1
(ROA) 2012 1.56±4.7 1.93±1.2 1.70±1.44 1.47±0.97 0.89±1.8 0.93±0.3 −3.41±14.3 2.25±0.4 4.54±7.0
(ROA) 2011 1.61±2.4 1.63±1.3 2.12±1.48 1.50±1.07 −0.13±2.5 0.97±0.3 1.46±0.4 2.36±0.3 3.36±5.1
(ROE) 2016 9.08±13.6 8.13±8.8 10.1±9.25 8.65±2.78 4.70±10.1 9.87±3.9 6.61±6.4 7.44±8.8 20.37±30.5
(ROE) 2015 8.49±14.0 8.99±10. 10.22±9.73 8.15±5.65 −0.47±14.0 8.00±4.7 7.81±7.2 10.06±6.1 22.95±31.6
(ROE) 2014 10.64±14.6 13.2±9.8 8.47±15.0 8.32±8.07 6.00±5.4 9.17±6.3 8.60±6.7 10.34±5.9 24.51±38.4
(ROE) 2013 10.27±13.5 10.8±6.0 15.69±16.5 8.05±7.80 4.83±8.2 7.76±7.9 7.56±11.2 10.09±6.3 22.25±30.4 (ROE) 2012 12.48±15.3 11.2±5.1 18.48±12.8 8.87±4.10 3.84±5.3 10.33±4.3 6.87±19.1 13.88±3.7 27.77±46.5 (ROE) 2011 11.78±14.8 9.41±7.8 22.78±10.2 8.09±4.65 −0.34±14.7 11.28±3.8 11.87±2.9 14.25±3.3 25.06±42.7
Table 6: Descriptive statistics of the independent variables per year
Variables All countries UAE Iran Jordan Kuwait Lebanon Oman Qatar KSA
Mean±SD Mean±SD Mean±SD Mean±SD Mean±SD Mean±SD Mean±SD Mean±SD Mean±SD
TDTA 2016 0.80±0.1 0.79±0.1 0.90±0.08 0.86±0.0 0.78±0.2 0.90±0.01 0.75±0.1 0.75±0.2 0.85±0.02
TDTA 2015 0.76±0.2 0.80±0.1 0.91±0.06 0.84±0.1 0.60±0.3 0.84±0.1 0.69±0.2 0.74±0.2 0.72±0.25
TDTA 2014 0.77±0.2 0.79±0.1 0.89±0.11 0.84±0.1 0.59±0.3 0.86±0.1 0.69±0.2 0.72±0.2 0.73±0.24
TDTA 2013 0.76±0.2 0.78±0.1 0.90±0.06 0.83±0.1 0.57±0.3 0.86±0.1 0.68±0.2 0.75±0.2 0.72±0.25
TDTA 2012 0.81±0.1 0.83±0.0 0.90±0.07 0.81±0.1 0.66±0.3 0.90±0.02 0.77±0.3 0.84±0.02 0.81±0.14
TDTA 2011 0.83±0.1 0.83±0.0 0.89±0.07 0.81±0.1 0.73±0.2 0.91±0.01 0.88±0.0 0.83±0.03 0.84±0.09
SDTA 2016 0.73±0.1 0.69±0.1 0.76±0.1 0.83±0.0 0.77±0.2 0.86±0.02 0.61±0.2 0.67±0.2 0.81±0.02
SDTA 2015 0.69±0.2 0.71±0.1 0.74±0.25 0.80±0.1 0.51±0.3 0.78±0.2 0.56±0.2 0.64±0.2 0.68±0.25
SDTA 2014 0.71±0.2 0.70±0.1 0.78±0.20 0.80±0.1 0.54±0.3 0.82±0.1 0.59±0.2 0.64±0.2 0.71±0.23
SDTA 2013 0.71±0.2 0.69±0.1 0.84±0.07 0.78±0.1 0.54±0.3 0.82±0.1 0.56±0.3 0.65±0.2 0.70±0.23
SDTA 2012 0.75±0.2 0.72±0.1 0.84±0.08 0.77±0.17 0.63±0.31 0.88±0.04 0.69±0.28 0.77±0.06 0.74±0.22
SDTA 2011 0.77±0.1 0.72±0.1 0.79±0.17 0.77±0.17 0.72±0.25 0.87±0.03 0.80±0.02 0.78±0.06 0.80±0.08
LDTA 2016 0.09±0.1 0.11±0.08 0.14±0.21 0.03±0.02 0.06±0.07 0.04±0.02 0.18±0.17 0.07±0.05 0.04±0.02
LDTA 2015 0.10±0.1 0.10±0.08 0.16±0.24 0.04±0.02 0.16±0.20 0.05±0.08 0.14±0.13 0.09±0.11 0.09±0.14
LDTA 2014 0.09±0.1 0.09±0.0 0.11±0.17 0.04±0.02 0.15±0.17 0.05±0.09 0.12±0.10 0.08±0.11 0.08±0.12
LDTA 2013 0.08±0.1 0.10±0.0 0.06±0.03 0.05±0.05 0.14±0.16 0.04±0.05 0.12±0.09 0.09±0.12 0.09±0.12
LDTA 2012 0.07±0.0 0.11±0.0 0.06±0.03 0.04±0.03 0.09±0.13 0.03±0.02 0.08±0.05 0.07±0.05 0.07±0.10
LDTA 2011 0.07±0.0 0.11±0.0 0.11±0.12 0.04±0.03 0.06±0.11 0.04±0.02 0.07±0.02 0.05±0.04 0.04±0.02
to increase the equity threshold level in 2012 due to the new requirements of regulatory boards after the financial crisis of 2008-2009. However, the tendency to use less equity and more debt has appeared since 2016. It seems that the economic recession and the low price of oil during the last years have had a direct impact on the capital structure design of the banking sector as it searched to decrease the total cost of capital. Between 2013 and 2015, the capital structure was almost stable.
From Table 7 and Figure 8, many conclusions can be elaborated. First, the size of the banking sector in the Middle East countries has been mostly stable. Saudi Arabia banks are larger whereas Omani, Jordanian and Lebanese banks are smaller. Second, Lebanese banks have the highest liquidity level and Omani banks have the lowest liquidity level. Third, the growth level was highly volatile between 2011 and 2016 mainly for Iranian, Omani and Kuwaiti
banks. The worst situation was for Iranian banks between 2012 and 2013.
5. EMPIRICAL FINDINGS
Tables 8 and 9 show the impact of capital structure on the profitability level of the banking sector in the Middle East region from 2011 to 2016. Three independent variables are used: Total debt to total assets (TDTA), short-term debt to total assets (SDTA) and long-term debt to total assets (LDTA). Three control variables are considered to isolate the effect of capital structure: Growth rate (GR), liquidity level (LIQ) and size of bank (SIZ).Two dependent variables have been used: ROA in the first model (Table 8) and ROE in the second model (Table 9).
Table 8 shows negative impacts of total debt and short-term debt ratios on the ROA in the banking sector. Increasing the total debt level has a negative impact on ROA (−0.134) and increasing the short-term debt has a negative impact on ROA (−0.175).These results appear normal because short-term debt presents 70% to 90% of bank’s total debt. However, a positive impact of long-term debt ratio on the ROA (+0.146) has been detected.
The results reveal that increasing short-term debts has the potential to lower revenue due to the payment of interests servicing those debts. The long-term debts are used to increase the investment of banks which leads significantly and indirectly to raise the ROA. The costs of long-term debts appear lower than that of short-term debts and their long-term conditions seems suitable for banks to increase long-term investments.
Moreover, the results reveal a positive impact of size on the ROA in the banking sector (+0.122). Lager banks have high potential to control their costs and are more capable of exploiting economies of Figure 7: Development of total debt ratio (TDTA) of the banking
sector in the Middle East (2011-2016)
Figure 8: (a-c) Development growth, liquidity and size of the banking sector in the Middle East (2011-2016)
c
scale. Finally, the results of Model 1 do not show any significant impacts of liquidity and growth rate on the profitability of the banking sector.
Table 9 shows the regression outputs of Model 2. The results reveal a positive impact of TDTA and SDTA ratios on the ROE. Increasing the total debt and short-term debt raises the ROE (+0.102) and (+0.118), respectively.
These results are not consistent with the results of Model 1 in which negative impacts of TDTA and SDTA ratios have been observed on the ROA. Increasing the debt level leads to raising the leverage factor in banks and consequently increases the ROE.
As for the size of banks, it appears that size keeps the same positive impact on the performance of the banking sector measured by the profitability ratios. The results show a positive impact of size on the ROE (+0.148).
The results do not reveal any significant impact of LDTA, LIQ and GR on the profitability level of the banking sector.
By studying the impact of capital structure on the profitability of the banking sector, the endogeneity problem can arise and lead to inconsistent conclusions. Capital structure of banks may vary with the level of performance. To examine the possible reverse
Table 8: Regression results - Model 1 with ROA as a dependent variable
Model Unstandardized coefficients Standardized coefficients t Sig.
B Standard error Beta
1 (Constant) 0.207 1.020 0.203 0.839
TDTA −2.348 0.805 −0.134 −2.917 0.004***
SDTA −2.698 0.974 −0.175 −3.075 0.002***
LDTA 4.165 1.113 0.146 3.743 0.000***
SIZ 0.471 0.174 0.122 2.710 0.002***
LIQ −0.002 0.005 −0.018 −0.468 0.640
GR 0.511 0.423 0.046 1.206 0.228
R-Square: 0.045, Adjusted R-square: 0.038, F statistics: 6.098, Dependent Variable: ROA, Levels of significance: (***) 1% and (**) 5%
Table 9: Regression results - Model 2 with ROE as dependent variable
Model Unstandardized
coefficients Standardized coefficients t Sig.
B SE Beta
2 (Constant) −16.873 5.892 −2.864 0.004
TDTA 10.355 4.648 0.102 2.228 0.026**
SDTA 11.532 4.861 0.118 3.162 0.032**
LDTA 4.526 6.425 0.027 0.704 0.481
SIZ 3.295 1.005 0.148 3.280 0.001***
LIQ −0.054 0.030 −0.071 −1.816 0.170
GR 0.657 2.445 0.010 0.269 0.788
R-Square: 0.043, Adjusted R-square: 0.036, F statistics: 6.008, Dependent Variable: ROE, Levels of significance: (***) 1% and (**) 5%
Table 10: Regression results - model 3 with total debt ratio as a dependent variable
Model Unstandardized
coefficients Standardized coefficients t Sig.
B SE Beta
3 (Constant) 0.126 2.046 2.709 0.127
ROA −0.032 4.003 −0.557 −10.606 0.316
ROE 0.005 6.001 0.535 10.034 0.423
SIZ 0.093 3.007 0.423 13.118 0.339
LIQ 0.001 3.000 0.119 3.864 0.326
GR 0.048 2.019 0.075 2.510 0.431
R-Square: 0.398, Adjusted R-square: 0.393, F statistics: 60.008, Dependent variable: Total debt ratio (TDTA), Levels of significance: (***) 1% and (**) 5%
Table 7: Descriptive statistics of the control variables per country per year
Variables All countries UAE Iran Jordan Kuwait Lebanon Oman Qatar KSA
Mean±SD Mean±SD Mean±SD Mean±SD Mean±SD Mean±SD Mean±SD Mean±SD Mean±SD
Size 2016 6.93±0.8 6.96±0.7 7.1±0.3 6.61±0.5 6.93±0.8 6.94±0.6 6.29±0.9 7.10±0.6 7.61±0.3
Size 2015 6.67±0.8 6.86±0.7 7.04±0.5 6.53±0.6 6.34±0.9 6.35±0.8 6.21±0.9 7.11±0.6 7.37±0.7
Size 2014 6.63±0.8 6.78±0.7 6.92±0.6 6.46±0.6 6.32±0.9 6.31±0.8 6.17±0.8 7.07±0.6 7.36±0.7
Size 2013 6.60±0.8 6.72±0.7 6.90±0.6 6.38±0.6 6.29±0.9 6.29±0.8 6.23±0.7 7.11±0.6 7.31±0.7
Size 2012 6.87±0.7 6.93±0.6 7.11±0.5 6.29±0.6 6.60±0.8 6.70±0.8 6.62±0.5 7.23±0.4 7.55±0.5
Size 2011 6.83±0.7 6.88±0.6 7.06±0.6 6.26±0.6 6.58±0.8 6.98±0.4 6.65±0.3 7.11±0.4 7.41±0.3
Liq 2016 57.72±21.0 62.06±17.4 56.3±10.2 54.03±12.1 51.35±24.8 29.96±6.4 68.47±28.3 59.84±15.6 60.53±12.1 Liq 2015 48.54±24.8 58.00±23.1 57.65±11.4 48.97±16.6 35.09±29.1 25.96±14.1 65.47±27.2 61.33±16.3 56.12±20.6 Liq 2014 48.55±23.5 56.70±22.6 58.40±16.2 47.99±16.6 34.96±27.4 27.50±13.1 68.38±23.6 56.65±16.9 53.39±16.6 Liq 2013 47.53±23.9 57.59±22.0 57.38±15.6 51.01±17.0 34.38±27.9 25.77±13.4 65.54±27.0 56.23±13.7 52.96±16.7 Liq 2012 53.93±18.6 57.98±20.1 58.82±12.0 51.12±13.5 44.59±26.9 29.91±7.8 68.39±11.7 60.29±10.1 58.54±11.3 Liq 2011 53.35±19.2 57.33±22.2 63.59±5.9 48.40±10.7 43.06±28.2 29.34±5.1 68.94±11.2 58.47±8.3 55.36±13.0
GROW 2016 0.07±0.2 0.05±0.1 0.18±0.1 0.04±0.1 0.02±0.2 0.05±0.0 0.16±0.4 0.11±0.1 0.03±0.1
GROW 2015 0.07±0.2 0.06±0.2 0.17±0.2 0.07±0.1 -0.02±0.1 0.07±0.1 0.18±0.3 0.13±0.1 0.02±0.1
GROW 2014 0.13±0.3 0.16±0.2 0.12±0.2 0.10±0.1 0.02±0.1 0.11±0.2 0.29±0.7 0.12±0.1 0.12±0.1
GROW 2013 0.06±0.2 0.16±0.1 -0.34±0.1 0.12±0.1 0.10±0.2 0.10±0.1 0.13±0.1 0.16±0.2 0.14±0.1
GROW 2012 0.16±0.2 0.14±0.1 0.30±0.1 0.10±0.1 0.09±0.2 0.07±0.1 0.35±0.5 0.17±0.1 0.17±0.1
causality, the total debt ratio (TDTA) has been regressed as a dependent variable whereas the profitability ratios (ROA and ROE) have been considered as independent variables. As in Models 1 and 2, the control variables have been considered in Model 3 to isolate the potential effect of performance on the capital structure.
Table 10 shows the impact of profitability and control variables on the capital structure of the banking sector. The results reveal the absence of any impact of profitability, bank’s size, growth rate and liquidity level on capital structure and debt level of the banking sector in Middle East countries. It seems that the decision concerning capital structure is dependent on the requirements defined by the internal regulatory authorities and is not dependent on bank’s return, growth, liquidity and size. Therefore, the hypothesis of endogeneity is rejected in this study.
6. CONCLUSION
This research proposes to focus on the capital structure and financial performance of the banking sector in Middle East countries for the period 2011-2016. Based on 143 banks and 723 observations extracted from eight countries (Lebanon, Qatar, Kuwait, Jordan, Oman, Iran, the Kingdom of Saudi Arabia and the United Arab Emirates), the results reveal that the capital structure affects the performance of the banking sector measured by the profitability ratios and not vice-versa. The results do not show any impact of a bank’s profitability on its capital structure. We assume that the capital structure of banks is mainly affected by the requirements of national and international regulators and not by the level of profitability. However, banks have a margin of flexibility based on their size and their capacity to attract more depositors.
Different signs have been observed concerning the impact of capital structure on the profitability level of the banking sector in the Middle East region. First, the results indicate negative impacts of total and short-term debts on the ROA. Second, the results reveal positive impacts of total and short-term debts on the ROE. Third, a positive impact has been observed for long-term debts on the ROA.
Short-term debts, forming 70-90% of total debts, are used by the banking sector to increase the leverage factor and raise the return for bank’s owners. Long-term debts are used by banks to finance long-term investments and in consequence, lead to increase the total ROA. These findings are consistent with trade-off theory that suggests that banks should increase their debt level by keeping a balance between the costs and the benefits of holding those debts.
This multi-country comparison between Middle East countries indicates that the capital structure of banks is divergent and not consistent during the studied period. Some countries, such as Iran and Lebanon, have a high level of debt ratio whereas others, such as Kuwait and Oman, have a very low level of debt ratio. Moreover, it seems that the last economic recession and the low level of oil prices in Middle East region have had a direct implication on capital structure in the banking sector. Since the end of 2015, a strong tendency has been noticed concerning an increase in the debt levels within the banking sector after having
3 years of capital structure stability (between 2013 and 2015). Lowering the total cost of capital may be the motive behind this financial behavior.
Finally, the study finds a significant impact of a bank’s size on its profitability, measured by both ROA and ROE. The large banks in Middle East countries have more capacity to manage their costs, attract new customers and realize economies of scale.
Despite the contribution of this study, many limitations must be identified. The sample is not totally homogeneous. The banks in the study’s sample have different sizes and they are from different countries with different jurisdiction systems that may affect capital structure decisions. Likewise, the sample is composed of commercial and Islamic banks, which makes the analysis more complicated because each type of bank has its specific strategy, vision and financial behavior. Thus, future research with additional analysis and comparisons between countries, types and size of banks should be considered.
REFERENCES
Admati, A.R., DeMarzo, P.M., Hellwig, M.F., Pfeiderer, P.C. (2011),
Fallacies, Irrelevant Facts, and Myths in the Discussion of Capital Regulation: Why Bank Equity is Not Expensive. Stanford, CA, and Bonn, Germany: Working Paper Stanford University and Max Planck Institute.
Allen, F., Carletti, E., Marquez, R. (2011), Credit market competition and capital regulation. Review of Financial Studies, 24(4), 983-1018. Baker, M., Wurgler, J. (2002), Market timing and capital structure. Journal
of Finance, 57(1), 1-32.
Basel, III. (2010), Full Press Release: Group of Governors and Heads of
Supervision Announces Higher Global Minimum Capital Standards. Basel Committee. Bank for International Settlements.
Berger, A.N., Bouwman, C.H. (2013), How does capital affect bank performance during financial crises? Journal of Financial Economics, 109(1), 146-176.
De Bandt, O., Camara, B., Pessarossi, P., Rose, M. (2014), Does the capital structure affect banks’ profitability? Pre and post financial crisis evidence from significant banks in France, Banque de France.
Débats Économiques et Financiers, 12, 1-49.
El-Chaarani, H. (2015), The impact of financial and legal structures on the performance of European listed firms. International Journal of Business and Finance Research, 9(2), 39-52.
El-Chaarani, H. (2017), The mutual impacts of corporate governance
dimensions and legal protection systems on the performance of European banks: A post-crisis study. European Research Studies,
20(2A), 538-567.
El-Masry, A. (2016), Capital structure and performance of Middle East and North Africa (MENA) banks: An assessment of credit rating. Banks and Bank Systems, 11(1), 77-91.
Fama, E.F., French, K.R. (2002), Testing trade-off and pecking order
predictions about dividends and debt. Review of Financial Studies,
15(1), 1-33.
Gropp, R., Heider, F. (2010), The determinants of bank capital structure. Review of Finance, 14(4), 587-622.
Holmstrom, B., Tirole, J. (1997), Financial intermediation, loanable funds and the real sector. Quarterly Journal of Economics, 112(3), 663-691. Jensen, M.C. (1986), Agency costs of free cash flow, corporate finance
and takeovers. American Economic Review, 76, 323-339.
behavior, agency costs and ownership structure. Journal of Financial
Economics, 3(4), 305-360.
Kayo, E.K., Kimura, H. (2011), Hierarchical determinants of capital structure. Journal of Banking and Finance, 35(2), 358-371. Kleff, V., Weber, M. (2008), How do banks determine capital? Evidence
from Germany. German Economic Review, 9(3), 354-372. Kraus, A., Litzenberger, R.H. (1973), A state-preference model of optimal
financial leverage. The Journal of Finance, 28(4), 911-922.
Mehran, H., Thakor, A. (2011), Bank capital and value in the cross-section. Review of Financial Studies, 24(4), 1019-1067.
Miller, M.H. (1995), Do the M and M propositions apply to banks? Journal of Banking and Finance, 19(3), 483-489.
Mishkin, F. (2000), The Economics of Money, Banking and Financial
Markets. 6th ed. New York: Addison Wesley.
Modigliani, F., Miller, M. (1963), Corporate income taxes and the cost of capital: A correction. American Economic Review, 53, 443-453. Myers, S., Majluf, N. (1984), Corporate financing and investment
decisions when firms have information that investors do not have. Journal of Financial Economics, 13, 187-221.
Myers, S.C. (1977), Determinants of corporate borrowing. Journal of Financial Economics, 5(2), 147-175.
Nikoo, S.F. (2015), Impact of capital structure on banking performance:
Evidence from Tehran stock exchange. International Research
Journal of Applied and Basic Sciences, 9(6), 923-927.
Octavia, M., Brown, R. (2010), Determinants of bank capital structure
in developing countries: Regulatory capital requirement versus the standard determinants of capital structure. Journal of Emerging
Market, 15(1), 50-62.
Saeed, M.M., Gull, A.A., Rasheed, M.Y. (2013), Impact of capital structure on banking profitability (a case study of Pakistan). Interdisciplinary Journal of Contemporary Research in Business, 4(10), 393-403. Siddik, N., Kabiraj, S., Shanmugan, J. (2017), Impacts of capital structure
on performance of banks in a developing economy: Evidence from