International Journal of Industrial Electronics, Control and Optimization .
© 2018 IECO….Vol. 1, No. 2, pp. 153-161, June (2018)
A Detailed Study for Load Flow Analysis in Distributed Power System
Mohammad Ghiasi
Power Control Center (PCC), Tehran Metro; Tehran Urban and Suburban Railway Operation Company, Iran; Department of Electrical Engineering; Science and Research Branch, Islamic Azad University, Tehran, Iran
Load flow (LF) is one of the most important parts to study and analyze power system operation. In this research paper, a detailed study for load flow analysis in distributed power system (DPS) is presented. A case study of modeling and simulation of the actual power distribution network is implemented with the electrical transient analyzer program (ETAP) software (version no: 12.6). Furthermore, a comparison of common load flow techniques of power distribution is presented. In this assessment, numerical and practical methods including Newton-Raphson (NR), Fast Decoupled (FD), and Accelerated Gauss-Seidel (AGS) are provided and compared. The results (total generation, loading, demand, system losses, and critical report of load flow) are obtained and analyzed. This paper focuses on the detailed assessment and monitoring by using the most modern ETAP software, from high voltage substation (HVS) to the loads. The capability and effectiveness of load flow assessment are demonstrated according to the simulation results obtained with ETAP by applying it to the actual distributed power system of Tehran metro (subway). Once the modeling is performed in ETAP for complete power system, it might be highly beneficial for converting conventional grid into smart grid.
Article Info Keywords:
ETAP, Distributed Power System Load Flow Analysis, Tehran Metro. Article History:
Received 2018-03-15 Accepted 2018-06-01
N
OMENCLATURESAC Alternating current VT Transpose of V B Susceptance ( ) Vi Voltage at node i (V) DC Direct current |V| Voltage Magnitude
G Conductance ( ) Y Admittance ( )
I Current (A) i, j and k Indices of buses
I* Conjugate of I δ Phase angle of voltage (degree, rad)
J Jacobian matrix Δ Mismatch
n Number of branch (i, k) P.U Per unit P Active power (kW) kVA Kilo volt ampere Q Reactive power (kVAr) kVAr Kilo var
PV Generator bus ri Repair time
PQ Load bus
S Apparent power (kVA) List of abbreviation
V Voltage (V) RS Rectifier Substation
V* Conjugate of V LPS Lighting and Power Substation λs Failure rate HVS High Voltage Substation rs Average outage duration P.F Power Factor
Us Average annual outage time ASAI Average service availability index
Corresponding Author: [email protected];
[email protected] Tel: +98-937-4550691;
Power Control Center (PCC), Tehran Metro; Tehran Urban and Suburban Railway Operation Company (TUSRC), Tehran, Iran;Department of Electrical Engineering; Science and Research Branch, Islamic Azad University, Tehran, Iran
I.
I
NTRODUCTIONA. Background
Nowadays, load flow (LF) is one of the important tools utilized by electrical experts for planning and control, to determine the best operation for distributed power systems (DPSs) and the exchange of power between utility companies. In the last decades, electrical engineers have been dealing with power system studies by using new software tools. Recent advances in electrical engineering sciences have brought a revolution in the field of electrical engineering after the development of powerful computer based software [1-4]. Load flow methods might take a long time to be calculated; therefore, it prevents achieving an accurate result for a load flow solution because of continuous changes in power demand and generation. The principal information obtained from a load flow analysis is the magnitude and phase angle of the voltage at each bus, and the real and reactive load flowing in each line [5, 6]. Commercial power systems are usually too complex to allow handing solutions for the load flow. Large-scale digital computers have replaced analogous methods with numerical solutions. Besides, in order to the load flow analysis; computer programs perform related calculations such as short-circuit fault assessment, stability studies with focus on transient and steady-state, unit commitment and economic dispatch [7]. Maintaining a high level of system security is one of the more important aspects of power systems that should be noted as well as the economic operation of these systems [8].
B. Literature Review
In recent years, many researchers have proposed different approaches to analysis, simulation and modeling in the field of power systems and metro structures. Some recently published papers and literature reviews can be found in [9-12]; the most important factors of metro tunnels safety and importance of safety and security to improve the more comfortable services in metro tunnel and subway stations is explained in [13]; in the reference [14], the criteria and rules for design of metro path is dedicated; in the paper [15], the authors presented a review of probabilistic load flow in power systems; the reference [16] deals with an analytical methodology for assessment of smart monitoring impact on future electric power distribution system. In the paper [17, 18], a new prediction model is introduced based on hybrid forecast engine and new feature selection; [19] proposes a new forecast approach based on combination of a neural network with a meta-heuristic algorithm as the hybrid forecasting engine. NR load flow with consideration of the fuzzy load and in the presence of the distributed generations in distribution network is presented in [20].
For optimal power system operation, electrical generation
should follow electrical load demand. So, short term load forecast (STLF) has been proposed by researchers to tackle the mentioned problem. So, the paper [21] proposes a new prediction model for small scale load prediction. The paper [22] used new algorithm to optimal sizing and sitting of distributed generation in power system. The particle swarm optimization (PSO) based fuzzy stochastic long-term model for deployment of distributed energy resources in distribution systems with several objectives is proposed in [23]; the summary explanation of the basic equation of the load flow problems are described in [3, 24, 25]. The reference [26] proposes a novel method to deal with the energy minimization; in the paper [27] the wavelet decomposition combined with adaptive neuro-fuzzy inference system is used for short term wind power forecasting.
C. Motivation and Main Contribution
In this paper, we focus on the effective usage of the ETAP software for load flow analysis and modeling in the distributed power system of Tehran metro. The results comprise large distributed power systems emanating from high voltage (H.V.), medium voltage (M.V.), and low voltage (L.V.) networks, equipment and loads; the data used for the assessment objective are in the form of one line diagrams of the complete and actual power grid of Tehran metro starting from HVS and power transformer at the grid up to the loads. The ratings of all the components of the power system network are taken as they actually exist. Also, the transformers, circuit breakers (C.B.) and load switch (L.S.), conductor’s cables, distribution system and DC components are also simulated according to the actual ratings by electrical transient analyzer program software, and this innovative concept deals with 63kV, 20kV, 0.75kV and 0.4kV network simulations with the ETAP software.
D. Paper Structure
International Journal of Industrial Electronics, Control and Optimization .
© 2018 IECO…. 155II.
M
ATERIALS ANDM
ETHODIn section 2, three common load flow methods are explained.
A. Bus Classifications
According to the references [25, 28-30], bus is a point or node in which one or many transmission lines, loads and generators are connected. Traditionally, in a power system study, every bus is associated with four quantities: active power (P), reactive power (Q), magnitude of voltage (|V|), and phase angle of voltage (δ). In addition, buses are divided into three important categories including: 1) slack bus, 2) generator (PV) bus, and 3) load (PQ) bus. These categories are shown in Table I.
TABLEI BUS CLASSIFICATION Type of Bus Variables
P Q V δ
Slack Unknown Unknown Known Known
(PV) Known Unknown Known Unknown
(PQ) Known Known Unknown Unknown
B. Load Flow Calculation Methods
In the past three decades, various numerical analysis methods have been applied for solving load flow analysis problems. The most commonly used iterative methods are the GS, NR, and FD methods [5, 31]. According to the reference [5], the first step in performing a load flow assessment is to form the Y-bus admittance using the transmission line and the transformer input data. The nodal equation for a power system network using Y-bus can be written as follows:
I Y V
The nodal formula can be expressed in a generalized form for an n bus system.
I ∑ Y V ; for i 1, 2, 3, … , n
The complex power delivered to bus i is given by:
P jQ V I∗
I P jQ
V∗
Substituting for Ii in terms of Pi and Qi, the formula is given as:
∗ V ∑ Y ∑ Y V ; j i
On the other hand, according to the reference [32],
complex power injection of the system is given by:
S S S Generation Load
S S
Where in the equations (6) and (7); k = 1, 2,…,n ; i = 1, 2,…,n
Similarly, the phasor of current injections are given by:
I I I Y V
S V I∗ V Y∗ V∗
S |V ||V |e G jB
Where: Vk = |Vk| eiδik ; δik = δi – δk ; Yik = Gik + jBik
Breaking the complex of load flow formulation into real and imaginary parts are given by:
| || |
P |V ||V | G cos δ B sin δ
Q |V ||V | G cos δ B sin δ
These three equations (11, 12, and 13) utilize iterative techniques to solve load flow problems. Therefore, they are necessary to review the general forms of the various solution methods: NR, FD and AGS load flow.
1. Newton-Raphson Method
The NR method formulates and iteratively solves the following load flow equation:
∆P
∆Q J1 J2J3 J4 ∆V∆δ
calculated value, respectively. ΔV and Δδ represent bus voltage magnitude and angle vectors in an incremental form; and J1 through J4 are called Jacobian matrices [28, 30, 33, 34].
2. Fast-Decoupled Method
The FD method is derived from the NR method. It takes in the fact that a small change in the bus voltage magnitude does not vary the real power at the bus extremely, and likewise, for a small change in the phase angle of the bus voltage, the reactive power does not change much. So the equation of load flow from the NR method can be simplified into two separate decoupled sets of power equations, which can be solved iteratively [28, 30, 33, 34]:
|∆ | | 1||∆ |
|∆ | | 3||∆ |
It has to mention that compared to the NR method, the FD method reduces the storage of computer memory by almost half. It also solves the load flow equations by taking significantly less computer time than that required by the NR method, since the Jacobian matrices are constant [28, 30, 33, 34].
3. Accelerated Gauss-Seidel Method From the system nodal voltage equation:
| | | || |
The AGS method derives the following load flow equation and solves it iteratively:
| | | || ∗ ∗|
Where in the equation (17), P and Q are the specified bus real and reactive power vectors, V is the bus voltage vector; YBUS is the system admittance matrix. YBUS* and V* are the conjugates of YBUS and V, respectively; VT is defined as the transpose of V [28, 30, 33, 34].
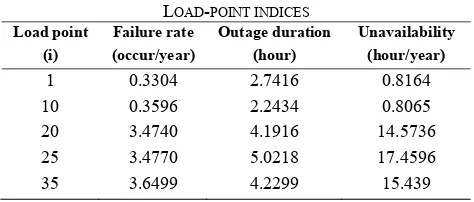
It has to mention that ETAP software is able to calculate and analyze the reliability in power system; therefore, to show the capability of the ETAP software, it can be considered a sample reliability index over the optimization process. For instance, Based on the element data and the configurat on of the general feeder [35], a set of traditional analysis formulas for calculating the basic load-point indices of load-point failure rate λs , average outage duration rs and average annual outage time Us for load point S of a general feeder is as follows:
Where λ is defined as a failure rate of the failed component i (occur/year); λ is defined as a maintenance outage rate of the component i (occur/year); r is defined as a repair time of the failed component i (hour); r is defined as a maintenance outage time of the component i (hour). The average service availability index (ASAI) of the system can be calculated using the following formula:
ASAI 8760 ∑ N ∑ N U
8760 ∑ N (20)
r = (21)
Here: N is the number of a customer in the load point i and U is the average annual outage time at the load point i.
Table II shows a representative sample of the load point reliability indices where the indices are equal to the calculation results of literature [36].
TABLE II
LOAD-POINT INDICES Load point
(i)
Failure rate (occur/year)
Outage duration (hour)
Unavailability (hour/year) 1 0.3304 2.7416 0.8164 10 0.3596 2.2434 0.8065 20 3.4740 4.1916 14.5736 25 3.4770 5.0218 17.4596 35 3.6499 4.2299 15.439
III.
C
ASE STUDYAccording to the paper [37], line 2 of Tehran metro was supplied from three high voltage substations (HVS) and also it consists of 154 main feeders. All HVSs in the power network of Tehran metro include 63/20KV and gas insulated substation (GIS) type. Each station of Tehran metro has two lighting and power substations (LPS). The LPSs supply electric power for every component, equipment and loads. The LPS is situated at each substation platform. Besides, rectifier substation (RS) converts AC to DC power to supply electric energy for traction motors of trains.
Most of the stations on line 2 of Tehran metro have one RS. Each RS is capable to convert 20KV (AC) to 750V (DC) using diode rectifiers.
International Journal of Industrial Electronics, Control and Optimization .
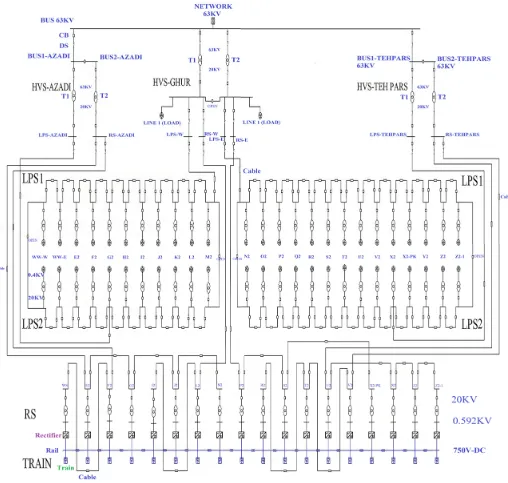
© 2018 IECO…. 157Tehran metro in the form of ETAP is displayed in Fig 1. As can be seen from the Fig. 1, HVSs are situated on the top,
LPS and loads at the middle, and RS and loads at the bottom.
Fig 1.Single line diagram of the power distribution system of Tehran metro (Line 2) in the form of ETAP
According to the monthly report (July 2017) from power distribution unit of Tehran metro, the total consumption for LPSs and RSs (active and reactive) are measured, and these informational data are presented in Table III and Table IV, respectively.
TABLE III
LPS INFORMATION DATA
Station LPS kW.h kVAr.h % P.F
WWW LPS1 13200 12600 0.723355544
LPS2 88800 58200 0.836371791
WWE LPS1 104400 46800 0.912509325 LPS2 79200 59400 0.801123211
E2 LPS1 134400 87600 0.837759372
LPS2 164400 105000 0.842773779
F2 LPS1 75000 62400 0.768725123 LPS2 79800 46800 0.862600381
G2 LPS1 82200 52800 0.841377961
LPS2 48600 43800 0.742837965
H2 LPS1 98400 59200 0.856877624 LPS2 65600 42400 0.839844835
I2 LPS1 70200 63600 0.741085436
LPS2 66600 54600 0.773336106
J2 LPS1 77400 71400 0.735021854 LPS2 50400 49800 0.711328201
K2 LPS1 81000 100800 0.626391108
LPS2 39000 54600 0.581238194
L2 LPS1 63600 90600 0.574553174 LPS2 85800 96600 0.664075548
M2 LPS1 104400 88200 0.763885626
LPS2 105000 87000 0.770021561
N2 LPS1 28800 36400 0.620482186 LPS2 123600 90000 0.808396555
O2 LPS1 55200 57600 0.691905363
LPS2 121200 94200 0.789562641
P2 LPS1 135600 80400 0.860167816 LPS2 51600 23400 0.910728795
Q2 LPS1 36400 27200 0.801055097
LPS2 22400 34800 0.541245989
R2 LPS1 145200 108600 0.800793475 LPS2 38400 24000 0.847998304
S2 LPS1 159000 114600 0.811243918
LPS2 41400 39000 0.727890219
T2 LPS1 156000 112200 0.811830358 LPS2 28200 20400 0.810224411
U2 LPS1 154200 115800 0.799626479
LPS2 36000 32400 0.743294146
V2 LPS1 165600 119400 0.811143955 LPS2 6600 8400 0.617821552
X2 LPS1 53200 26000 0.898443585
LPS2 143600 40400 0.962629097
Y2 LPS1 143272 93292 0.838001817
LPS2 44745 7474 0.986334879
Z2 LPS1 58039 20151 0.944680879 LPS2 120184 54718 0.910112674
Z2-1 LPS1 24256 43823 0.484267581
LPS2 21265 24960 0.648515545
X2-PK LPS1 78400 36800 0.905236944 LPS2 44400 26000 0.862931791
TABLE IV
RS INFORMATION DATA
Station RS - kW.h kVAr.h % P.F
WW 38000 7000 0.983453189
E2 258000 35000 0.990923419
F2 305000 51000 0.986306385
G2 365000 69000 0.982596814
I2 389000 69000 0.984630287
J2 313000 55000 0.984910009
L2 408000 72000 0.984783559
N2 291000 46000 0.987735429
P2 365000 62000 0.985878152
R2 292000 51000 0.985087696
S2 293000 47000 0.987377466
T2 222000 32000 0.98977037
U2 198000 28000 0.990148533
V2 195000 23000 0.993115797
X2 236000 30000 0.992017044
Y2 198000 51000 0.96839174
Z2 207000 51000 0.970964612
Z2-1 217000 54000 0.970404983
TABLE V
THE VALUES OF LOAD FLOW METHODS
Method Max Iteration Precision Accel Factor
NR 10 0.0001 -
FD 99 0.0001 -
AGS 2000 0.00001 1.45
IV.
R
ESULTS OF LOAD FLOW ANALYSISUsing NR load flow method, branch losses summary report on transformers and cables are shown in Table VI and Table VII, respectively.
International Journal of Industrial Electronics, Control and Optimization .
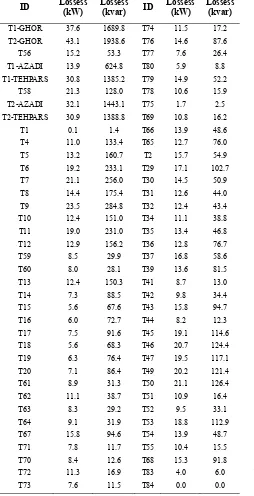
© 2018 IECO…. 159TABLE VI
BRANCH LOSSES SUMMARY REPORT ON TRANSFORMERS
ID Lossess (kW) Lossess (kvar) ID Lossess (kW) Lossess (kvar)
T1-GHOR 37.6 1689.8 T74 11.5 17.2
T2-GHOR 43.1 1938.6 T76 14.6 87.6
T56 15.2 53.3 T77 7.6 26.4
T1-AZADI 13.9 624.8 T80 5.9 8.8
T1-TEHPARS 30.8 1385.2 T79 14.9 52.2
T58 21.3 128.0 T78 10.6 15.9
T2-AZADI 32.1 1443.1 T75 1.7 2.5
T2-TEHPARS 30.9 1388.8 T69 10.8 16.2
T1 0.1 1.4 T66 13.9 48.6
T4 11.0 133.4 T65 12.7 76.0
T5 13.2 160.7 T2 15.7 54.9
T6 19.2 233.1 T29 17.1 102.7
T7 21.1 256.0 T30 14.5 50.9
T8 14.4 175.4 T31 12.6 44.0
T9 23.5 284.8 T32 12.4 43.4
T10 12.4 151.0 T34 11.1 38.8
T11 19.0 231.0 T35 13.4 46.8
T12 12.9 156.2 T36 12.8 76.7
T59 8.5 29.9 T37 16.8 58.6
T60 8.0 28.1 T39 13.6 81.5
T13 12.4 150.3 T41 8.7 13.0
T14 7.3 88.5 T42 9.8 34.4
T15 5.6 67.6 T43 15.8 94.7
T16 6.0 72.7 T44 8.2 12.3
T17 7.5 91.6 T45 19.1 114.6
T18 5.6 68.3 T46 20.7 124.4
T19 6.3 76.4 T47 19.5 117.1
T20 7.1 86.4 T49 20.2 121.4
T61 8.9 31.3 T50 21.1 126.4
T62 11.1 38.7 T51 10.9 16.4
T63 8.3 29.2 T52 9.5 33.1
T64 9.1 31.9 T53 18.8 112.9
T67 15.8 94.6 T54 13.9 48.7
T71 7.8 11.7 T55 10.4 15.5
T70 8.4 12.6 T68 15.3 91.8
T72 11.3 16.9 T83 4.0 6.0
T73 7.6 11.5 T84 0.0 0.0
Table VII shows the summary report of branch losses (Max Loading) in the power distribution network of line 2 of Tehran metro. As can be seen, Table VII shows that the results of three methods are very close together.
In addition, the summary of total generation, loading and demand for maximum loading is shown in Table IX.
TABLE VII
BRANCH LOSSES SUMMARY REPORT ON CABLES
ID Lossess (kW) Lossess (kvar) ID Lossess (kW) Lossess (kvar)
Cable1 0.0 0.0 Cable129 9.6 9.6
Cable4 5.4 1.4 Cable140 18.7 18.8
Cable134 28.8 29.0 Cable89 0.6 0.6
Cable138 33.9 34.1 Cable101 2.9 3.0
Cable60 0.1 0.1 Cable90 0.8 0.8
Cable61 1.0 1.0 Cable100 3.8 3.8
Cable3 1.8 1.9 Cable128 2.9 2.9
Cable135 0.0 0.0 Cable91 3.1 3.1
Cable137 1.8 1.8 Cable143 8.6 8.7
Cable62 2.2 2.2 Cable144 16.2 16.3 Cable5 1.8 1.9 Cable99 2.8 2.9
Cable133 14.5 14.6 Cable126 2.5 2.5
Cable63 4.0 4.0 Cable92 5.6 5.7
Cable136 23.5 23.6 Cable98 2.0 2.0
Cable13 3.6 3.6 Cable127 6.5 6.6
Cable64 4.4 4.4 Cable93 7.4 7.4 Cable12 3.2 3.3 Cable97 1.6 1.6
Cable130 5.1 5.1 Cable125 12.0 12.1
Cable65 2.1 2.1 Cable94 11.1 11.1 Cable11 4.1 4.1 Cable96 1.2 1.2
Cable131 3.2 3.2 Cable95 13.1 13.2
Cable66 1.4 1.4 Cable14 0.0 0.0 Cable10 4.6 4.6 Cable9 0.0 0.0 Cable67 0.6 0.6 Cable113 0.2 0.2 Cable17 5.5 5.6 Cable2 0.2 0.2
Cable141 6.7 6.7 Cable6 0.7 0.7
Cable68 0.1 0.1 Cable114 0.6 0.6
Cable139 6.5 6.6 Cable112 0.3 0.3
Cable142 3.1 3.2 Cable124 3.8 3.8
Cable145 26.0 26.2 Cable115 0.4 0.4
Cable104 4.8 4.9 Cable122 0.8 0.8
Cable87 0.0 0.0 Cable111 0.0 0.0
Cable103 3.1 3.2 Cable116 0.0 0.0
Cable88 0.1 0.1 - - -
Cable102 3.2 3.2 Total 1354.6 13854.1
TABLE VII
BRANCH LOSSES SUMMARY REPORT (MAX LOADING)
Method Losses Branch (Transformers, Cables) kW (P) kVAr (Q)
NR 1354.6 13854.1
FD 1354.7 13854.2
TABLE IX
SUMMARY OF TOTAL GENERATION, LOADING AND DEMAND (MAX. LOADING)
Type MW (P) MVAr (Q) MVA (S) % P.F
Source 97.824 83.84 128.345 Lagging 73.22 Total
Demand 97.824 83.084 128.345 76.22 Lagging Total Motor
Load 86.764 58.037 104.385 83.12 Lagging Total Static
load 9.566 6.878 11.782 81.19 Leading Apparent
Losses 1.495 18.168 - -
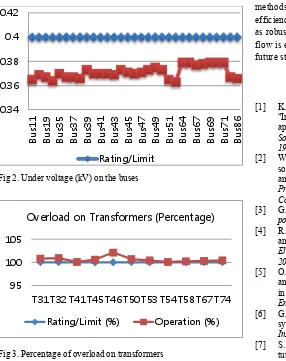
The results of these three load flow methods are almost exactly the same; hence, due to the similarity of the results in each of three load flow simulations, the critical reports of NR load flow are illustrated in Figs 2 and 3 respectively. Fig. 2 shows the amount of under voltage (kV) in different distribution transformers. Fig. 3 shows the percentage of overload on transformers. The marginal and critical voltage drop and overload standard set by utility are 2% and 5 % respectively which are significantly violated here.
Fig 2. Under voltage (kV) on the buses
Fig 3. Percentage of overload on transformers
V.
C
ONCLUSIONIn this study, a comprehensive study for load flow analysis in distributed power system was presented. Besides, a case study of modelling, simulation, and load flow analysis of the actual distributed power system of Tehran metro (line 2) using ETAP is implemented. In this paper, a comparison of three common load flow techniques including Newton-Raphson, Fast Decoupled, and Accelerated Gauss-Seidel was presented; the numerical methods of load flow were compared; the theoretical and practical approaches of load flow have been learned, compared, and applied to solve the tasks given. The results of load flow assessment (total generation, loading, demand, and power losses) were obtained and analyzed. In addition, a load flow based simulation using ETAP were developed to find out the optimum location of distribution system unit for load profile improvement and minimizing power losses in the test distribution system. In order to improve speed performance and computational accuracy in power system analysis, using powerful software like ETAP is very practical and helpful, and it also offers a better view of the power network. Further research work can be done for finding more powerful methods to solve the power flow equations with more efficiency in terms of time, computer memory storage as well as robustness. In addition, understanding the best way of load flow is economical, and therefore which can be a hot topic for future studies of the power distribution system.
R
EFERENCES[1] K. Brown, F. Shokooh, H. Abcede, and G. Donner, "Interactive simulation of power systems: ETAP applications and techniques," in Industry Applications Society Annual Meeting, 1990., Conference Record of the 1990 IEEE, 1990, pp. 1930-1941.
[2] W. Zhongxi and Z. Xiaoxin, "Power system analysis software package (PSASP)-an integrated power system analysis tool," in Power System Technology, 1998. Proceedings. POWERCON'98. 1998 International Conference on, 1998, pp. 7-11.
[3] G. W. Stagg and A. H. El-Abiad, Computer methods in power system analysis: McGraw-Hill, 1968.
[4] R. A. J. Khan, M. Junaid, and M. M. Asgher, "Analyses and monitoring of 132 kV grid using ETAP software," in Electrical and Electronics Engineering, 2009. ELECO 2009. International Conference on, 2009, pp. I-113-I-118. [5] O. A. Afolabi, W. H. Ali, P. Cofie, J. Fuller, P. Obiomon,
and E. S. Kolawole, "Analysis of the Load Flow Problem in Power System Planning Studies," Energy and Power Engineering, vol. 7, p. 509, 2015.
[6] G. Andersson, "Modelling and analysis of electric power systems," EEH-Power Systems Laboratory, Swiss Federal Institute of Technology (ETH), Zürich, Switzerland, 2004. [7] S. H. Low, "Convex relaxation of optimal power flow: A
tutorial," in Bulk Power System Dynamics and Control - IX Optimization, Security and Control of the Emerging Power Grid (IREP), 2013 IREP Symposium, 2013, pp. 1-15.
0.34 0.36 0.38 0.4 0.42 Bu s1 1 Bu s1 9 Bu s3 5 Bu s3 7 Bu s3 9 Bu s41 Bu s43 Bu s45 Bu s47 Bu s49 Bu s5 1 Bu s6 4 Bu s6 7 Bu s6 9 Bu s7 1 Bu s86 Rating/Limit 95 100 105
T31 T32 T41 T45 T46 T50 T53 T54 T58 T67 T74 Overload on Transformers (Percentage)
International Journal of Industrial Electronics, Control and Optimization .
© 2018 IECO…. 161[8] P. Akbary, M. Ghiasi, M. R. R. Pourkheranjani, H. Alipour, and N. Ghadimi, "Extracting appropriate nodal marginal prices for all types of committed reserve," Computational Economics, pp. 1-26, 2017.
[9] A. Zerigui, L.-A. Dessaint, R. Hannat, R. T. A. King, and I. Kamwa, "Statistical approach for transient stability constrained optimal power flow," IET Generation, Transmission & Distribution, vol. 9, pp. 1856-1864, 2015. [10] D. Van Hertem, J. Verboomen, K. Purchala, R. Belmans,
and W. Kling, "Usefulness of DC power flow for active power flow analysis with flow controlling devices," in AC and DC Power Transmission, 2006. ACDC 2006. The 8th IEE International Conference on, 2006, pp. 58-62. [11] T. Ding, Z. Bie, L. Bai, and F. Li, "Adjustable robust
optimal power flow with the price of robustness for large-scale power systems," IET Generation, Transmission & Distribution, vol. 10, pp. 164-174, 2016.
[12] X. Ran and S. Miao, "Three-phase probabilistic load flow for power system with correlated wind, photovoltaic and load," IET Generation, Transmission & Distribution, vol. 10, pp. 3093-3101, 2016.
[13] V. Ghiasi, S. Ghiasi, H. Omar, B. Ebrahimi, and M. Ghiasi, "A Review of Metro Tunnel safety Parameters and Role of Risk management, Tehran Metro," in Fourth International Symposium on Tunnel Safety and Security, Frankfurt am Main, Germany, 2010, pp. 511-515.
[14] V. Ghiasi, H. Omar, M. Ghiasi, Z. B. M. Yusoff, B. K. Huat, R. Muniandy, et al., "Design Criteria of Subway Tunnels," Australian Journal of Basic and Applied Sciences (AJBAS), ISSN: 1991-8178, vol. 4, pp. 5894-5907, 2010.
[15] P. Chen, Z. Chen, and B. Bak-Jensen, "Probabilistic load flow: A review," in Electric Utility Deregulation and Restructuring and Power Technologies, 2008. DRPT 2008. Third International Conference on, 2008, pp. 1586-1591. [16] A. Ahadi, N. Ghadimi, and D. Mirabbasi, "An analytical
methodology for assessment of smart monitoring impact on future electric power distribution system reliability," Complexity, vol. 21, pp. 99-113, 2015.
[17] M. Ghiasi, M. I. jam, M. Teimourian, H. Zarrabi, and N. Yousefi, "A new prediction model of electricity load based on hybrid forecast engine," International Journal of Ambient Energy, 2017.
[18] M. Ghiasi, E. Ahmadinia, M. Lariche, H. Zarrabi, and R. Simoes, "A New Spinning Reserve Requirement Prediction with Hybrid Model," Smart Science, pp. 1-10, 2018.
[19] O. Abedinia, N. Amjady, and N. Ghadimi, "Solar energy forecasting based on hybrid neural network and improved metaheuristic algorithm," Computational Intelligence, vol. 34, pp. 241-260, 2018.
[20] M. Darabadi, F. Hashemi, N. Ghadimi, and A. Ataei, "Newton-raphson load flow with consideration of the fuzzy load and in the presence of the distributed generations in distribution network," in Environment and Electrical Engineering (EEEIC), 2011 10th International Conference on, 2011, pp. 1-5.
[21] Y. Liu, W. Wang, and N. Ghadimi, "Electricity load forecasting by an improved forecast engine for building level consumers," Energy, vol. 139, pp. 18-30, 2017. [22] N. Ghadimi, "Using HBMO algorithm to optimal sizing &
sitting of distributed generation in power system," Bulletin of Electrical Engineering and Informatics, vol. 3, pp. 1-8, 2014.
[23] N. Ghadimi, M. Afkousi-Paqaleh, and A. Nouri, "PSO based fuzzy stochastic long-term model for deployment of distributed energy resources in distribution systems with several objectives," IEEE Systems Journal, vol. 7, pp. 786-796, 2013.
[24] R. J. Brown and W. F. Tinney, "Digital solutions for large power networks," Transactions of the American Institute of Electrical Engineers. Part III: Power Apparatus and Systems, vol. 76, pp. 347-351, 1957.
[25] O. I. Elgerd, "Electric energy systems theory: an introduction," 1982.
[26] C. Sun, S. Zhu, and Z. Shi, "Energy Minimization Model Based Target Tracking," National Academy Science Letters, vol. 39, pp. 1-4, 2016.
[27] V. Ranganayaki and S. Deepa, "SVM Based Neuro Fuzzy Model for Short Term Wind Power Forecasting," National Academy Science Letters, vol. 40, pp. 131-134, 2017. [28] D. P. Kothari and I. Nagrath, Modern power system
analysis: Tata McGraw-Hill Education, 2003.
[29] B. Nitve and R. Naik, "Steady state analysis of IEEE-6 Bus System Using PSAT power toolbox," International Journal of Engineering Science and Innovative Technology (IJESIT) Volume, vol. 3, 2014.
[30] H. Saadat, Power system analysis: WCB/McGraw-Hill, 1999.
[31] A. Keyhani, A. Abur, and S. Hao, "Evaluation of power flow techniques for personal computers," IEEE transactions on power systems, vol. 4, pp. 817-826, 1989. [32] K. A. Karim, N. C. Cheow, and L. K. Onn, "Load Flow
Analysis of a Test Distribution: A Case Study," Journal of Applied Sciences Research, vol. 8, pp. 5213-5218, 2012. [33] J. J. Grainger and W. D. Stevenson, Power system
analysis: McGraw-Hill, 1994.
[34] J. D. Glover, M. S. Sarma, and T. Overbye, Power System Analysis & Design, SI Version: Cengage Learning, 2012. [35] M. Blasina, V. Komen, and Ć. Renato, "Voltage control
and compensation of reactive power by SVC devices," Engineering review: znanstveni časopis za nove tehnologije u strojarstvu, brodogradnji i elektrotehnici, vol. 30, p. 47, 2010.
[36] R. Billinton and P. Wang, "Reliability-network-equivalent approach to distribution-system-reliability evaluation," IEE Proceedings-Generation, Transmission and Distribution, vol. 145, pp. 149-153, 1998.
[37] M. Ghiasi and J. Olamaei, "Optimal capacitor placement to minimizing cost and power loss in Tehran metro power distribution system using ETAP (A case study)," Complexity, vol. 21, pp. 483-493, 2016.