University of Warwick institutional repository: http://go.warwick.ac.uk/wrap
This paper is made available online in accordance with
publisher policies. Please scroll down to view the document
itself. Please refer to the repository record for this item and our
policy information available from the repository home page for
further information.
To see the final version of this paper please visit the publisher’s website.
Access to the published version may require a subscription.
Author(s): L. van Spaandonk, D. Steeghs, T. R. Marsh, M. A. P.
Torres
Article Title:
Time-resolved spectroscopy of the pulsating CV GW Lib
Year of publication: 2009
Link to published article:
arXiv:0909.3991v1 [astro-ph.SR] 22 Sep 2009
Time-resolved spectroscopy of the pulsating CV GW Lib
L. van Spaandonk
1⋆, D. Steeghs
1,2, T.R. Marsh
1, M.A.P. Torres
2 1Astronomy and Astrophysics, Dept. of Physics, University of Warwick, Coventry CV4 7AL, UK 2Harvard-Smithsonian for Astrophysics, 60 Garden Street, Cambridge, MA 02138, USAAccepted 2009 September 21. Received 2009 July 17
ABSTRACT
We present time-resolved optical spectroscopy of the dwarf nova GW Librae during its rare April 2007 super-outburst and compare these with quiescent epochs. The data provide the first opportunity to track the evolution of the principal spectral features. In the early stages of the outburst, the optically thick disc dominates the optical and the line components show clear orbital radial velocity excursions. In the course of several weeks, optically thin regions become more prominent as strong emission lines replace the broad disc absorption.
Post-outburst spectroscopy covering the I-band illustrates the advantages of Caii relative to the commonly used Balmer lines when attempting to constrain binary parameters. Due to the lower ionisation energy combined with smaller thermal and shear broadening of these lines, a sharp emission component is seen to be moving in between the accretion disc peaks in the Ca ii line. No such component is visible in the Balmer lines. We interpret this as an emission component originating on the hitherto unseen mass donor star. This emission component has a mean velocity of
∼ −15±5 km s−1
which is associated with the systemic velocityγ, and a velocity semi-amplitude of Kem = 82.2±4.9 km s−
1
. Doppler tomography reveals an asymmetric accretion disc, with the S-wave mapping to a sharp spot in the tomogram with a velocity consistent to what is obtained with line profile fitting. A centre of symmetry analysis of the disc component suggests a very small value for the WD orbital velocity
K1 as is also inferred from double Gaussian fits to the spectral lines.
While our conservative dynamical limits place a hard upper limit on the binary mass ratio of q <0.23, we favour a significantly lower value near q∼0.06. Pulsation modeling suggests a WD mass ∼ 1M⊙. This, paired with a low mass donor, near the empirical sequence of an evolved CV close to the period bounce, appears to be consistent with all the observational constraints to date.
Key words: binaries: spectroscopic – novae, cataclysmic variables – stars: individual:
GW Lib
1 INTRODUCTION
Cataclysmic variables (CVs) are semi-detached interacting binary systems containing a white dwarf (WD) primary and a late-type main-sequence secondary (MS) which transfers mass onto the primary through Roche Lobe overflow, see Warner (1995) for a review. Strong and broad emission lines are a common observational feature in the majority of CVs, probing the dissipative processes within the accretion flow. The hydrogen Balmer series usually dominate the spectrum, and in the vast majority of spectroscopic studies of CVs serve as the main proxy for determining the system param-eters. However, relatively unexplored spectral features
re-⋆ E-mail:[email protected]
main, such as the Caiitriplet lines in the I-band. Common emission line sources include the accretion disc, the interac-tion point of the gas stream with the disc (hot spot) and the irradiated face of the secondary star.
& Kolb catalogue, only 8 systems with a smaller period are known when excluding the AM CVn systems which have H-deficient donors (Ritter & Kolb 2003), implying an evolved binary close to the period minimum. From model fits to the WD absorption troughs and mean spectra, var-ious temperatures have been found. UV spectra suggest
TWD= 14,700 K with a WD mass of 0.6M⊙(Szkody et al.
2002) or a dual temperature WD withTlow= 13,300 K and
Thigh = 17,000 K. The latter model can only explain the observed UV/optical pulse amplitude ratio in GW Lib (see table 2 in Szkody et al. 2002) as compared with single pul-sating ZZ-Ceti stars, if the WD mass of GW Lib is larger than 0.8M⊙. Thorstensen et al. (2002) fit the optical Balmer
line profiles to findT = 13,220 K and logg= 7.4. However, all temperature estimates place the WD outside the ZZ Ceti instability strip for single WD pulsators. A mass determina-tion based on the detected pulsadetermina-tion periods combined with distance and UV flux constraints suggests a WD mass of 1.02M⊙(Townsley et al. 2004).
On 2007 April 12, amateur astronomers reported the sudden and rapid brightening of GW Lib (Templeton 2007) indicating renewed outburst activity, 24 years after the dis-covery outburst. The outburst had an amplitude of∼9 mag-nitudes and lasted for several weeks, see Figure 1.
We present the first time-resolved optical spectroscopy of GW Lib in (super)outburst (Section 3) alongside time-resolved optical spectroscopy during quiescence before and after the outburst (Section 4). We present the possible sys-tem parameters in Section 5 and the discussion in Section 6.
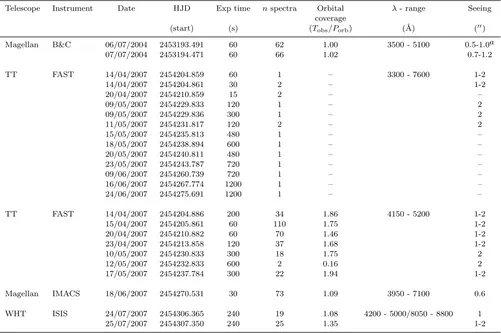
2 OBSERVATIONS AND REDUCTION
We briefly describe the facilities used below. Full details of the observations can be found in Table 1.
2.1 Telescopes and Instruments
The telescopes used were the Magellan Telescopes oper-ated by the Carnegie Institution of Washington at the Las Campanas Observatory in Chile, the Smithsonian Astro-physical Observatory’s Tillinghast Telescope at the Fred Lawrence Whipple Observatory, located on Mount Hopkins near Amado, Arizona and the William Herschel Telescope operated by the Isaac Newton Group on the island of La Palma.
2.1.1 Magellan Telescope
Time-resolved optical spectroscopy was acquired during qui-escence with the Baade 6.5-m telescope equipped with the Boller and Chivens Spectrograph (b&c) on 2004 June 6 and 7. Theb&cwas used with a Marconi 2048×515ccdwith
a 13.5 microns pixel size and a 1200 lines mm−1 grating covering the spectral interval 3500−5100˚A. A slit width of 0.8 arcsec gave a dispersion of 0.79˚A pixel−1and a resolution of 2.0˚A.
On 2007 June 19 the telescope was equipped with the Inamori-Magellan Areal Camera and Spectrograph (imacs:
Bigelow & Dressler 2003) to acquire time-resolved spec-troscopy of GW Lib. Imacs was used with the f/4 camera
and the long-slit-mask with a 0.7 arcsec slit width and a 600 lines mm−1 grating centred at 5550˚A. The spectra were dis-persed along the short-axis of four SITeccds in theimacs
mosaic detector. Theccddetectors were binned two by two
during the observations. This instrumental setup provided a dispersion of 0.76˚A pixel−1 and a spectral resolution of 1.29˚Afwhmin the spectral interval 3950−7100˚A.
2.1.2 Tillinghast Telescope
The 1.5-m reflector Tillinghast Telescope (tt) equipped with thefastinstrument (Fabricant et al. 1998) acquired 7
epochs of time-resolved spectroscopy and 16 epochs of single spectroscopic frames in service mode. For the time-resolved observations, thefastinstrument was equipped with a 2688
×512 UA STA520Accdchip with a 15 microns pixel size. A grating of 1200 lines mm−1 covering 4150−5200˚A and a 1.5 arcsec slit width was used to deliver a dispersion of 0.38˚A pixel−1 and spectral resolution of 0.86˚A fwhm.
For the single frames the telescope was used in service mode with a grating of 300 lines mm−1 and an aperture of 3.0 arcsec to cover the spectral interval 3300−7600˚A. The pixels were binned two by two to give a dispersion of 1.47˚A pixel−1 and a resolution of 5.9˚A.
2.1.3 William Herschel Telescope
On two successive nights, three months after the 2007 out-burst, we acquired time-resolved spectroscopic data using the 4.2-m William Herschel Telescope (wht) in combination
with the two-armed Intermediate dispersion Spectrograph and Imaging System (isis). The blue arm of the
spectro-graph was equipped with a 4096×2048 EEV12ccd. The slit width used was 1.0 arcsec and used with the R1200B grat-ing with 1200 lines mm−1 providing a wavelength coverage of 4200−5000˚A. This setup delivers a dispersion of 0.224˚A pixel−1. The red arm was equipped with a 4096 × 2048 Red+ccdwith 15 microns pixels. Using the R1200R grat-ing with 1200 lines mm−1 the unvingetted wavelength cov-erage was 8050−8800˚A with a dispersion of 0.243˚A pixel−1. The spectral resolution for both arms was 0.62˚A.
2.2 Reduction
The different sets of spectroscopic data were reduced using several reduction packages.
2.2.1 FAST service mode
The single frame spectra obtained with the fast
spectro-graph in service mode were extracted using the spectral extraction pipeline provided by the Telescope Data Center at the Harvard-Smithsonian Center for Astrophysics. This tailored pipeline is based on the iraf procd package, see
Tokarz & Roll (1997).
2.2.2 Magellan IMACS
Table 1.Observations of GW Lib
Telescope Instrument Date HJD Exp time nspectra Orbital λ- range Seeing coverage
(start) (s) (Tobs/Porb) (˚A) (′′)
Magellan B&C 06/07/2004 2453193.491 60 62 1.00 3500 - 5100 0.5-1.0a
07/07/2004 2453194.471 60 66 1.02 0.7-1.2
TT FAST 14/04/2007 2454204.859 60 1 – 3300 - 7600 1-2
14/04/2007 2454204.861 30 2 – 1-2
20/04/2007 2454210.859 15 2 – –
09/05/2007 2454229.833 120 1 – 2
09/05/2007 2454229.836 300 1 – 2
11/05/2007 2454231.817 120 2 – 2
15/05/2007 2454235.813 480 1 – –
18/05/2007 2454238.894 600 1 – –
20/05/2007 2454240.811 480 1 – –
23/05/2007 2454243.787 720 1 – –
09/06/2007 2454260.739 720 1 – –
16/06/2007 2454267.774 1200 1 – –
24/06/2007 2454275.691 1200 1 – –
TT FAST 14/04/2007 2454204.886 200 34 1.86 4150 - 5200 1-2
15/04/2007 2454205.861 60 110 1.75 1-2
20/04/2007 2454210.882 60 70 1.46 1-2
23/04/2007 2454213.858 120 37 1.68 1-2
10/05/2007 2454230.833 300 18 1.75 2
12/05/2007 2454232.833 600 2 0.16 2
17/05/2007 2454237.784 300 22 1.94 1-2
Magellan IMACS 18/06/2007 2454270.531 30 73 1.09 3950 - 7100 0.6 WHT ISIS 24/07/2007 2454306.365 240 19 1.08 4200 - 5000/8050 - 8800 1
25/07/2007 2454307.350 240 25 1.35 1-2
a From Magellan Guide Camera Seeing atwww.lco.cl
ccd frame with the iraf kpnoslitpackage. The pixel-to-wavelength calibration was derived from cubic spline fits to HeNeAr arcs acquired during the observations. Fitting 10 -20 lines per frame gave a RMS<0.017˚A per chip.
2.2.3 All others
All other data sets were reduced in the following way. The average bias and flat-field correction was carried out using thefigaropackage fromstarlinkand nightly average bias
and tungsten frames.Pamelawas used for the optimal ex-traction of the spectra (Marsh 1989). Regular CuAr arc lamp exposures allowed us to establish an accurate wavelength scale for each spectrum through interpolation between the nearest arcs in time. Each arc frame has been fitted with a 5th order polynomial to 10-40 lines to give a typical RMS of 0.1 pixel. The individual spectra were normalised to the continuum level using a spline fit to selected continuum re-gions.
3 GW LIB IN OUTBURST
The April 2007 outburst of GW Lib triggered our target of opportunity program at the tt. Both time-resolved
spec-troscopy and single frame observations of GW Lib were ob-tained during this period of activity. See Table 1 for specific details.
3.1 Spectral evolution
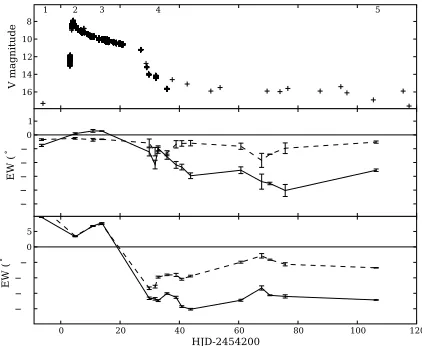
In Figure 2 average representative normalised spectra dur-ing different stages of the outburst of GW Lib are presented. The bottom spectrum is during quiescence 3 years before the 2007 outburst, the second spectrum is a day after outburst peak, the third during slow decline, the fourth during rapid decline and the fifth during the final decline towards quies-cence. For reference, the top frame in Figure 1 shows the outburst light curve in the V-band, as provided byaavso
and its network of observers. The dates corresponding to the spectra plotted in Figure 2 are marked. The pre-outburst quiescent spectrum is given an arbitrary negative HJD for plotting purposes.
The single frame spectra at different nights through-out the through-outburst make it possible to trace the evolution of various spectral features. We have measured the equivalent widths (ew) of the lines as a function of the outburst. For the
4200 4400 4600 4800 5000 5200 Wavelength A
2 4 6 8 10 12
Flux
07 07 2004 - 1
x4 15 04 2007 - 2
x4 23 04 2007 - 3
12 05 2007 - 4 24 07 2007 - 5
H
[image:5.612.101.490.119.300.2]H Mg IIHe IHe IHe IHe IHe IHe IIFe IFe II
Figure 2.Comparison of average representative normalised spectra of GW Lib sampling the spectral evolution before and during the 2007 super-outburst. The April 2007 spectra have been multiplied by a factor of 4 to magnify the spectral features and allow for a better comparison. The verticaldottedlines annotate the±2500 km s−1window for the Balmer lines and the±1500 km s−1
band for helium lines while the horizontaldottedlines the normalised continuum flux.
8 10 12 14 16
V magnitude
1 2 3 4 5
0 20 40 60 80 100 120
HJD-2454200 20
15 10 5
0 5
EW
(
A)
5 4 3 2 1
0 1
EW
(
[image:5.612.49.260.372.545.2]A)
Figure 1.Time evolution of the equivalent widths of the prin-cipal spectral lines. The July 2004 quiescent epoch is plotted at an arbitrary negative HJD for comparison. In the bottom frame:
solid line for Hβ and dashed line for Hγ. In the middle panel:
solid line for Hei4921˚A, represents the general evolution of the
HeIlines anddashed line for Heii4685˚A. The top panel shows the V magnitude of the outburst, as provided by theaasvowhere the numbers indicate position of the spectra from Figure 2 which are discussed epochs in Section 3.1.
results in positive (ew) values during absorption-dominated epochs and negative values otherwise. For consistency, the window for these lines is ±2500 km s−1 for all epochs, which is limited by the proximity of the helium lines. For the He lines, a slightly narrower window of ±1500 km s−1 gives a consistent and comparableewmeasurement,
avoid-ing neighbouravoid-ing lines. The spectra are locally normalised to avoid any contamination from underlying absorption due to nearby Balmer lines. Both regions are marked in Figure 2 together with the continuum level. The bottom panel in
Figure 1 shows theew evolution for the Balmer lines and the middle panel the same for the helium lines. The actual values for all lines and at all observed epochs are given in Ta-ble 2. We note that the spectral lines display rather complex changes as different components come and go. A single (ew)
value clearly does not fully capture these details. Therefore, to complement the measured (ew), a more detailed
anal-ysis of the separate components within the line profiles is provided below.
2004 July 7 - 1 During deep quiescence, 3 years before outburst, the average spectrum of GW Lib was typical for a CV spectrum with a low accretion rate. The accretion disc has very narrow Balmer emission lines which show a dip in their centres reflecting an underlying double-peaked profile (not visible on the scale of Figure 2). This profile shape is expected for optically thin accretion discs viewed at a low inclination anglei. The Hβprofile is fitted with two Gaussians simultaneously to the absorption trough and the narrow emission line component. The latter gives a fwhm
of 7.82±0.56˚A corresponding to ∼ 482 km s−1 (all er-rors quoted in this paper are 3σerrors). Absorption troughs flank the emission features with afwziof∼20,000 km s−1, and can only originate from the WD as these velocities are too high for Kepler velocities in the accretion disc. This in-dicates a small accretion luminosity and a very low mass transfer rate such that the primary WD is visible. The mea-sured ew of the Balmer lines are dominated by the WD absorption. The Heilines are all in emission. A small, but
significant, amount of Heiiis present in emission with an
ewof−0.34±0.18˚A in the average spectrum. Since the disc and companion star are expected to be too cool during qui-escence to produce much Heiiemission, this line emission
mea-sured in a±300 km s−1window and afwhmof 3.18±0.35˚A. This is likely formed in the photosphere of the WD and such metal lines may be expected in accreting systems were metal-rich gas is deposited onto the WD surface. The deter-mination of the gravitational redshift of such lines could in principle provide a direct measurement of the mass of the WD. However, our resolution prohibits a reliable measure-ment of the velocity of this weak feature as it is blended with the nearby Heiline.
2007 April 15 - 2 Two days after the rise into outburst started, the average spectrum of GW Lib shows broad ab-sorption troughs in the Balmer lines. Given the 9 magnitude increase due to accretion these absorption features can no longer be associated with the WD but suggest an origin in the now optically thick accretion disc, supported by afwhm
of 23.05±0.36˚A. The lines also show strong emission peaks, see spectrum 2 in Figure 2. This is also seen in the Hα
emission profile obtained by Hiroi et al. (2009) around this time. With afwhmof only 3.14±0.66˚A, corresponding to ∼194 km s−1, the peak in Hβhas less than half the width of the emission during quiescence. The Heilines are all in
absorption, with a hint of a very narrow emission peak at the centre, while the Heiiline at 4685˚A is in emission at ew =−0.25±0.19˚A. Finally Fe is marginally detected in absorption. We will revisit the discussion on the origin of these lines in section 3.2.
2007 April 23 - 3 Ten days after the beginning of the outburst, GW Lib slowly started to fade and the spectrum evolved. The strong and narrow emission in the Hβ and Hγ lines decreased in strength, increasing the overall ew
slightly. Theewof the Heilines increases similarly suggest-ing the same narrow emission was indeed present. The accre-tion disc is still visible as an optically thick disc in absorpaccre-tion in the Balmer lines with afwhmof 30.46±0.26˚A. The Heii
emission decreases slightly to anewof−0.32±0.06˚A.
2007 May 12 - 4 A month after outburst, as the system dropped from the outburst plateau (Figure 1) and the lu-minosity decreased rapidly, the spectrum had changed dras-tically, see spectrum 4 in Figure 2. The accretion disc con-tribution to the lines changed from an optically thick flow back into a chiefly optically thin disc, producing shallow double-peaked emission profiles in the Balmer line without the high velocity absorption, leading to a negativeew. The
emission component in Hβ is visible again and now has a
fwhmof 8.59±0.03˚A, close to the value of the pre-outburst emission line. As can be seen in Figure 1, the ews of all lines make a small jump. WZ Sge type DNe often show brief brightenings shortly after their main outburst, referred to as echo-outbursts (Patterson et al. 2002). It remains unclear due to the sparse light curve sampling whether the observed behaviour in the lines is related to similar events.
2007 June 19 The Magellan spectra from June 2007 re-semble thewht July spectra in shape, see top spectrum in
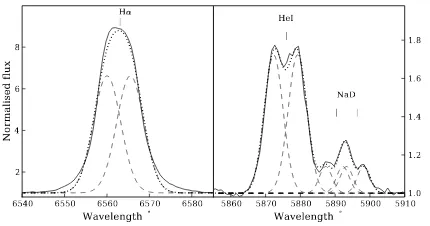
Figure 2 for the average spectrum. In addition, these spectra also cover the Hαand the Hei5876.62˚A line. An interesting
feature next to the strong He iline is the Sodium doublet (Na D 5889.95˚A-5895.92˚A) seen in emission, see Figure 3.
5860 5870 5880 5890 5900 5910
Wavelength A
1.0 1.2 1.4 1.6 1.8
Normalised flux
HeI |
|NaD|
6540 6550 6560 6570 6580
Wavelength A
2 4 6 8
Normalised flux
[image:6.612.318.533.104.217.2]| H
Figure 3.Normalised emission line profiles of Hα(left) and the Hei- Sodium doublet (right). Thesolid line represents in both cases the average profile over 1 orbital period. Thedashed lines are the various Gaussian profiles fits and the dotted line is the sum of all single Gaussians. As is clear from these fits, the Sodium doublet has, most likely, a very similar origin as the Hαand the Heilines.
Due to the close proximity of GW Lib, interstellar absorp-tion is expected to be weak, and indeed no evidence for dif-fuse interstellar band (dib) absorption features can be found in the spectrum. Instead, the doublet is dominated by broad emission components. To strengthen this case, the Sodium doublet is also present in emission at 6154.23˚A-6160.76˚A. In the orbital average spectrum, the feature can be fitted with two double Gaussians (plotted in Figure 3) with the peak separation set to 250 km s−1. The Hα line has the same separation where for the nearby Hei the line separation is 350 km s−1. The offset of the centre of the double-peaked profiles from the rest wavelength for all lines is, within er-rors,−10±5 km s−1. These similar fitting values suggest a shared origin in the accretion flow for all lines. Time-resolved analyses of the Heiand the Balmer lines give similar values
compared to those in the July 2007 epoch (see section 4.2 and Table 4).
2007 July 24 - 5 Three months after outburst, during the slow decline towards quiescence, the system was still 1-2 mags brighter than the pre-outburst magnitude, and the double-peaked profile from the disc proved stronger against the dropping continuum compared to the previous phase (compare spectrum 4 to spectrum 5 in Figure 2). The system has cooled sufficiently such that the WD absorption again flanks the emission lines in the Balmer lines, decreasing the
ew of Hγ. Since both the disc and the WD are expected to be slightly hotter and brighter compared to the pre-outburst quiescence state it does not yet resemble spectrum 1 in Figure 2. For comparison, the WD in WZ Sge was still cooling after 17 months of post-outburst observations, see Long et al. (2004). The Heilines are all in emission and the Heiiemission line has anewof−0.52±0.24˚A. Thefwhm
of the emission component in Hβ is 7.65±0.03˚A and has thus reached the value observed in the pre-outburst epoch even though the emission line flux itself is still much larger.
3.2 Time-resolved spectra
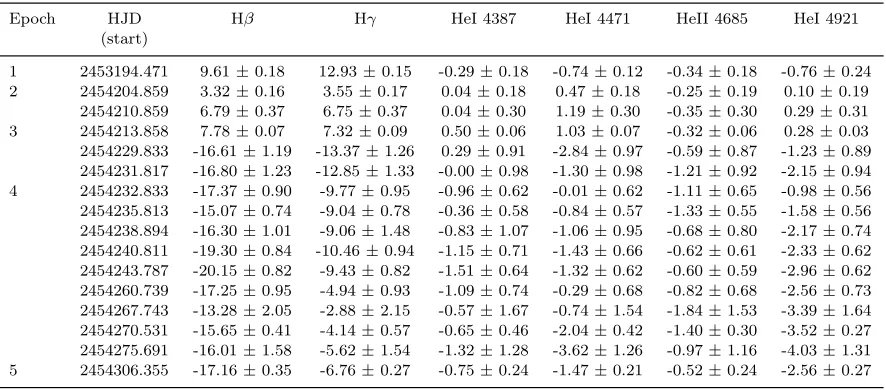
Table 2.Equivalent widths in ˚A ±3σerror, of various emission lines as function of the outburst. The Balmer lines are measured
in a±2500 km s−1 window, where the helium lines are measured in a±1500 km s−1 window
Epoch HJD Hβ Hγ HeI 4387 HeI 4471 HeII 4685 HeI 4921 (start)
1 2453194.471 9.61±0.18 12.93±0.15 -0.29±0.18 -0.74±0.12 -0.34±0.18 -0.76±0.24
2 2454204.859 3.32±0.16 3.55±0.17 0.04±0.18 0.47±0.18 -0.25±0.19 0.10±0.19
2454210.859 6.79±0.37 6.75±0.37 0.04±0.30 1.19±0.30 -0.35±0.30 0.29±0.31
3 2454213.858 7.78±0.07 7.32±0.09 0.50±0.06 1.03±0.07 -0.32±0.06 0.28±0.03
2454229.833 -16.61±1.19 -13.37±1.26 0.29±0.91 -2.84±0.97 -0.59±0.87 -1.23±0.89
2454231.817 -16.80±1.23 -12.85±1.33 -0.00±0.98 -1.30±0.98 -1.21±0.92 -2.15±0.94
4 2454232.833 -17.37±0.90 -9.77±0.95 -0.96±0.62 -0.01±0.62 -1.11±0.65 -0.98±0.56
2454235.813 -15.07±0.74 -9.04±0.78 -0.36±0.58 -0.84±0.57 -1.33±0.55 -1.58±0.56
2454238.894 -16.30±1.01 -9.06±1.48 -0.83±1.07 -1.06±0.95 -0.68±0.80 -2.17±0.74
2454240.811 -19.30±0.84 -10.46±0.94 -1.15±0.71 -1.43±0.66 -0.62±0.61 -2.33±0.62
2454243.787 -20.15±0.82 -9.43±0.82 -1.51±0.64 -1.32±0.62 -0.60±0.59 -2.96±0.62
2454260.739 -17.25±0.95 -4.94±0.93 -1.09±0.74 -0.29±0.68 -0.82±0.68 -2.56±0.73
2454267.743 -13.28±2.05 -2.88±2.15 -0.57±1.67 -0.74±1.54 -1.84±1.53 -3.39±1.64
2454270.531 -15.65±0.41 -4.14±0.57 -0.65±0.46 -2.04±0.42 -1.40±0.30 -3.52±0.27
2454275.691 -16.01±1.58 -5.62±1.54 -1.32±1.28 -3.62±1.26 -0.97±1.16 -4.03±1.31
5 2454306.355 -17.16±0.35 -6.76±0.27 -0.75±0.24 -1.47±0.21 -0.52±0.24 -2.56±0.27
considerable orbital dependence in the Balmer, He i and Heiiline profiles. We binned the spectra in bins of 1/20th
of the orbital period using P = 0.05332 ±0.00002 days (Thorstensen et al. 2002). The Balmer profiles were fitted with a double Gaussian with the peak,fwhmand the offset from the rest wavelength as free parameters. The Hei and
Heiiprofiles are fitted with a single Gaussian. All fits show
that the peak andfwhmof the line components are constant within 10 per cent of their average values and as these par-ticular parameters show no sign of significant orbital depen-dence, they were thus fixed to their mean values for further analysis, keeping their velocity offsets as free parameters. In addition to our profile fits, all results were checked against a traditional double Gaussian analysis (Schneider & Young 1980) in combination with a diagnostic diagram.
The radial velocity curves of our line components were fitted with the functionV(φ) =γ−Ksin(2πφ−2πφ0) and individual velocity data points were weighted according to their errors as derived from the profile fits. These errors were scaled such that the radial velocity curve fit has a goodness of fit close to 1. Hereγis the systemic velocity,Kthe radial velocity semi-amplitude of the absorption and/or emission line andφ0 the phase offset relative to the ephemeris. The ephemeris zero point will be derived later in this paper (sec-tion 4) and is used throughout this paper when calculating orbital phases. Due to the lack of precision in the binary orbital period, the ephemeris cannot be extrapolated very far in time and thus the binary phase is arbitrary except for the July 2007 epoch where the zero-point is measured.
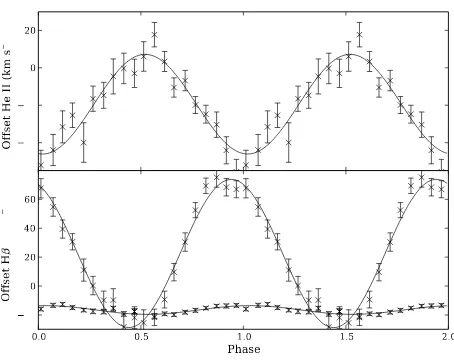
We discuss the results of the fits for the Hβand Heii
profiles using the 2007 April 15 data as this set has the high-est signal to noise, the bhigh-est time resolution and the most fea-tures present for analysis. The behaviour of the lines during the other nearby epochs were the same, albeit determined with lower precision. The results can be found in Figure 4 and Table 3. Both Hβand Hγ have similar amplitude and phase fits. The deep and broad absorption troughs can be identified with the accretion disc. However, they do not trace the WD movement as the velocity semi-amplitude is too
large at 51.3±6.5 km s−1. The radial velocity of the primary WD is likely much smaller. Interestingly, this amplitude is consistent with that of the double-peaked emission profile during quiescence. On 2004 July 6, the velocity curve fit to Hβ emission gives a semi-amplitude of 45.1±7.3 km s−1. This similarity suggests that the distortions in the disc lead-ing to the observed radial velocity curve of both the disc emission during quiescence and the broad disc absorption during outburst are rather similar. Unfortunately, due to the uncertainty in the binary ephemeris, we cannot compare their relative phasing. Similar amplitudes, systemic veloci-ties and phase zeros were found for the Heilines, suggesting that their profiles trace the same components. In contrast, the Heiiline moves in anti-phase and has half the
ampli-tude. This highlights the difficulty with associating either of these radial velocity amplitudes with that of the primary WD.
In both the Hβ and Hγ profile, a second Gaussian is fitted to the narrow emission components in their cores. This component shows a remarkably small velocity amplitude of 3.0±1.6 km s−1 (see Table 3). At this epoch, the arc fit is good to 0.003˚A at the position of Hβwhich is smaller than 1/100th of the 0.38˚A/pixel scale. 1σ errors on individual velocity measurements are much larger (∼0.085 pixels) than this and are thus dominated by the statistical error. These errors are then propagated to provide the formal errors on the fit parameters as listed thus suggesting that this small amplitude is measured to a significant degree.
This strong central emission component is present in those epochs close to the start of the outburst in the Balmer lines and a hint is present in the He ilines. On 2007 April
20 the dynamics of this component is similar to behaviour on April 15. By 2007 April 23 the emission component has faded into the absorption lines, which maintain their radial velocity semi-amplitude throughout. The systemic velocity of this narrow emission component is consistent with that of the Heiiemission, while the broad absorption components
Table 3.Velocity profile parameters on 2007 April 15
Line γ K φ0 Identification
km s−1±
3σ km s−1±
3σ ±3σ
Hβemission −16.6±0.8 3.0±1.6 0.28±0.06 Slingshot/WD?
Hβabsorption 22.5±4.4 51.3±6.5 0.19±0.02 Accretion disc
Hγemission – – – –
Hγabsorption 17.0±4.8 43.6±6.8 0.18±0.02 Accretion disc
Heiiemission −19.4±4.7 26.6±6.8 0.77±0.04 –
0.0 0.5 1.0 1.5 2.0
Phase
20
0 20 40 60
Off
se
t H
(km s
1)
40 20
0 20
Of
fse
t He
II
(km
s
1)
Figure 4.Top panel shows the radial velocity curve of the Heii
emission. The radial velocity curves of the Hβprofile (bottom) are fitted with a low amplitude emission component and a high am-plitude absorption component. Both are from the phase-binned 2007 April 15 data, showing two orbital cycles.
GW Lib is one of the few CVs that have been followed through the outburst spectroscopically. For comparison, the spectral evolution of SS Cyg (figure 5 in Hessman et al. 1984) showed broad, double-peaked emission lines that are gradually being overtaken by the rising continuum, followed by the formation of line wings in absorption. This quali-tative behaviour is expected as the accretion disc makes a rapid change from a low ˙M optically thin configuration to a high ˙M optically thick flow at the onset of the outburst. Near maximum light, SS Cyg shows on top of the absorp-tion from the accreabsorp-tion disc, narrow emission cores which decay again after outburst. These are very similar to the spectral changes presented here for GW Lib, though no dy-namical properties are available to compare the components quantitatively. Unfortunately, the very low binary inclina-tion of GW Lib makes it difficult to study the accreinclina-tion disc dynamics during the main outburst period. The absorption dominated disc lines are unsuitable for Doppler tomogra-phy and we therefore cannot search for disc asymmetries such as the tidal spirals seen in other DNe (e.g. IP Peg: Steegs, Harlaftis & Horne 1997; U Gem: Groot 2001). When disc emission returns, little structure can be detected in its marginally double-peaked lines.
The stationary emission component in the spectra, visi-ble only during the first couple of days of the outburst, does
not obviously fit in with the typical components expected to dominate the line emission in a mass transferring binary system. The low velocity suggests a location near the cen-tre of mass in the orbital plane or along the axis through the centre of mass, perpendicular to the orbital plane. GW Lib is not the first DN to show these features. Several DN systems have been reported to show low amplitude strong emission components in the Balmer lines.
Steeghs et al. (1996) report low velocity emission com-ponents in the Hαand Heii4686˚A lines of the DNe IP Peg and SS Cyg and proposed slingshot prominences from the donor star as a possible origin for these features since their known system parameters rule out an origin near either the WD or the surface of the donor star. The rapidly co-rotating donor star may form prominences and such magnetic loops would be pulled towards the WD and could potentially find an equilibrium in between the L1 point and the WD. As the prominence material is illuminated by the disc during outburst, it becomes visible as an emission source which is co-rotating with the binary orbit but located in the region near the centre of mass and thus displays very little radial velocity. If we follow their recipe, the observed Hβ/He ii
ratio is consistent with a gas temperature in the 10,000 -15,000 K range.
In GW Lib, an alternative origin of the low-velocity emission may be near the surface of the WD, if its orbital velocity (K1) is very small. Low state AM CVn systems often show such narrow emission com-ponents (Morales-Rueda et al. 2003, Roelofs et al. 2006). The low mass ratio derived from the late superhump by Kato, Maehara & Monard (2008) together with the low or-bital inclination would indeed imply a very low value for
K1 in GW Lib. We will revisit these interpretations and the implications for the system parameters in section 5.
4 GW LIB POST OUTBURST
[image:8.612.56.283.239.419.2]absorption lines from the donor. Most studies are con-fined to using the strong Balmer emission lines to try and constrain system parameters (e.g. table 2 in Marsh 2001, Southworth et al. 2007, Neilsen, Steeghs, & Vrtilek 2008, Mennickent, Unda-Sanzana & Tappert 2006, Szkody, Desai & Hoard 2000). The Ca ii triplet at
8498.03˚A, 8542.09˚A and 8662.14˚A1 offers advantages that more than make up for its relative weakness compared to the Balmer lines. It has a lower ionisation energy than either hydrogen and helium and is thus capable of being excited even by cool sources of radiation, and its thermal width and pressure broadening are much smaller than for hydrogen leading to sharper, more easily detected spikes of emission (Marsh & Dhillon 1997). Studies have shown that Ca iiis also more accessible than the Balmer lines for the
study of velocity gradients and turbulence. This is because the thermal velocity broadening is smaller in general and the Keplerian shear broadening starts to dominate at higher inclinations compared to the hydrogen lines (Horne 1995). These studies show a promising, but so far neglected avenue for emission line studies of CVs. The average normalised spectrum of GW Lib in the I-band obtained on 2007 July 24 is plotted in Figure 5 and shows a strong Caiitriplet in emission.
4.1 Emission from the secondary
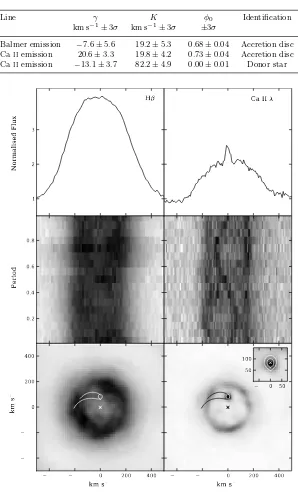
In Figure 6 (middle panels), we compare trailed spectro-grams of Hβ (left) and Caii 8662˚A (right) as obtained 3
months after outburst. Whereas the Balmer line shows a shallow double-peaked profile and a rather blurry trail, the Caiitrail is much sharper even at a lower S/N. It shows a
clear double-peaked profile from the accretion disc and an S-wave moving in between. No such S-wave appears to be present in the Balmer lines.
To highlight this component, we averaged the profiles in a frame co-moving with the S-wave and show these in the top panels of Figure 6. The double-peaked profile from the accretion disc in this frame is averaged out, but the narrow S-wave is clearly visible on top on the broad profile in the Caiicase whereas its absence is noted in the Balmer profile.
The S-wave is sharp and its amplitude is smaller than the velocity offset of the accretion disc peaks, suggesting it may originate from the secondary star rather than from the interaction point between the infalling stream and the accretion disc, the hotspot, since the latter would have a velocity equal to or larger than the outer disc edge.
Assuming the emission does indeed arise from the sur-face of the donor star, the ephemeris can be determined as the crossing from blue-to-red of its velocity curve, which corresponds to inferior conjunction. This gives:
HJD = 2454307.36867 + 0.05332E
This is used throughout the paper to define the orbital phase although the accuracy of the orbital period is not enough to give the outburst data discussed in Section 3 a definite orbital phase since the accumulated uncertainty is too large (Figure 7).
1 From The Atomic Line List Version 2.04: http:/www.pa.uky.edu/~peter/atomic/
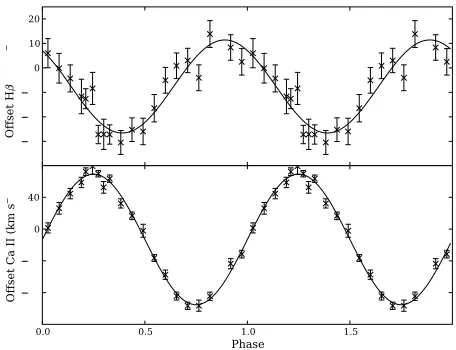
The radial velocity semi-amplitude of the emission is determined using two different methods. The first method is the fitting of a Gaussian to the S-wave line component followed by a radial velocity curve fit. The second method is the localisation of the emission peak in the velocity-velocity plane using Doppler tomography.
For the first method, the spectra are phase-binned and a triple Gaussian profile with as variables the offsets, the peak heights and thefwhms of the profiles is fitted where two Gaussians trace the disc features and the third is for the donor S-wave. Both the peak height and the fwhm show a chaotic variability with a maximum amplitude of 8 per cent from the average value and were therefore fixed to their mean values, leaving just the velocity offset as fit parameter. The offset velocity for the S-wave emission is plotted in Fig-ure 7 together with a weighted radial velocity curve fit. For improved accuracy in the Caiitriplet, we performed a joint
fit to the 3 triplet lines with a common velocity offset. We then find a semi-amplitude ofKCaii = 82.2±4.9 km s
−1
for the S-wave in the Caiiprofiles, see also Table 4. To complement our radial velocity fits, Doppler maps are created with a Maximum Entropy Method (mem; Marsh
2001) for both the Balmer and the Ca ii8662˚A lines, see bottom panels in Figure 6 formemmap of the time-resolved
spectra on 2007 June 24. Given the fact that the lines from the Paschen series overlap with the Caiitriplet lines, we
al-ways ensured that the Doppler reconstructions fitted to both lines simultaneously. The underlying Paschen line distribu-tion is rather featureless, and the sharp S-wave component is only present in the Caiireconstructions. Even if such a Paschen contribution is not included, the Caiitomograms
show very similar features.
The Balmer map (bottom left panel) shows a diffuse ring of emission from the accretion disc. Due to the sharper line profile, the Caiimap (bottom left panel) shows a much
better defined accretion disc ring with a significant asymme-try at phases∼0.10,∼0.35 and ∼0.70. Furthermore, the S-wave component manifests itself as a sharp emission spot peaking at a velocity of∼85±5 km s−1. Its location relative to the disc ring is as expected for donor emission and thus the CaII S-wave is revealing the secondary in GW Lib for the first time.
4.2 Emission from the accretion disc
With the outburst activity decaying away, the disc contri-bution to the overall luminosity decreases and significant regions that are optically thin start to re-appear. These give rise to the characteristic double-peaked profile visi-ble in both the Balmer lines and the Ca ii lines. A sin-gle broad Gaussian profile fit to this feature in the phase-binned spectra together with a weighted radial velocity fit for both the Ca ii and Balmer profiles at multiple nights gives an average value for the amplitude of the disc of
Kacc = 19.2±5.3 km s−1, see Table 4. Similar results are obtained using multiple Gaussian line fits and diagnostic diagrams with double Gaussians. This amplitude is signifi-cantly different from the amplitude of disc related features in the April 2007 and July 2004 data. The phase shift of both Caiiand the Balmer disc coincide but are not in anti-phase
with the donor star with respectivelyφ= 0.68±0.04 and
Table 4.Velocity profile parameters on 2007 June 25
Line γ K φ0 Identification
km s−1±
3σ km s−1±
3σ ±3σ
Balmer emission −7.6±5.6 19.2±5.3 0.68±0.04 Accretion disc
Caiiemission 20.6±3.3 19.8±4.2 0.73±0.04 Accretion disc
Caiiemission −13.1±3.7 82.2±4.9 0.00±0.01 Donor star
400 200 0 200 400
km s
1 400200 0 200 400
km
s
1
400 200 0 200 400
km s
150 0 50 50
100 0.2
0.4 0.6 0.8
Period
1 2 3
Normalised Flux
H
Ca II
8662
Figure 6.Comparison of the dynamics of the Balmer lines (Hβ, left column) versus Caii(8662˚A, right column).
The top row show average profiles in the reference frame of the donor star S-wave. The sharp donor component stands out in Caii but the Hβ profile is smooth. The middle row shows the phase-binned trailed spectrograms.
The S-wave can be traced in between the disc peaks in Caiionly. The bottom row plots the Doppler tomograms
showing the superior sensitivity and sharpness in the Caiilines. The S-wave is mapped to a sharp spot consistent
with donor star emission. Overlaying the Doppler tomograms are the positions of the WD, the Roche Lobe of the donor star and the streams for a model withq= 0.062. The inset in the CaIIDoppler map shows the Roche Lobe
8400 8450 8500 8550 8600 8650 8700 8750
Wavelength A
1.0 1.5 2.0 2.5
Flux
Ca II Ca II Ca II
Pa12
Pa13
Pa14
Pa15
Pa16
Pa17
Pa18
[image:11.612.61.281.117.294.2]Pa19
Figure 5.The average normalised I-band spectrum of GW Lib on July 24, 2007 showing the Paschen series and the double-peaked Caiilines.
0.0 0.5 1.0 1.5
Phase
80 40
0 40
Of
fse
t Ca
II
(km
s
1)
30 20 10
0 10 20
Of
fse
t H
(km s
1)
Figure 7.Top panel shows the radial velocity curve of the Hβ
emission. The bottom panel shows rotational velocity curve from the Caii8662˚A S-wave emission component. Both are from the
phase-binned 2007 June 24 data, showing two orbital cycles.
the radial velocity amplitude is disturbed by some residual disc asymmetry and cannot be straightforwardly connected toK1.
The accretion disc in the Doppler maps of Hβappears rather featureless with little azimuthal structure, while the Ca iitrail and memmap show lower intensity in the disc around phases ∼ 0.10, ∼ 0.35 and ∼ 0.70. The centre of emission of the discs for both maps was determined by look-ing at their centre of symmetry. To determine the optimal centre of symmetry of the disc, we subtracted a symmet-rical component from both the Ca iiand the Hβ Doppler
map centred atVx,Vy in the ranges of -100 – +50 km s
−1
making grid steps of 2 km s−1
and inspected the residuals in the lower half of the map (see also Steeghs & Casares 2002). The best fits are found forVx= 0.0±5.0 km s
−1 and
Vy=−6.0±5.0 km s
−1 for the Caiimap. The fits for the Hβgive identical values but with a larger error. The lowVx
is encouraging from the point of view of linking the disc cen-tre with the WD at (0,−K1). The impliedKdisc=−Vy= 6 km s−1is smaller than the semi-amplitude derived using the Gaussian fits. On the other hand they are formally consis-tent when considering our error estimates, and both point to a smallK1.
4.3 Systemic velocity
The binary systemic velocity (γ) is a quantity that should obviously be the same in all spectral lines, reflecting the fixed radial velocity of the binary system with respect to us. For different lines at different epochs, the systemic velocity was determined using two methods.
The first method determines the systemic velocity as derived from the radial velocity curve discussed previously, see Tables 3 and 4. For the Balmer lines associated with the accretion disc γ = −26±6.7 km s−1 before outburst, during outburstγ = 22.5±4.4 km s−1 and after outburst
γ = −7.3±3.6 km s−1. The narrow Hβ emission during outburst hasγ=−16.6±0.8 km s−1. For our Caiiprofiles, we foundγ= 20.6±3.3 km s−1 for the disc emission and
γ = −13.1±3.7 km s−1 for the donor star emission line. The latter is the most reliable value forγas the donor star has to move with the systemic velocity.
The alternative method uses the dependence of mem
maps on the assumed systemic velocity. Reconstructed emis-sion spots in the map have optimal sharpness at the correct value for γ, while reconstructions at significantly different values will broaden the features and introduce possible arte-facts. Ranging γ between -50 – +20 km s−1 in steps of 5 km s−1gives the best reconstruction forγ=−15±5 km s−1. Our various estimates therefore point towards a γ of −15±5 km s−1, in agreement with the measurements by Szkody, Desai & Hoard (2000). The only outliers are the Balmer absorption line during outburst with a systemic ve-locity fit of 22.5±4.4 km s−1 and the Ca iiemission asso-ciated with the accretion disc with γ = 20.6±3.3km s−1. However, those fits are distorted as the resolution is not suf-ficient to properly resolve the donor star S-wave and the disc emission peaks near phases 0.25 and 0.75. Subtraction of the S-wave changes and fitting the disc emission with a two-Gaussian profile with an fixed offset between the Gaus-sians gives a lower value ofγ= 7±2 km s−1.
5 SYSTEM PARAMETERS
In the previous section we have seen the superior sensitiv-ity of the Caiiemission lines over the commonly observed Balmer lines. Not only do they provide a much sharper view on the accretion disc emission, the key result was the pres-ence of an emission spot from the donor star. This has pro-vided the first ever proxy for its orbital velocity.
Post-outburst radial velocity curves together with Doppler maps have given us estimates of the semi-amplitudes for the different components in the binary sys-tem. From both the Balmer and Ca ii double-peaks, the
[image:11.612.54.282.370.545.2]disc asymmetries and the donor star S-wave. The observed phase-shift between the disc peaks and the donor does in-deed suggest such a bias to be present, while the centre of symmetry searches returned lower K1 estimates. We there-fore considerKaccfrom the disc peaks as an upper limit on the radial velocity of the WD:K1< Kacc.
The donor star is detected in the Ca iiemission as a
third peak on top of the accretion disc emission and gives
Kem= 82.2±4.9 km s−1. Considering the faintness of the low mass donor star, this is unlikely to be powered by chro-mospheric emission. In any case, the Caiitriplet in
chromo-spherically active stars is generally seen in absorption (e.g. Kafka & Honeycutt 2006) and thus cannot explain the emis-sion seen in GW Lib. A more likely origin is photo-ionisation in the irradiated hemisphere of the donor star facing the WD. The measured radial velocity semi-amplitude is then an underestimate of the true orbital velocity of the donor star (K2> Kem) since not all of the Roche lobe contributes. We calculated the magnitude of this bias, referred to as the K-correction, by simulating the expected emission profiles from an irradiated Roche lobe filling star. Synthetic pro-files were calculated for relevant binary parameters includ-ing possible shieldinclud-ing of the equatorial regions of the donor by a vertically extended accretion disc.
The peak intensity of the donor star S-wave does not vary significantly as a function of the orbital phase, and in-stead scatters around a mean value with an RMS of 8 per cent, which is consistent with photon noise. The model pro-files discussed above were also used to generate expected orbital light curves of the donor star emission as a function of binary parameters. Model light curves, assuming that the emission is optically thick and thus should be weighted with the projected area, produce orbital modulations above what is observed. However, if we consider more isotropic emis-sion, the modulation disappears at low orbital inclinations. This optically thin model is more appropriate for emission stimulated by photo-ionisation and thus the observed lack of variability is consistent with an irradiated secondary ob-served at low inclinations.
We can now derive conservative limits on the radial ve-locities of the stellar components in the system using vari-ous methods and spectral lines. They can be summarised as
K2>82.2±4.9 km s−1 andK1<19.2±5.3 km s−1. These limits translate into a hard upper limit for the mass ratio of
q <0.23 regardless of the magnitude of the K-correction or theK1overestimate.
After the April 2007 outburst, two detections of super-humps have been reported. Copperwheat et al. (2009) de-tect a periodicity with a period excess of 4.12 min which im-plies a mass ratio ofq≃0.211 if interpreted as a superhump and the empirical superhump-excess mass ratio relation from Patterson et al. (2005) is applied. This is close to our hard upper limit for the mass ratio. However, the authors them-selves question the character of the humps and the implied donor stars mass in combination with the WD mass from seismology. On the other hand, Kato, Maehara & Monard (2008) report a superhump period of 0.053925(4) days and a late superhump period of 0.054156(1) days which imply an extreme mass-ratio ofq= 0.062.
We looked at a simple model for the relation between
[image:12.612.306.461.173.276.2]M2,K1 andK2as function ofqfor a range ofM1. Combin-ing this with the above upper and lower limits for the radial
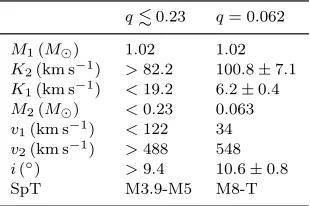
Table 5.Derived system parameters for GW Lib usingM1 from
Townsley et al. (2004). The left hand column lists the binary pa-rameters derived from the formal solution based on the measured limits forK1 and K2. The right hand column lists the
param-eters when combining the mass ratio inferred from superhumps with the calculatedK2 from the CaiiKem.
q.0.23 q= 0.062
M1(M⊙) 1.02 1.02
K2(km s−1) >82.2 100.8±7.1
K1(km s−1) <19.2 6.2±0.4
M2(M⊙) <0.23 0.063
v1(km s−1) <122 34
v2(km s−1) >488 548
i(◦) >9.4 10.6±0.8
SpT M3.9-M5 M8-T
velocities of respectively the WD and donor star rules out systems withM1<0.75M⊙. As the system is tidally locked,
the rotation period of the secondary is equal to the rotation period of the system. Emission lines are broadened by the rotation of the secondary star where the surface velocity can be approximated by looking at the co-rotating Roche Lobe surface. Comparing the measuredfwhmof the emission line
to the theoretical value as a function of the mass ratio can provide another limit onqandM1. The observedfwhmof
Caiiline emission peak in each bin ranges between 1.0 and
2.2˚A due to contamination with the double-peaked profile. Thefwhmis very close to the resolution of the data, 0.617˚A,
which equates to avsiniof 21 km s−1. The profile is thus at best marginally resolved. From the upper limits for the mass ratio and the constraints given by the measured emission line broadening we get a rough estimate of the WD mass at 1.0M⊙±0.25, in agreement with the mass determination by
Townsley et al. (2004). Note that their window of solutions is constrained by the UV-flux of the WD in combination with the measured distance to GW Lib. For a parallax dis-tance of 104+30
−20pc (from Thorstensen 2003) they calculate
M1 = 1.03−1.36M⊙, superseding the previous estimates
by Szkody et al. (2002) and Thorstensen et al. (2002) that were based on a larger distance. For further analysis we will use the asteroseismologicaly suggested mass forM1.
When considering the empirical CV donor sequence of Knigge (2006) at the orbital period of GW Lib, we find a typical pre/post period bounce secondary star mass ofM2 = 0.064±0.001M⊙orM2= 0.060±0.001M⊙, respectively. The small difference is due to the orbital period being very close to the bounce period. Knigge also calculates the expected absolute magnitudes for GW Lib in the infrared bands using its parallax distance, which implies a low mass secondary star of 0.080±0.005M⊙.
5.1 Formal solution: q.0.23
fwhmof WZ Sge and foundi∼11◦. This is in agreement with our calculations in combination with the nominal solu-tion forM1 = 1.02M⊙and confirms that GW Lib is indeed
observed at very low inclination.
Forq <0.23, the correction forK2, as derived from our models, is at most ∆Kmax= 35 km s−1 giving a maximum value forK2 of 118±5 km s−1.
The main problem with a high value forqnear our limit is that the secondary would then need to be aM2∼0.23M⊙
mass star with a spectral type around M4-M5 (Cox 2000). In that case, spectral features should be visible in a high resolution, high signal to noise red spectrum. We cannot identify any of such in our post-outburst I-band spectra nor in the pre-outburst Magellan data. Additional issues are the observed IR magnitudes of GW Lib which imply a faint donor and a main-sequence object near 0.23M⊙would not
fit within the Roche-lobe. All adding to the conclusion that the mass-ratio in GW Lib is likely not near this maximum value.
5.2 Superhump solution:q= 0.062
Measuring the late superhumps in GW Lib, Kato, Maehara & Monard (2008) found an extreme mass ratio for the system ofq = 0.062. Which, when com-bined with the WD mass from seismology and the empirical donor star mass from the Knigge (2006) sequence, proves an attractive solution within the boundaries of the formal scenario. We calculated the magnitude of the K-correction at this mass ratio using our irradiated secondary model. In order to produce the observed Kem = 82.2±4.9 km s−1, we find a true K2 = 100.8±7.1 km s−1 where the error is calculated by propagating the error on Kem. This error dominates over effects such as the assumed level of equatorial shielding or the optical thickness of the emission. The implied system parameters based on this assumed q
and calculatedK2 can be found in the left hand column of Table 5.
The small mass ratio scenario would correspond to a low mass donor with a M8 (Cox 2000) or T spectral type (Knigge 2006) if the donor is close to its main-sequence configuration. This would agree with the infrared magnitude constraints mentioned previously and fits perfectly with GW Lib being close to the period minimum.
Interestingly, the derivedK1in this scenario is close to the measured radial velocity of the narrow Balmer emission component in outburst (K = 3.0±1.6 km s−1) suggesting that this component may trace the WD when irradiated by the accretion disc. Similar sharp emission components from the WD are seen in AM CVn systems (Morales-Rueda et al. 2003, Roelofs et al. 2006). However, a component arising at the surface of a WD is expected to be gravitationally red-shifted but the systemic velocity for this lines component was −16.6±0.8 km s−1 which is similar to the systemic velocity of the system and cannot be biased by the Stark effect as is the case in AM CVn systems. Unfortunately the emission is only a transient feature and the constraint on its K will be difficult to improve upon. The origin of the component and its possible connection with the WD thus remains unclear.
6 DISCUSSION
We presented time-resolved optical spectroscopy of GW lib during a large number of epochs spanning before, through-out and after the 2007 through-outburst. We studied the long-term evolution of the spectral features tracking large changes in the accretion geometry and intensity.
Pre-outburst spectroscopy obtained in 2004 data show clear features of the accreting WD including a detection of Mgiiabsorption. Here, the low inclination of GW Lib has the advantage over high inclination system as it gives narrow disc emission lines instead of wide profiles, potentially re-solving the line from the nearby Heiline. Higher resolution,
high signal to noise spectra around this line in quiescence could provide a dynamical trace of the accreting WD and give a directly measured mass constraint to complement the constraints indirectly obtained from seismology.
During the outburst, we initially see the optically thick accretion disc dominate through broad absorption features. Their radial velocity does not trace the WD and show semi-amplitudes of order 50 km/s. A peculiar sharp emission line component was found in the Balmer lines that is effectively stationary. This could be some low velocity outflow in the z-direction or a component near the WD, but its mean veloc-ity is similar toγwhereas a layer near the high gravity WD should be gravitationally red-shifted. As the system fades back towards quiescence, accretion powered double-peaked emission profiles appear. The absorption associated with the accretion disc continues to weaken until the system returns to a semi-quiescent state with strong double-peaked emis-sion lines.
The Ca ii triplet in GW Lib shows that these much neglected lines of CV spectra could be an interesting win-dow to search for signs of both donor stars and accretion disc structures even in cases where the Balmer lines show no signs of the donor star whatsoever and the disc itself is barely resolved. GW Lib is a particularly challenging object in that sense due its very low inclination and thus small projected velocities. The Caiitriplet in emission could be resolved into several components and the secondary star was discovered in emission moving in between the sharp double-peaked emission from the accretion disc. Doppler tomogra-phy and radial velocity profiles fits of the Ca iilines
pro-vide a semi-amplitude ofKem= 82.2±4.9 km s−1 for this donor star feature and indicates a disc centre of symmetry atKdisc= 6±5 km s−1. The disc is also visible in the Hβ maps but with less detail and sharpness and no donor star contribution is seen. Contrasting these lines highlights the diagnostic advantages provided by the Caiitriplet.
Based on previous studies together with the limits on
K1andK2provided in this work, the allowed range of binary parameters were explored. While our dynamical limits place a hard upper limit on the binary mass ratio of q < 0.23, we favour a significantly lower value. A mass ratio nearq∼ 0.06 is in accordance with estimates based on the detected super-hump modulations, the constraints on the faintness, and thus mass, of the donor star and the indications that
K1 is very small. Given such a mass ratio, our measured
WD mass near the value suggested by the pulsations and a low mass donor near the empirical sequence of an evolved CV near the period bounce appears to be consistent with the observational constraints to date.
Whether the spectral features observed several months after the tail end of the 2007 outburst are persistent remains to be established. As the WD continues to cool, donor star irradiation may be less effective in exciting the strong Caii
lines we observed. Nonetheless, high resolution spectroscopy resolving these lines at good S/N levels appears to be a vi-able tool to expand our knowledge of the binary parameters of short period cataclysmic variables and their faint donor stars.
ACKNOWLEDGMENTS
We acknowledge with thanks the variable star observa-tions from the AAVSO International Database contributed by observers worldwide and used in this research. DS ac-knowledges a STFC Advanced Fellowship. We thank Perry Berlind and Mike Calkins for their assistance with obtaining the FWLO/FAST target of opportunity spectroscopy. The WHT is operated on the island of La Palma by the Isaac Newton Group in the Spanish Observatorio del Roque de los Muchachos of the Instituto de Astrofisica de Canarias. This paper includes data gathered with the 6.5 meter Magel-lan Telescopes located at Las Campanas Observatory, Chile operated by the Carnegie Institution of Washington and the 1.6 meter Tillinghast Telescope located at the Fred Lawrence Whipple Observatory operated by the Smithsonian Astro-physical Observatory.
REFERENCES
Araujo-Betancor S., G¨ansicke B.T., Hagen H.-J. et al., 2005, A&A, 430, 629A
Bigelow B. C., Dressler A., 2003, Proc. SPIE, 4841, 1727 Cox A.N., 2000, Allen’s Astrophysical Quantities,
Springer-Verlag New York Inc., 4Rev Ed edition
Copperwheat C.M., Marsh T.R., Dhillon V.S. et al., 2009, MNRAS, 393, 157
Duerbeck H.W. & Seitter W.C., 1987, AP &SS, 131, 467 Fabricant D.G., Cheimets P., Caldwell N., Geary J., PASP,
1998, 110, 79
Gonz´alez L.E. & Maza J., 1983, IAU Circ, 3854
G¨ansicke B.T., Dillon M., Southworth J. et al., 2009, MN-RAS, 2009arXiv0905.3476G
Groot P., 2001, ApJ, 551, 89
Hessman F.V., Robinson E.L., Nather R. E., Zhang, E.-H., 1984, ApJ, 286, 747
Hiroi, K., Nogami, D., Ueda Y. et al., 2009, PASJ, 2009arXiv0904.3425H
Horne K., 1986, PASP, 98. 609 Horne K., 1995, A&A, 297, 273
Kafka, S., Honeycutt, R.K., 2006, AJ, 132, 1517
Kato T., Maehara H. & Monard B., 2008, PASJ, 60, 23K Knigge C., 2006, MNRAS, 374, 484
Kolb, U., Ritter, H., 1992, A&A, 254, 213
Littlefair S.P., Dhillon V.S., Marsh T.R., G ¨ansicke B.T., Southworth J., Watson C.A., 2006. Sci, 314, 1578
Littlefair S.P., Dhillon V.S., Marsh T.R., G ¨ansicke B.T., Southworth, J., Baraffe I., Watson, C.A., Copperwheat C., 2008, MNRAS, 388, 1582
Long, K.S., Sion E.M., G¨ansicke B.T., Szkody P., 2004, ApJ, 602, 948
North R.C., Marsh T.R., Kolb U., Dhillon V.S., Moran C.K.J., 2002, MNRAS, 337, 1215
Marsh T.R., 1989, PASP, 101, 1032
Marsh T.R., 2001, Astrotomography, Indirect Imag-ing Methods in Observational Astronomy, LNP 573, 1, Springer-Verslag Berlin, Edited by H.M.J Boffin, D. Steegs, J. Cuypers
Marsh T.R., Dhillon V.S., 1997, MNRAS, 292, 385 Mennickent, R. E., Unda-Sanzana, E., Tappert, C., 2006,
A&A, 451, 613
Morales-Rueda L., Marsh T.R., Steeghs D., Unda-Sanzana E., Wood J.H., North R.C., 2003, A&A, 405, 249 Neilsen, J., Steeghs, D., Vrtilek, S. D., 2008, MNRAS, 384,
849
Osterbrock D.E., Ferland G.J., 2006, Astrophysics of Gaseous Nebulae and Active Galactic Nuclei, second edi-tion, University Science Books, Causalito, California 1982, AJ, 254, 616
Rappaport, S.A., Verbunt, F., & Joss, P.C., 1983, ApJ, 275, 713
Patterson, J., Fenton W.H., Thorstensen J.R. et al., 2002, PASP, 114, 721P
Patterson, J., Kemp J., Harvey D.A. et al., 2005, PASP, 117, 1204
Ritter H., Kolb U. 2003, A&A, 404, 301 (update RK-cat7.11, 2009)
Roelofs G.H.A., Groot P.J., Nelemans G., Marsh T.R., Steeghs D., 2006, MNRAS, 371, 1231
Schneider D.P. & Young P., 1980, ApJ, 238, 946
Steeghs D., Horne K., Marsh T.R., Donati J.F., 1996, MN-RAS, 281, 626
Steeghs, D., Harlaftis E.T. & Horne, K., 1997, MNRAS, 290
Steeghs D. & Casares J., 2002, ApJ, 568, 273
Southworth, J., Marsh T.R., G¨ansicke B.T., Aungwerojwit A., Hakala P., de Martino D., Lehto H., 2007, MNRAS, 382, 1145
Szkody P., Desai V., Hoard D.W., 2000, AJ, 119, 365 Szkody P., G¨ansicke B.T., Howell S.B., Sion E.M., ApJ,
2002, 575, L79
Thortensen J.R., Patterson J., Kemp J., Vennes S., 2002, PASP, 114, 1108
Thortensen J.R, 2003, AJ, 126, 3017 Tokarz S.P., Roll J., 1997, ASPC, 125, 140
Townsley D.M., Arras P., Bildsten L., 2004, AJ, 609, 105 Templeton M. R., 2007, AAN, 349, 1T
Wade R.A. & Horne K., 1988, ApJ, 324, 411
Warner B., 1995, Cataclysmic Variable Stars. Cambridge Astrophysics Series. Cambridge Univ. Press, Cambridge van Zyl L., Warner B., O’Donoghue D., Sullivan D.,
Pritchard J., Kemp J., 2000, Baltic Astr., 9, 231