Advanced geometry modelling of 3D woven reinforcements in polymer composites: processing and performance analysis
10
0
0
Full text
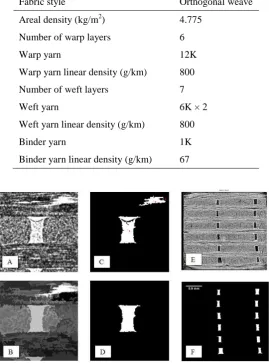
(2) Table 1. Specifications of 3D reinforcement characterised here. Fabric style. Orthogonal weave 2. Areal density (kg/m ). 4.775. Number of warp layers. 6. Warp yarn. 12K. Warp yarn linear density (g/km). 800. Number of weft layers. 7. Weft yarn. 6K × 2. Weft yarn linear density (g/km). 800. Binder yarn. 1K. Binder yarn linear density (g/km). 67. Figure 1. Image segmentation of flow channel in 3D carbon fibre reinforcement. A-D: progressive image operations to isolate flow channel region; E: labelled flow channels in original -CT image; F: binary image of flow channels. The measurements include geometrical parameters such as the area (Ac), the centroid (X) and the height (h) of flow channels in a cross-section. The yarn spacing (l) is the distance between the centroids of two neighbouring channels ( ). Given the filament radius (r) and the number of filaments (N) in each yarn, the fibre volume fraction of each yarn crosssection can be calculated according to Equation (1). (1) To measure flow channels in weft and warp directions, the 3D images are re-sliced and analysed in each direction. Summary data for composites with two different fibre volume fractions are listed in Table 2.. 2.
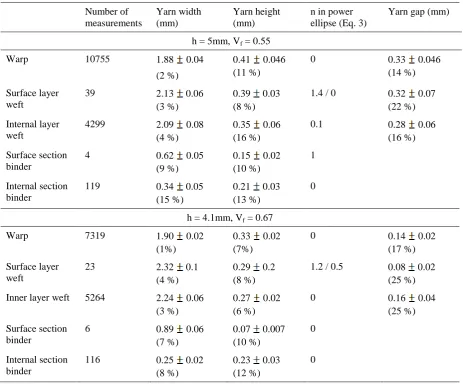
(3) Table 2. Geometry measurements for the orthogonal reinforcement at different compression levels. Number of measurements. Yarn width (mm). Yarn height (mm). n in power ellipse (Eq. 3). Yarn gap (mm). 0. (2 %). 0.41 0.046 (11 %). 0.33 0.046 (14 %). h = 5mm, Vf = 0.55 Warp. 10755. 1.88. 0.04. Surface layer weft. 39. 2.13 0.06 (3 %). 0.39 0.03 (8 %). 1.4 / 0. 0.32 0.07 (22 %). Internal layer weft. 4299. 2.09 0.08 (4 %). 0.35 0.06 (16 %). 0.1. 0.28 0.06 (16 %). Surface section binder. 4. 0.62 0.05 (9 %). 0.15 0.02 (10 %). 1. Internal section binder. 119. 0.34 0.05 (15 %). 0.21 0.03 (13 %). 0. h = 4.1mm, Vf = 0.67 Warp. 7319. 1.90 (1%). 0. 0.14 0.02 (17 %). Surface layer weft. 23. 2.32 0.1 (4 %). 0.29 0.2 (8 %). 1.2 / 0.5. 0.08 0.02 (25 %). Inner layer weft. 5264. 2.24 0.06 (3 %). 0.27 0.02 (6 %). 0. 0.16 0.04 (25 %). Surface section binder. 6. 0.89 0.06 (7 %). 0.07 0.007 (10 %). 0. Internal section binder. 116. 0.25 0.02 (8 %). 0.23 0.03 (12 %). 0. 0.02. 0.33 (7%). 0.02. 3. Geometrical modelling In order to simplify and automate the generation of 3D textile models based on geometrical parameters, a 3D wizard has been implemented in TexGen [2], the textile geometry modelling software developed at Nottingham University. Weave pattern generation is customised for orthogonal, angle interlock, offset angle interlock and layer-to-layer weaves. A series of dialogs allow number of warp and weft yarns to be entered, as well as the number of layers of each and the ratio of binder to warp yarns. The width, height, spacing and cross-sectional shape can be specified for each set of yarns. The yarn cross-sections are approximated by power ellipses (Eqs. 2 and 3), which are generalized ellipses where the y coordinate is assigned a power n to make the section resemble a rectangle with rounded edges when n < 1 or a shape similar to a lenticular cross-section when n > 1. They are special cases of superellipse described by Gabriel Lamé [3]. C (v ) x . w cos(2v) 2. h n 2 sin ( 2v ) C (v ) y h ( sin(2v )) n 2. 0 v 1. if. 0 v 0.5. if. 0.5 v 1. (2). (3). 3.
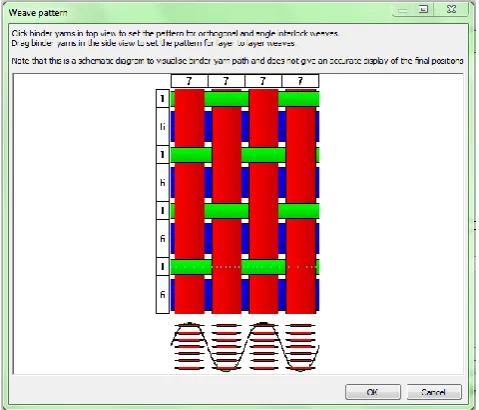
(4) Where w is yarn width and h is yarn height. The subsequent weave pattern dialog allows for simple specification of the required weave pattern. In the case of the orthogonal weave, clicking on the binder/weft intersections toggles the binder between the top and bottom position on the textile as shown in Figure 2. The weave wizard then automatically generates the weave pattern, generating nodes on the yarn paths at each crossover point between warp/binder and weft yarns. Extra nodes are then positioned along the binder yarns to follow the contour of the outer weft yarns. At this stage, the geometry created is idealised with all yarns having constant cross sections. With no refinement yet applied, there are intersections between the warp and weft yarns and the through thickness binder yarns. On examination of the µ-CT images it is also apparent that, even in the uncompacted fabric, the cross-sections of the outer weft yarns differ from those in the middle of the fabric. A refine option has, therefore, been implemented for the case of orthogonal weaves in order to model the geometry more realistically both in their uncompacted and compacted states. Throughout the process the volume fraction of the yarns are monitored so that they are maintained within realistic limits. To facilitate this, yarn properties are required as input for the warp, weft and binder yarns.. Figure 2. TexGen 3D Wizard: Orthogonal weave pattern dialog. Firstly the cross-sections of the through thickness binder yarns are changed, if necessary, to fit into the available through thickness spaces between warp and weft yarns. Next the heights of the warp and weft middle layers are adapted to model compaction on mould closure. An initial check of the space available will show whether it is possible to achieve a volume fraction for the yarn below the maximum specified. If not then TexGen will flag an error stating that the thickness requested cannot be achieved without exceeding the maximum volume fraction. It has been observed that the height of these yarns reduces in proportion to the total initial thickness of warp and weft layers. The height of the yarns is reduced accordingly and then the width increased so as to maintain the original volume fraction. If this cannot be achieved then the power of the power ellipse section used is increased, thus increasing the area, potentially to a rectangular section filling the space available. The cross-sections of the outer weft yarns are then changed to give a section which more accurately represents the real textile, at the same time reducing the height to reflect the requested compaction. Where necessary the height is reduced further to allow for the, similarly reduced, thickness of the binder yarn which is incorporated into the height available for the weft yarn. 4.
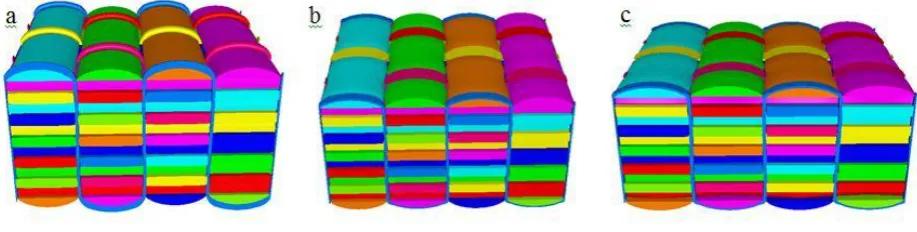
(5) Finally the outer binder yarn cross-sections are changed to give a section which is flat on the outer surface. The widths of the binder yarns are increased as necessary to maintain the volume fraction. If the required height cannot be achieved then, if possible, the height of the weft yarn is reduced further. Failing this, crimp is introduced into the weft yarn to achieve the overall textile thickness and the cross-section of the warp yarn below is adjusted to remove resultant intersections in the yarns. Figure 3a shows the orthogonal weave with the refine option selected but no change to the initial fabric thickness of 6.315 mm. The refinement here is limited to the binder yarns, which are adjusted through thickness, and the outer weft yarns. Figures 3b and 3c show the fabric compacted to thicknesses of 5.03 mm and 4.432 mm. Figure 3c shows the addition of a small amount of crimp in the outer weft yarn, necessary to achieve this degree of compaction. Comparison with the µ-CT images shows that, based on the assumptions mentioned above, TexGen is capable of modelling the geometry realistically down to a fabric thickness of 5.03 mm (Vf = 55 %). At a higher compaction level (thickness 4.432 mm), deviations between the TexGen model and the real geometry occur, noticeably in surface yarn cross-sections. Manual modification is required in this case.. Figure 3. Orthogonal weave generated using 3DWizard refine option. (a) original fabric thickness, 6.315 mm; (b) fabric thickness 5.03 mm; (c) fabric thickness 4.432 mm. 4. Flow modelling To determine the textile permeability, which affects impregnating resin flow in composites processing, flow though the textile unit cell was simulated using Computational Fluid Dynamics (CFD) software. The yarns in the unit cell were modelled as porous media. The yarn permeability as input parameter was calculated using Gebart’s analytical model [4]. At the interfaces between the porous yarns and the inter-yarn flow channels, conservation of fluid mass and momentum was assumed. Periodic boundary conditions were set on opposite faces of the textile unit cell both in weft and warp directions. Non-slip walls are specified for top and bottom faces to simulate the boundary conditions during the in-plane permeability test [5]. A pressure drop is applied on opposite faces of the unit cell. Dry air at 25 oC under atmospheric pressure was selected as fluid for simulation of steady state laminar flow through the fabric. A voxel mesh was chosen for the current study as it is robust and generated automatically. Properties of either the flow channel domain or yarn volume were attributed to the voxel elements. The mesh is directly exported from TexGen to ANSYS® CFX 12.0. The in-plane permeability in warp and weft direction as well as the through-thickness permeability was calculated based on Darcy’s law from the average pressure drop and flow rate obtained from the CFD simulation. 5. Mechanical analysis The composites are modelled with two constituents, the isotropic elastic matrix and the transversely isotropic resin/fibre tow. The resin system used in the composites with the orthogonal weave as reinforcement was Gurit Prime 20LV epoxy. The nominal properties of 5.
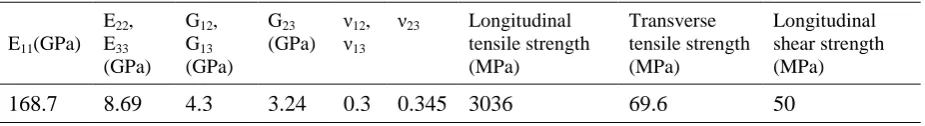
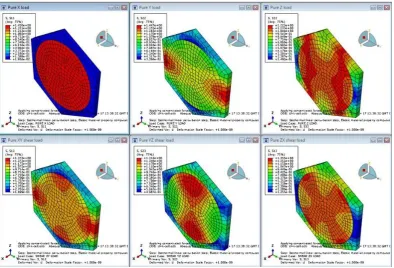
(6) the cured resin are listed in Table 3. The nominal carbon fibre properties are listed in the same table. The transverse modulus of carbon fibre was assumed to be 15 GPa, approximated from published experimental data [6]. These were the input constants in a hexagonally packed single fibre unit cell model. The elastic constants for the tow were derived from solving the six load cases on the unit cell in ABAQUS, shown in Figure 4. The longitudinal strength of the tow corresponds to the fracture of fibre at strain 1.8 %. The transverse tensile strength of the tow was assumed to be equal to the tensile strength of cured resin, while the longitudinal shear strength was equal to the interlaminar shear strength (Table 3). The effective tow properties are listed in Table 4. A failure model introduced by Ruijter [7] was implemented to reduce stiffness gradually as follows: (4). where D is the damage parameter which is equal to ratio of stress (σ) and failure stress (F): (5) (6) (7) For damage along the fibres (Eq. 5) and transverse to the fibres (Eq. 7), the maximum stress criterion is used. For shear damage (Eq. 6), partial distortion energy is used as failure criterion. Table 3. Nominal properties of resin matrix and fibres. E (GPa). Tensile strength (MPa). Tensile failure strain (%). Interlaminar shear strength (MPa). Cured resin. 3.5. 73. 3.5. 47. Fibre. 238. 3950. 1.7. -. Table 4. Tow properties derived from FE analysis, Vf = 70 %. E22, E33 (GPa). G12, G13 (GPa). G23 (GPa). ν12, ν13. ν23. E11(GPa). 168.7. 8.69. 4.3. 3.24. 0.3. 0.345 3036. Longitudinal tensile strength (MPa). Transverse tensile strength (MPa). Longitudinal shear strength (MPa). 69.6. 50. 6.
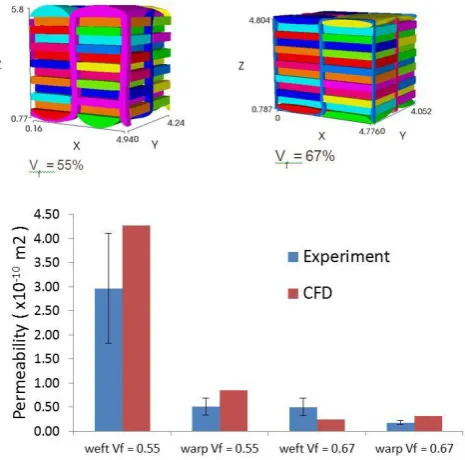
(7) Figure 4. Screenshot of the six load cases of a single fibre unit cell model in ABAQUS for calculation of tow elastic properties. 6. Results and discussion 6.1 Permeability predictions After assessing the sensitivity of permeability prediction on the mesh density for flow simulation, the number of elements was chosen as 50 × 50 × 50 (warp × weft × thickness) for the unit cell mesh to obtain a reasonable balance between computation time and accuracy. To assess the sensitivity of permeability prediction on the level of detail in geometrical textile modelling, incremental variations were implemented in the geometrical models. A unit cell of the orthogonal weave was defined with average dimensions based on -CT image analysis (Table 2). The local refinement on binder cross-sections, surface crimp and warp yarn crosssection was made step by step in successive unit cell models. The geometrical variations addressed observations from the -CT images shown in Figure 5. The predictions from CFD simulations are plotted together with the experimental data in Figure 6. It demonstrates a clear benefit from local geometrical refinement for improving permeability prediction. The same principles were applied for modelling the reinforcement with a higher fibre volume fraction, Vf = 67 %, under compaction. As the local geometries were well defined, the predictions are close to the experiment data (Figure 7).. 7.
(8) Figure 5. Local geometry variations observed in 3D -CT images: (a) Binder cross-sections; (b) surface yarn crimp; (c) Upper - warp cross-sections in brick shape, Lower - power elliptical weft cross-sections.. Figure 6. Permeability predictions with incremental local geometry variations, Vf = 55 %.. Figure 7. Permeability predictions for the orthogonal weave at two compaction levels, corresponding to Vf = 55 % and Vf = 67 %. 8.
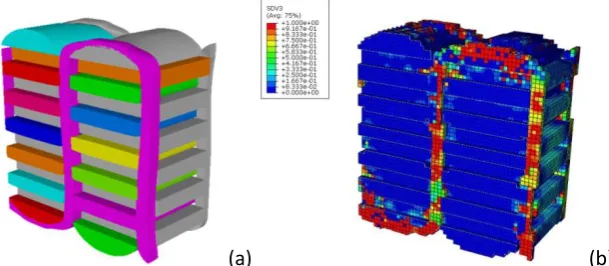
(9) 6.2 Strength predictions To predict the mechanical properties of composites with the orthogonal weave as reinforcement (at Vf = 55%), loading of the unit cell beyond fracture up to a strain of 2 % was simulated by setting appropriate periodic boundary conditions in warp and weft direction and free boundary for top and bottom surfaces. The weave construction of the orthogonal fabric contains 7 plies in weft direction and 6 plies in warp as described in Table 1. Theoretically, if all tows are perfectly straight, as weft to warp ply ratio is 7/6, the stiffness in weft direction would be 17 % higher than in warp direction if the contribution by the binder is neglected. In fact, because the unit cell model describes surface crimp in weft yarns as representing the actual geometry, stiffness in weft is lower. Plotted in Figure 8 are the stress versus strain curves, showing that the stiffness values are close in warp and weft directions. The ultimate strength, however, is different in warp and weft directions. The failure was initiated at a much earlier stage while loading in weft direction. The fracture occurs near the crossover with the binder yarn. Two mechanisms are involved: firstly surface crimp at the crossover points introduces local stress concentrations; secondly reaction force from binder through straightening crimp in the weft direction accelerates transverse failure via resin cracking (Eq. 5), illustrated in Figure 9. The fibre fracture starts to manifest after sufficient resin cracks accumulate on plane of the binder path. It leads to much lower strength in the crimped weft direction than the warp. The unit cell with the local geometry refinement captures this effect well. A detailed experimental study for validation is currently underway.. Figure 8. FE prediction of tensile response of the orthogonal reinforced composites, Vf=55%.. (a). (b). Figure 9. Failure initiation and propagation in plane of binder path under tensile loading in weft direction across binder path.. 9.
(10) 7. Conclusions A systematic approach was presented to assess the effect of local geometrical variations on composites processing and mechanical properties. The motivation was to highlight the geometrical features essential for accurate modelling of 3D woven composites and quantify the relationship between geometry and performance. For the example of a 3D orthogonal weave reinforcement, the geometry of the composites was characterised in detail by -CT image analysis. The geometrical models were generated in TexGen in a semi-automated manner with local geometrical refinements. Based on these models, CFD simulation of impregnating flow and static mechanical analysis were carried out for prediction of in-plane permeability and in-plane tensile properties, respectively. With inclusion of local variations in geometrical modelling, the predictions of permeability improved significantly compared with the experimental data. The prediction of mechanical strength also revealed different failure mechanisms in warp and weft directions, as there are local geometrical differences in crimp, binder configuration and yarn cross-sectional shapes. Acknowledgements This work was supported by the Engineering and Physical Sciences Research Council [grant number: EP/IO33513/1], through the EPSRC Centre for Innovative Manufacturing in Composites. References 1. 2.. 3. 4. 5.. 6. 7.. Mouritz, A.P., Three-dimensional (3D) fibre reinforcements for composites, in Boisse, P. (Ed.), Composite reinforcements for optimum performance, Woodhead Publishing, UK, 2011 Long, A.C. and Brown, L.P., Modelling the geometry of textile reinforcements for composites: TexGen, in Boisse, P. (Ed.), Composite reinforcements for optimum performance, Woodhead Publishing, UK, 2011 Weisstein, E.W., Superellipse, From MathWorld--A Wolfram Web Resource. http://mathworld.wolfram.com/Superellipse.html Gebart, B.R., Permeability of Unidirectional Reinforcements for RTM, Journal of Composite Materials, 26(8), 1100-1133, 1992 Endruweit, A., McGregor, P., Long, A.C. and Johnson, M.S., Influence of the fabric architecture on the variations in experimentally determined in-plane permeability values, Composites Science and Technology, 66(11-12), 1778-1792, 2006 Maurin, R., Davies, P., Baral, N. and Baley, C., Transverse Properties of Carbon Fibres by NanoIndentation and Micro-mechanics, Applied Composite Materials, 15(2), 61-73, 2008 Ruijter, W., Analysis of mechanical properties of woven textile composite as functions of textile geometry, PhD dissertation, School of M3, University of Nottingham, Nottingham, UK, 2008. 10.
(11)
Figure
+5
Related documents
Abstract - To meet the emerging credit needs of the self-employed production spectrum i (with institutional credit as agent of change) and to create a socially responsible
Identifying neuronal and glial cells in primary cell culture Neural precursor cells and differentiated neuronal cell types in the Drosophila larval brain can be identified by
Butt et al EURASIP Journal on Wireless Communications and Networking 2014, 2014 65 http //jwcn eurasipjournals com/content/2014/1/65 RESEARCH Open Access Individual packet deadline
Brazilian Twin Registry: A Bright Future for Twin Studies/Twin Research: Twin Study of Alcohol Consumption and Mortality; Oxygen Uptake in Adolescent Twins/In the News:
Perbincangan yang akan dihuraikan dalam bahagian ini adalah berkaitan dengan maklumat yang telah diperolehi melalui soal selidik yang telah dianalisis iaitu tentang persepsi
If (5) is ac- tive or passive depends on the concrete gesture form. Passive gestures are candidates for conversationaly used deictic gestures, while manipulative
scence of mutant mtDNA (a point mutation in the anticodon region of the tRNAPro gene; reference 22) in white blood cells of a young girl with a myopathy and high levels of mutant.
tosis, reduced S/V plays a dominant role in reducing cell deformability, with an additional influence of increased internal viscosity in a subpopulation of cells with high mean
