Capillary Electrophoresis
S. F. Y. Li and Y. S. Wu, National University of Singapore, Singapore
Copyright^ 2000 Academic Press
Introduction
The migration of charged particles under the inS u-ence of an electricReld was discovered and character-ized theoretically more than 100 years ago by Kolrausch et al. Foreseeing the possibility of separ-ation of charged species through the applicsepar-ation of a voltage, the term ‘electrophoresis’ was coined soon after. However, early attempts to use electrophoresis as an analytical tool were persistently frustrated by the existence of Joule heating, which acts to discount the electrophoretic effect. Thus a way of combatting the thermal effect during the electrophoretic process was needed. By 1950s, Tiselius et al. found that a variety of substances such as agarose and polymeric gels could serve as stabilizing agents in electro-phoretic analysis owing to their anticonvective properties. This eventually led to the creation of slab gel electrophoresis, which has become a fundamental technique for the study of proteins, DNA fragments and other biomacromolecules in life sciences and biotechnology. Notwithstanding its great success, slab gel electrophoresis has its drawbacks with re-spect to speed and automation when compared with contemporary chromatographic techniques such as high performance liquid chromatography (HPLC).
A straightforward way to speed up an electro-phoretic separation process is to apply higher electric Relds, and this necessitates systems able to release the heat generated more efRciently. Electrophoresis with a tube as a separation channel is hence an attractive choice since the desired surface-to-volume ratio can be achieved by simply reducing the tube radius. Per-forming electrophoresis based on the tube format has an added advantage in that simultaneous detection may be implemented in a way analogous to HPLC, thus rendering the entire procedure fast and auto-matic. Running electrophoresis with a tube conR gura-tion was initiated by Hjerten as early as the 1960s, and further attempted by Virtanenet al. and Mikkers
et al. in 1970s. During this period, the adopted inner diameters of tubes were in the range of 0.2}3 mm, and thermal effects conRned the applied voltage to around 1000}2000 V, which was of the same order as in typical slab gel electrophoresis. As a conse-quence, despite these pioneering efforts to perform
free solution electrophoresis with in-line monitoring, the full potential with respect to column performance was not yet attained. Also, complexity in instrumen-tal design deterred follow-up by ordinary elec-trophoresis practitioners.
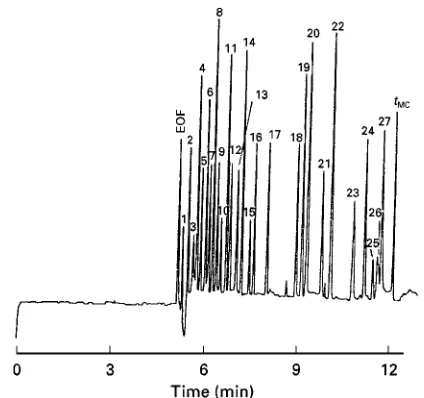
A milestone for column-based electrophoresis was set in the early 1980s, when Jorgensonet al. introduc-ed capillary zone electrophoresis (CZE) with on-col-umn optical detection. They found that with the inner diameter of the capillaries scaled down to 80m, voltages as high as 30 kV could be applied without incurring overheating problems. Thus the separation time for most charged species, from small molecules to macromolecules, was shortened to less than 30 min, which is comparable to modern chromato-graphic methods. For the Rrst time outstanding column efRciencies of several hundred thousand plates was routinely obtained. The unprecedented performance, relatively simple instrumentation, con-current with the widespread availability of fused silica capillary columns by the mid-1980s quickly aroused the interests of both electrophoresis practi-tioners and chromatographers, thus making capillary electrophoresis (CE) one of the most exciting research areas. Today, it has become an indispensable branch of modern separation science. The powerful separ-ation ability of CE was exempliRed in an early electropherogram concerning the resolution of de-rivated peptides originated from egg white lysozyme (Figure 1).
This article serves as an introduction to CE. It covers the basic principles, various aspects of instru-mentation, separation modes and major applications. Some future trends of CE are discussed in theRnal section.
Fundamentals
Electrophoretic Migration of Ions
The uniform motion of an ion under an electric Reld can be recognized as a result of balancing electromotive and frictional forces of the ion in solution:
qE"6ru [1]
whereqis the effective charge of the ion concerned,
Figure 1 Capillary zone electrophoresis separation of fluor-escamine-labelled peptides obtained from a tryptic digest of re-duced and carboxymethylated egg white lysozyme. (Adapted with permission from Jorgenson JW and Lukacs KD (1981) Zone electrophoresis in open-tubular glass capillaries: preliminary data on performance.Journal of High Resolution Chromatography and Chromatographic Communications 4: 230}231.)
linear velocity per unit of electricReld:
"Eu"6qr [2]
From eqn [2], it can be seen that the ion’s effec-tive charge, its size and the viscosity of the solution decide ionic mobility. Thus in a given system ionic mobility is an intrinsic property of an ion. Usually ionic mobility cannot be directly derived from eqn [2], as the parameters are not easily accessible quantities. Instead it can be measured based on rel-evant experimental data, i.e. how long an ion takes to travel through a certain distance under a deRnite electricReld, as follows:
"uE"Leff
tm; 1
E" Leff
tm; 1
V/Ltot"
Leff;Ltot
V;tm [3]
whereLeffandLtot are the effective migration length (from inlet to detection window) and total migration length, respectively,Vis the applied voltage, andtmis the migration time of the ion. For a CE system oper-ated under a constant voltage,Leff,LtotandVare all
Rxed. Hence electrophoretic mobility, the inherent attribute of an ion is directly reSected by its migration time. This provides the theoretical basis of using migration time as a means of identifying an ion in CE.
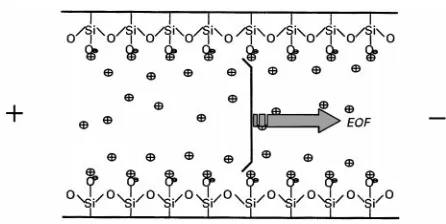
Electroosmotic Flow (EOF)
Electroosmosis is a fundamental electrokinetic effect involving movement of the bulk solution against a charged solid surface under the inSuence of an electric Reld. In the case of CE, the capillary inner wall usually carries negative charges due to the de-protonation of silanol groups. For the part of the liquid adjacent to the capillary wall, build-up of cations takes place to counterbalance the negative charges on the capillary surface. According to Stern’s double layer model the solution containing net ca-tions can be divided into two regions, namely a rigid layer and a diffuse double layer. The rigid layer is immediately adjacent to the capillary wall, so the cations within it are largely immobilized owing to the strong electrostatic interaction with the wall. The diffuse layer is slightly away from the wall, hence the cations inside are mobile. Upon the application of a voltage, these cations together with their surround-ing hydratsurround-ing water will migrate towards the cathode. The cohesive nature of water causes the whole solu-tion inside the capillary to be dragged forward, generating a net Sow across the capillary. This is named the electroosmotic Sow (EOF). The magni-tude of the EOF can be described via the Helmultz equation:
eo"
4 [4]
whereis the dielectric constant of the buffer solu-tion, is the zeta-potential across the diffuse layer, andis the viscosity of the electrolyte. Unlike con-ventional electrophoresis where EOF is regarded as unfavourable and thus usually suppressed, in CE it has several important positive implications.
Figure 2 The generation of electroosmotic flow (EOF) in a silica capillary.
Figure 3 Effect of EOF on the apparent mobilities of anions and cations.
Second, the presence of EOF affects the apparent mobilities of ions (Figure 3). In any electrophoretic separation system where EOF is not fully suppressed, the observed mobility of a charged species will be the resultant of its effective electrophoretic mobility and EOF:
obs"ep#eo [5]
Under normal conditions, with EOF directs towards the cathode, obviously cations will be accelerated, while anions will be decelerated. If the magnitude of the EOF exceeds the mobilities of the anions, the anions will be swept towards the detection side, thus allowing the simultaneous analysis of cationic and anionic species. As the magnitude and direction of EOF will affect how long the analytes stay inside the separation capillary, manipulation of EOF often be-comes a core issue for effecting a satisfactory resolu-tion. Since the formation of EOF involves two phases (capillary wall and running buffer), any modiRcation to their chemistries will bring about a change in EOF.
Causes of Band Broadening
As in a chromatographic process, in electrophoresis it is necessary to contain the ionic species within nar-row bands while creating sufRcient mobility differ-ences. How narrow a band is depends not only on the various dispersive factors inherent to the elec-trophoretic process, but also on how well the whole process is performed. The common causes of band
broadening in CE include longitudinal diffusion, in-jection-related volume overloading, thermal effects, electrodispersion, wall adsorption, etc. These band broadening mechanisms are deemed to be ran-dom and independent events, so that the concept of summation of variances can be used to evaluate the contributions of individual factors to the overall band broadening effect, that is:
2
tot"2diff#2inj#2therm#2wall#2electr#2other [6]
A brief description of these band broadening factors is given below.
Longitudinal diffusion In the course of electro-phoretic transportation of an analyte band along the capillary, the sample molecules will inevitably have a tendency to enter the surrounding buffer solution because of the apparent concentration difference, leading to a wider and more dilute sample band. According to Einstein’s diffusion equation, band dis-persion due to longitudinal diffusion is a function of diffusion coefRcient and time:
2
diff"2Dmt [7]
Under an ideal situation, longitudinal diffusion be-comes the only unavoidable band broadening pro-cess. Therefore it deRnes the maximum attainable column efRciency in CE. Based on chromatographic theory, the maximum obtainable theoretical plates (N) can be derived as follows:
N"L
2
2"
L2 2Dmt
"2D L2
m;(L/v)
"2Dm;[(Leff;L2 Ltot)/V]"2DV
m
[8]
that eqn [8] is only valid under the precondition that longitudinal diffusion plays a predominant role among the various band broadening mechanisms. In other words, to achieve the maximum column efR -ciency, the electrophoretic separation should be car-ried out in such a way that all the other potential band dispersions are curbed well below the magni-tude of the longitudinal diffusion effect.
Injection related volume overload During sample injection, aRnite volume of sample is placed onto the capillary. The length of this starting plug will contrib-ute directly to the Rnal band width. Treating the original band as rectangular in shape, the variance of this plug can be expressed by:
2 inj"
linj 12
2
[9]
wherelinjis the initial plug length. As a rule of thumb, loss of efRciency due to any extraneous dispersion factor should be kept within 10% of the maximum theoretical column efRciency. Assuming a moderate plate number in the order of 105as deRned by longitudinal diffusion, it can be easily estimated that the acceptable injection length should be a few millimetres. For the commonly employed capillaries with inner diameter between 50 and 75m, the above length is equivalent to only a few nanolitres. So it is obvious that CE’s high column efRciency will pose very stringent restriction on the sample size. Any attempt to increase the injection volume in an aim to enhance detection sensitivity may result in a signiR -cant loss of column efRciency.
Thermal gradient effect An electrophoretic pro-cess is always accompanied by certain amount of thermal effects due to the passage of a current through the resistive medium (Joule heating). For a CE system, the electrical power (P) responsible for the generation of heat can be estimated through the following equation:
P"V;I"V
2
R" V2r2c
L [10]
whereVis the applied voltage,randLare capillary inner radius and length, respectively, while and
c are respectively the molar conductivity and the concentration of the electrolyte solution. While heat generation is uniform for the whole electrolyte solution, heat dissipation is apparently not: the nearer the electrolyte is to the capillary wall, the faster is the heat transferred out to the surroundings. Con-sequently, a temperature gradient is generally present in the radial direction of the capillary, which is
equivalent to the superimposition of a parabolic proRle to the otherwise plug-like ion boundaries and bulk Sow, as any temperature gradient will be translated into viscosity and mobility gradients in the solution. To minimize the inSuence of thermal effects on the overall column efRciency, it is imperative to limit the heat generation while maximizing the heat dissipation. In this regard, the use of narrow bore capillaries is particularly recommended because it favours the above two aspects simultaneously. Ac-cording to eqn [10], for a certain CE system, heat generation may also be controlled through balancing the buffer composition and separation potential.
Wall adsorption effect The capillary surface, like most solid surfaces, never behaves in a completely inert manner to foreign compounds. In HPLC, it has been well known that peak anomalies are often the result of some speciRc interaction (e.g. hydrogen bonding) between the residual silanol groups and analytes. While similar adverse effects cannot be ruled out, in CE the problem is exacerbated by the fact that under a typical operation condition, the silanol groups along the wall are mostly deprotonated to give a negatively charged capillary surface. When an analyte with a positive charge travels along the capillary, the electrostatic force will tend to attract the analytes onto the wall, causing additional band broadening. This is a feature of the analysis of pro-teins owing to their low diffusion coefRcients and multiple charge sites. SigniRcant efforts have been made to tackle this problem, mostly through the suppression of EOF or complete reversal of the charge status of the capillary wall.
Figure 4 Mobility mismatch-induced band broadening.
[image:5.568.292.518.405.673.2]Figure 5 Instrumental setup of a capillary electrophoresis system.
Figure 6 Commercial CE systems. (A) Bench top CE system. Photograph courtesy of Bio-Rad Laboratories. (B) Portable CE system. Photograph courtesy of CE Resources Pte. Ltd. trailing boundary but a broadened leading boundary.
[image:5.568.52.278.536.685.2]By a similar argument, if the analyte ion is of lower mobility than the co-ion, a fronting band is expected (Figure 4). The higher the sample concentration com-pared to the buffer concentration, the more pro-nounced are the nonuniformities with respect to con-ductivity andReld strength, and eventually more se-vere is the band asymmetry.
From the above discussion it is obvious that, to prevent possible loss of column efRciency due to elec-trodispersion, the conductivity of the injection plug and the actual sample concentration should be sufR -ciently low. Theoretical study had shown that, to conRne the electrodispersion-related band broaden-ing at a level comparable to longitudinal diffusion, the sample concentration should be two orders below the buffer concentration. To some extent, it is the electrodispersion that limits the mass loadability of a CE system.
Instrumentation
CE can be performed with relatively simple instru-mentation as depicted in Figure 5. A capillary con-taining an appropriate separation medium spans two buffer reservoirs, to which the high voltage power
supply is connected via the platinum electrodes. Fol-lowing the introduction of sample at the capillary inlet, a high voltage is applied, thus driving the analytes to travel inside the capillary with different velocities. Somewhere close to the capillary outlet, an on-line detector is installed to monitor the separation process. The resulting signals are fed to the data acquisition device, andRnally the result is presented in the form of an electropherogram.
Apart from these fundamental components, com-mercial CE instruments are commonly equipped with some dedicated facilities, such as an autosampler, pressure regulating unit, capillary thermostatting, and comprehensive supporting software. These added functions allow a sequential analysis of differ-ent samples under prespeciRed conditions, thus ensur-ing better reproducibility, accuracy and higher throughput. Two modern commercial systems are shown inFigure 6.
High Voltage Power Supply
antielectrical shock loop. In the commercial CE in-struments, the power supply is designed with digital communication capability, so that more information such as a current curve can be tracked and retrieved, and the applied voltage can be programmed.
Separation Capillary
Although capillaries made of glass or polymer (e.g. TeSon or Nylon) have found occasional applica-tion, fused silica capillaries are used predominantly in CE, largely due to their strength,Sexibility and most importantly their excellent UV transparency. Usually the fused silica capillary is coated with a layer of polyimide to enhance its durability. For on-column optical detection a small segment of this coating needs to be removed to provide the detection win-dow. The most commonly used CE capillaries have inner diameter between 20 and 75m, outer dia-meter 100}400m and are about 30}100 cm in length.
Sample Injection
To achieve high column efRciency and good quantit-ative results, sample injection must be performed in a reproducible manner. Since the injection volume in CE is in the nanolitre range, which precludes the use of conventional injection methods, alternative ap-proaches have to be pursued. Hydrodynamic injec-tion and electrokinetic injecinjec-tion have turned out to be the most widely employed sampling techniques.
Hydrodynamic injection introduces a sample based on a pressure difference in the two sides of the capil-lary. For a laboratory-built instrument, this is realized by simply lifting up the sample vial together with the capillary inlet for a certain period of time (typically a few seconds). The hydrodynamic force will siphon a band of sample solution into the capillary. For commercial instruments, the pressure drop is created by either applying pressure at the inlet side, or impos-ing a vacuum at the outlet vial. The injection volume can be calculated based on Poiseuille’s law:
Vinj"
Pr4t 8L "
gr4 ht
8L [11]
where Pand hare the pressure and height differ-ences, respectively, whiler,t,andLrepresent capil-lary inner radius, injection time, solution viscosity and capillary total length, respectively.
Electrokinetic injection is based on the transporta-tion of sample ions by electrophoretic movement and EOF. Normally a lower voltage than that for separ-ation purpose is applied for a certain amount of time to allow analytes to migrate into the capillary. The
injection volumes of individual components can be calculated through the following equation:
Vinj"
(i#eo)r2Vt
L [12]
where i,eo are the mobilities of the analyte and EOF, respectively, andVis the injection voltage. For electrokinetic injection the injected amounts of differ-ent analytes are dictated by the mobilities of the respective analytes. Thus it is different from hy-drodynamic injection, where the sample plug is of entirely the same composition as the original sample solution. To avoid sample injection bias, hydro-dynamic injection is preferred. However, in some circumstances hydrodynamic injection may be im-practicable (e.g. owing to the high viscosity or low permeability of the separation medium). Elec-trokinetic injection is then the only viable option, such as in capillary gel electrophoresis. On the other hand, sometimes electrokinetic injection may be ex-ploited in favour of CE operation. For example, it can be employed to diminish the interference of the sample matrix if the components concerned are of low mobilities. Moreover, if the sample is of low conductivity, then sample enrichment during elec-trokinetic injection is possible by taking advantage of the sample-stacking effect.
Detection
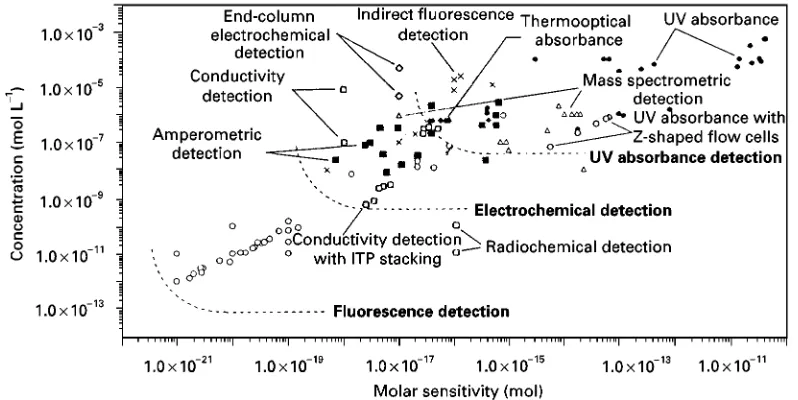
In CE, sample separation is accomplished in an elec-trolyte solution, so detection strategies analogous to HPLC are adopted. Compared with HPLC, CE col-umn efRciencies are at least one order of magnitude higher, which suggests that solute bands will be nar-row and the average concentration of the analyte zone is several times higher than for HPLC. As far as a concentration-sensitive detector concerned, this im-plies a larger detection signal output. However, so far for CE the concentration sensitivity is usually lower than its HPLC counterparts. This apparent contradic-tion stems mainly from the small sample size, which poses great difRculties for detection. The fun-damental detection schemes in CE fall into three categories: optical (UV absorptive and Suorescent) detection, electrochemical detection, and various hy-phenating techniques (typically mass spectrometric detection). The sensitivities of the different detection methods are compared inFigure 7.
Figure 7 Comparison of sensitivities of various CE detection methods. (Adapted with permission from Landers JP(ed.)Handbook of Capillary Electrophoresis, 2nd edn, chap. 10, pp. 425}448. Boca Raton, FL: CRC Press.)
removed and the capillary is mounted directly be-tween the incident lens and photocell, in conjunction with a corresponding aperture. Such on-column de-tection conRguration, though easy to execute, pro-vides only a moderate detection sensitivity with the lower detection limits around 10\5to 10\6mol L\1, as it is associated with two major problems. First, since the capillary is illuminated radially, the max-imum optical path is equivalent to the inner diameter of the capillary. This severely reduces the achievable absorbance according to Lambert}Beer’s law. Sec-ond, due to its unique cylindrical geometry, the capil-lary tends to act like a lens to defocus the incoming light, thus posing difRculties in light orientation and collection. As a consequence, signal noise and nonlin-earity are further aggravated. By bending the capil-lary into Z-shape or creating a bubble feature on the capillary body, the optical pathlength can be con-siderably increased. These efforts, coupled with improved detection optics, enhance the detection limits to 10\7mol L\1. The capillary can also be connected to an HPLC-type Sow cell (pathlength
&1 mm) as in the HP system.
Fluorescence detection Fluorescence detection is so far the most sensitive detection mode available to CE due to the fact that the measurement is performed against a ‘dark’ background, andSuorescence inten-sity is less pathlength dependent but directly propor-tional to excitation power. On-column Suorescent detection can also be realized through adaptation of an HPLC-type detector. Once again, due to the pres-ence of the lens effect of the capillary, improvement of the detection optics is necessary to ensure better
focusing of excitation light and more effective collec-tion of emission light. An important development in CESuorescence detection is the introduction of laser-based excitation sources. Owing to its outstanding coherence, a powerful laser source can be focused into an extremely sharp beam to illuminate the core part of the capillary, thus producing emission light of high intensity. As a result, detection limits of 10\9}10\11mol L\1 can be obtained routinely, which is at least two orders of magnitude more sensi-tive than the conventional approach. Single molecule detection has been demonstrated by Rne-tuning the CE system and utilizing laser-induced Suorescence (LIF) detection. A major drawback of Suorescence detection is that the number of analytes with native Suorescence is far less than that with UV absorbance. Therefore, to make use of this highly sensitive detec-tion scheme, derivatizadetec-tion of analytes by tagging with aSuorescent group is often needed.
sensitivity is lower than that for direct photometric detection. To achieve an acceptable detection limit, the background concentration should be kept low. Under such circumstance, any mismatch of mobilities between the sample ions and background co-ions will give rise to a considerable electrodispersion, hence leading to severely distorted peaks. Therefore, selecting a suitable CE background is of special signif-icance for the implementation of indirect optical detection.
Electrochemical detection In electrochemical detec-tion, sample bands are monitored in terms of an electrical signal. Depending on the application, the measured quantity can be conductivity, voltage or current. Accordingly it is referred to as conduc-timetry, potentiometry or amperometry, respectively. Unlike optical detection in which the measurement output depends strongly upon the available volume, in electrochemical detection the signal relates only to the part of solution that is directly contacting the electrode surfaces. Thus, wherever volume insufR -ciency precludes the employment of photometric de-tection, e.g. in case where ultra-narrow bore capillary is used to facilitate fast separation, electrochemical detection may still be a viable choice. Moreover, as long as the analyte is electrochemically active, the detection can be performed directly without involv-ing derivatization, as it may be for photometric detection. Due to these advantages, electrochemical detection gradually gains its popularity in CE practice.
There are two major difRculties involved with im-plementing electrochemical detection for CE. The Rrst comes from the fact that, it is not easy to make an electrochemical detector function well in the presence of a high voltage, because the separation voltage will produce noise that swamps the minute response of the analytes. Thus, decoupling of the separation electric Reld from the detection system has to be done to facilitate the measurement. The insulation of the sep-aration voltage can be realized by introducing a frac-ture or a gap strucfrac-ture in the capillary through which the electrical grounding is made, such that the seg-ment behind the fracture or the gap can be used for the accommodation of the electrochemical electrodes. Alternatively, to shield off the high voltage, the de-tecting elements may be mounted immediately out-side the outlet of the separation capillary. A more elegant way is to etch the capillary end to generate an enlarged conical cuvette from where the detecting electrodes are installed. In this way the interference of high voltage can be eliminated because the electric Reld decays very rapidly before the enlarged conical part. The second difRculty stems from the need to
fabricate microelectrodes and mount them into an extremely small space, usually deRned by the separ-ation capillary. While the current state-of-the-art allows the preparation of microelectrodes with di-mensions down to severalm, the installation of the microsensing elements to the detection region is a task requiring complicated microfabrication tech-niques and great patience. All three types of electro-chemical detection have shown their feasibility in CE with typical detection limits in the range of 10\7}10\9mol L\1.
Hyphenation with mass spectrometry Following the great success in interfacing HPLC with mass spec-trometry, it is a logical move to explore the potential of CE-MS. For a successful implementation of CE-MS, keeping a proper electrical contact at the MS side is essential. This has been achieved through a variety of means, such as contacting via coaxial sheathSow, or through a liquid junction. Sheathless contact has been realized by attaching the metal-coated separation capillary tip directly to the ion source emitter. For sample ionization and transporta-tion, the electrospray ionization interface (ESI) is pre-dominantly adopted, mainly because ESI is operated under almost atmospheric pressure, thus not conS ict-ing with CE separation. Moreover, ESI ionization works with electrostatically induced nebulization, in which compounds are ionized with different charge status depending on their relative molecular masses and shapes. In principle, this allows determination of relative molecular mass for a large range of com-pounds, from small molecules to large biopolymers (such as proteins and polysaccharides). Thus it is applicable to all types of CE analytes. As for the mass analyser, the high efRciency of CE separation de-mands a mass analyser with a fast scan rate. The time-of-Sight (TOF) mass spectrometer is probably the most promising candidate, but the quadrupole mass spectrometer is currently the workhorse for CE-MS owing to its commercial availability and relative-ly low cost. Its insufRcient scan speed may be com-pensated partially through the manipulation of the electricReld, i.e. when a certain analyte is migrating out of the capillary, the applied voltage can be re-duced temporarily, such that the analyte of interest will remain in the ionization chamber for a longer time. With careful optimization of parameters, CE-MS has shown detection limits in the attomole range (10\18mol mass).
Separation Formats of CE
Figure 8 CGE separation of poly(uridine 5-phosphate). (Adapted with permission from Yin HF, Lux JA and Schomburg G (1990) Production of polyacrylamide gel filled capillaries for capillary gel electrophoresis (CGE): influence of capillary surface pretreatment on performace and stability.Journal of High Resolu-tion Chromatography 15: 624}627.)
described in Figure 2. This is made possible by simply altering the separation medium inside the capillary and utilizing an appropriate buffer system. The com-monly employed separation formats in CE can be divided into the following.
Capillary Zone Electrophoresis (CZE)
Among the various CE formats CZE is the simplest and most popular. Here a homogenous free solution is employed to maintain a constant electricReld along the capillary. Ionic species are separated inside this supporting solution according to their different charge-mass ratios, thus forming segregate zones. The desired separation selectivity can be achieved by simply optimizing the parameters of the carrier electrolyte particularly pH, as well as ionic strength and the type and concentration of various EOF modiRers. A number of secondary equilibria are available to strengthen the separation selectivity further.
Although CZE is commonly performed with an aqueous buffer, it can also be implemented in a non-aqueous medium by using organic solvents and compatible conductive salts. The effect of replacing water with an organic solvent in CE can be under-stood from the fact that organic solvents possess signiRcantly different viscosities and dielectric con-stants compared with water. Thus, changes in the magnitude of EOF and migration behaviours of charged analytes are expected in non-aqueous CE, which can be seen from eqns [2] and [4]. Further-more, organic solvents differ in their capacity to stabilize equilibria. Thus, in organic media, the charge status of organic analytes can be dramatically different from that in an aqueous medium, hence leading to quite different separation selectivity. Addi-tionally, it is evidenced that organic media are ca-pable of promoting certain mechanisms such as inclu-sion interaction and ion-pair formation, which en-hance possibilities of achieving the desired separ-ation. Moreover, with a water dominated buffer, it is very difRcult to conduct CE separations of hydropho-bic analytes. Under such circumstances, switching to a non-aqueous buffer system would provide an efR -cient solution. Finally, it is noted that, when an or-ganic medium is utilized for CZE separations, the electrophoretic current is reduced considerably. As a result, even though capillaries of relatively wide inner diameter are employed, Joule heating is at a manageable level, thus enabling the enhancement of detection sensitivity through the usage of wide bore capillaries. In short, non-aqueous CZE is an attract-ive means for extending the applicability of CE.
Capillary Gel Electrophoresis (CGE)
Figure 9 Separation mechanism of MEKC.
Capillary Isotachophoresis (CITP)
In CITP, a leading electrolyte of higher mobility than any of the sample components isRlled into the separ-ation capillary and outlet reservoir, while a termina-ting electrolyte of lower mobility than any of the sample components is placed in the inlet reservoir. The sample is applied from the capillary inlet. This arrangement ensures that there will be no mixing of sample with the two electrolytes during the whole electrophoretic process. As a consequence, upon application of an electricReld, the main change hap-pens inside the sample band itself, i.e. the sample components tend to ‘queue up’ according to their effective mobility orders. These components are relo-cated with corresponding changes in their concentra-tions and band lengths. Ultimately a series of con-secutive ‘pure zones’ containing only the individual substances are formed. This is the steady state as there will be no more changes for the sample except that all the zones will continue to migrate out of the capillary with an identical velocity (hence the term ‘iso-tachophoresis’). Unlike the other types of CE separ-ation, in CITP the concentration of a speciRc zone is predetermined by the concentration of the leading electrolyte and the relative mobility of the ion of interest with respect to the leading electrolyte, while the sample amount is reSected by the zone length. Due to the unique stepwise increase in electric Reld starting from the leading electrolyte side, which prevents a component from drifting off its own band, sharp boundaries can be maintained more readily. Therefore CITP can be implemented using tubes of relatively large i.d. (e.g. 0.2}0.8 mm). Nevertheless, CITP as an analytical tool has largely lost its popularity since the advent of CZE, probably due to the fact that a thorough knowledge of the sample is required before the separation. Further-more, the isotachopherogram is usually step-shaped, and the steps are not time related, thus rendering automatic identiRcation and quantiRcation difRcult. CITP is often applied as a sample pre-concentration step before CZE separations to enhance detection sensitivity.
Capillary Isoelectric Focusing (CIEF)
This is another example of an adaptation of a conven-tional electrophoresis principle to a capillary format. CIEF exploits differences in isoelectric points (pIs), a unique characteristic of amphoteric compounds un-der which its acidic and basic groups dissociate to an equal extent, so that the whole molecule exhibits no net charge. It is only suitable for the separation of compounds like amino acids, peptides and proteins. The operation of CIEF relies on a mixture of carrier
ampholytes with isoelectric points in a certain range and in close proximity to each other. Such a mixture is commonly formed by a series of synthetic poly-amino polycarboxylic acids. The capillary is Rlled with the carrier ampholyte solution and a small amount of sample, and dipped into the buffer reser-voirs that contain acid and base, respectively. Under the electric Reld, different ampholytes will migrate along the capillary until they reach positions corre-sponding to their pI values, where they stand still. Collectively a stable pH gradient is formed across the capillary. The sample components, too, will migrate until theyRnd positions equivalent to their pIvalues. When such a steady state is obtained, an immobiliz-ation step (by utilizing electrophoretic movement or pressure) is performed, and the separated analyte bands will be forced out and passed through the detector. If the carrier ampholyte mixture is well prepared and a sufRcient time is allowed for the electric focusing process, a very high column efR cien-cy can be realized.
Micellar Electrokinetic Chromatography (MEKC)
Figure 10 Separation of small neutral aromatic compounds by bile salt-based MEKC. (Unpublished results.)
direction. Thus a migration time window is deRned within which the neutral compounds can be separ-ated according to their afRnities for the micelle micro-environment. If a positively charged surfactant is used, then similar resolution of neutral analytes can again be obtained, the only difference being that the EOF will be reversed owing to the adsorption of cationic surfactant molecules onto the capillary. The polarity of the separation voltage, therefore, needs to be reversed. The micelle-forming reagents for MEKC are not limited to synthetic detergents}any chemical with similar surface activity can be employed. These include biogenic surfactants such as bile salts (Fig-ure 10), and as some synthetic high mass-to-charge polymers.
Af\nity Capillary Electrophoresis (ACE)
Compared with other types of CE techniques, ACE represents a relatively recent development. Introduc-ed in the early 1990s, ACE is performIntroduc-ed on the basis of speciRc or non-speciRc afRnity interactions be-tween receptor and ligand molecules, typically bio-molecules. Theoretically, if either receptor or ligand is a charge species, their binding complex would show a different electrophoretic mobility from that of the parent molecule due to the changes in charge-mass ratio. Thus, measuring the changes in elec-trophoretic mobility of the receptor via CZE mode provides an excellent way to study aspects of the receptor}ligand binding.
Depending on the binding strength of the recep-tor}ligand pair and the operational procedure, ACE
can be divided into three different categories, namely, non-equilibrium mode, dynamic equilibrium mode and immobilizing mode. Equilibrium ACE is well suited to studying strong binding systems, in which the sample is injected as an equilibrated mixture of receptor and ligand, whereas the electrophoresis medium contains only the supporting buffer. In such cases, CE serves merely as a tool to separate and determine the free and bound receptor molecules. Dynamic equilibrium ACE is typically employed for weak to moderate binding system, in which the receptor is injected as the sample, while ligand of varied concentration is incorporated in the running buffer. In this case, free and bound molecules are not separated due to the fast on-and-off kinetics, but rather, they are detected as single peaks. The im-mobilizing mode is self-explanatory, for which ligand is attached to the capillary wall, or more commonly, onto a supporting material via an appropriate bond-ing chemistry, while sample (receptor) is driven over the active surface by application of an electricReld. Again, the migration behaviour of the receptor is a good indication of receptor}ligand interaction strength.
ACE has become a powerful tool in diverseRelds, including the measurement of binding constants, the study of binding kinetics, the determination of interaction stoichiometry, the characterization of biomolecules and the separation of enantiomers, etc. ACE has been applied to the investigation of a number of biologically important systems, such as the interaction of polypeptides with immunog-lobulins, polypeptides, carbohydrates, nucleic acids, drugs, etc.
ACE bears some resemblance to classical gel afR n-ity electrophoresis and conventional afRnity chromatography, in that they all utilize speciRc inter-actions to effect separations. However, ACE in-herently has an unsurpassed advantages, that is, the buffer conditions (ionic strength and pH) can be Rnely tuned to give a perfect mimic of the real physio-logical environment, so that more precise character-isation of many binding processes is possible, pro-vided the wall adsorption problem can be addressed properly.
Applications
through small molecules to macromolecules. High mass biomolecules such as proteins, DNA and poly-saccharides can be separated by CZE as well as CGE. Smaller charged molecules such as amino acids, peptides, organic acids and amines can be resolved via CZE. Simple ions, both cations and anions, can be easily separated via CZE with conductivity detection. CZE separations of ions with indirect UV detection, dubbed as capillary ion analysis (CIA) has been accepted rapidly as an alternative to ion chromatography owing to its simplicity, speed and low cost. The separation of various neutral com-pounds has been made possible through MEKC or CEC. Chiral separations, an area hardly touched by conventional electrophoresis, is increasingly carried out by CE. Many chiral selectors (cyclodextrin deriv-atives, amino acids, proteins, optical micelles, etc.) may be added to the buffer solution to induce enan-tiodis crimination based on one of several mecha-nisms (host}guest complexation, ligand exchange and solubilization by micelles, etc.). The unequal stability of dynamically formed diastereoisomers cause the optical isomers to be moved out of the capillary with different velocities, and enantioseparation is achieved. Because of its far-reaching capabilities, CE is becoming ubiquitous in almost all analytical Relds.
Future Prospects
The introduction of CE in the early 1980s has had a huge impact on numerous scientiRcRelds. It can be anticipated that in the future CE will continue to evolve into a fully Sedged analytical technique that will beneRt many research disciplines. Based on the characteristics of CE and its current status, several directions deserving special attention can be en-visaged.
CE is hailed for its high column efRciency and outstanding mass sensitivity. The concentration sensi-tivity of CE remains relatively low compared to HPLC, thus limiting its applications in areas such as trace impurity determination and environmental analysis. Therefore, improving the detection sensitiv-ity will continue to be a topic for development. Cre-ative detection conRgurations, interplay from micro-mechanic and microelectronics, together with ad-vancement of light sources, may remarkably enhance the sensitivity of optical detection. To facilitate the use of electrochemical detection, efforts must be made to provide better microelectrodes with reason-able ruggedness. With the enhanced performance and reduced cost, a more common use of sophisti-cated hyphenation techniques such as CE-MS is expected.
On the other hand, the ability of CE to handle extremely small sample quantities is attractive for the direct probing of micro-entities. The recently emerged single cell analysis is a good example of this. With further improvements in sampling techniques and detection schemes, it is believed that in the near future, CE-based methodologies will allow us to in-vestigate the chemistries of a wider spectrum of cells, thus enriching our knowledge about many biological processes essential to life.
Finally, due to its instrumental simplicity, CE is amenable to further miniaturization. CE on a glass chip has been successfully demonstrated by borrow-ing microfabrication concepts from the microelec-tronics industry. These devices feature the integration of injection, separation and detection, as well as sophisticated designs with intricate patterns and multi-channel arrays, thus producing an unprece-dented analytical platform which is fully manipulated by applying voltages. As the plate format possesses an excellent ability for heat dissipation, electricRelds up to 2000 V cm\may be applied across the separation channels, hence shortening the analytical time scale to minutes or even seconds. With continuous matur-ity of relevant technologies, such an ultra-high speed separation method may provide a solution to some formidable tasks including DNA sequencing.
See also: II/Electrophoresis: Electrochromatography Thin Layer.
Further Reading
Baker DR (1995) Capillary Electrophoresis. New York: Wiley.
Engelhardt H, Beck W and Schmitt T (1996) Capillary Electrophoresis: Methods and Potentials. Braun-schweig/Wieshaden: Vieweg.
Guzman NA (ed.) (1993)Capillary Electrophoresis Tech-nology. New York: Marcel Dekker.
Jorgenson JW and Phillips M (eds) (1987)New Directions in Electrophoretic Method. Washington, DC: American Chemical Society.
Kevin DA (ed.) (1996) Capillary Electrophoresis Guide-book:Principles,Operation and Applications. Totowa, NJ: Humana Press.
Kuhn R and Hoffstetter-Kuhn S (1993) Capillary Elec-trophoresis:Principles and Practice. Berlin/New York: Springer-Verlag.
Landers JP (ed.) (1997) Handbook of Capillary Elec-trophoresis, 2nd edn. Boca Raton, FL: CRC Press. Li SFY (1992)Capillary Electrophoresis:Principles,
Prac-tice and Applications. Amsterdam: Elsevier.
Vindevogel J and Sandra P (1992)Introduction to Micellar Electrokinetic Chromatography. Heidelberg: Huthig. Weinberger R (1993)Practical Capillary Electrophoresis.