Munich Personal RePEc Archive
Does Intelligence Affect Economic
Diversification?
Kodila-Tedika, Oasis and Asongu, Simplice A
August 2014
Online at
https://mpra.ub.uni-muenchen.de/66601/
1
AFRICAN GOVERNANCE AND DEVELOPMENT
INSTITUTE
A G D I Working Paper
WP/14/039
Does Intelligence Affect Economic Diversification?
Oasis Kodila-Tedika Université de Kinshasa Département d’Economie
Simplice A. Asongu
2 © 2014 African Governance and Development Institute WP/14/039
AGDI Working Paper
Research Department
Does Intelligence Affect Economic Diversification?
Oasis Kodila-Tedika & Simplice A. ASONGU
August 2014
Abstract
This paper extends the growing literature on knowledge economy by investigating the effect of intelligence on economic diversification. Using a battery of estimation techniques that are robust to endogeneity, we find that human capital has positive correlations with export diversification, manufactured added value and export manufactures. This empirical evidence is based on a world sample for the year 2010. The findings have significant implications for the fight against the Dutch disease. In essence, investing in human capital could bring economic diversity and therefore dampen negative external shocks related to resource-dependence. Other knowledge-economy implications are discussed.
Keywords: Intelligence; Economic Diversification
JEL Codes: O1; O4; O55; I32; I2
1. Introduction
3
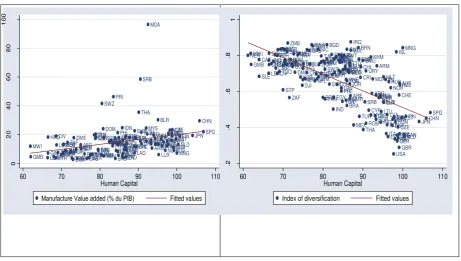
Figure 1. Human Capital and Economic diversification
As far as we are concerned, the consideration of human capital in a plethora of regressions implies that this underlying variable is useful in economic diversification. In the present exposition, we consider this indicator as an independent variable of interest. Moreover, we are convinced human capital is very useful when considered in an economic structure. Hence, economic sectors should be attracted by more qualified human capital. This could be the basis for labour reallocations from the agricultural to more productive sectors. Externalities resulting from human capital accumulation could result from low economic diversification. Accordingly, an economy that is highly focused on a certain brand reduces interaction among persons and hence increases competition, which could eventually discourage cooperation. Conversely, increasing human capital remains essential for economic sophistication.
As far as we have reviewed, Parketa & Tamberi (2008) and Gullstrand (2008) are some of the few theoretical studies linking human capital to economic diversification. The first-two authors articulate that more human capital facilitates production diversification and hence, increase the rate of new activities in an economy, notably due to product innovation. Gullstrand thinks it enables the differentiations within the framework of intra-industrial commercial models. AFG AGO ALB ARE ARG ARM AUS AUT AZE BDI BGD BGR BHS BIH BLR BOL BRA BRN BTN BWA CHL CHN CIV COG COL CRI CUB CZE DMA DNK DOM ECU EGY EST ETH FIN FJI GAB GBR GEO GER GHA GIN GMB GTM GUY HND HRV HUN IDN IND ITA JAM JOR JPN KAZ KEN KHM LAO LBN LBR LKA LSO LUX LVA MAR MDA MDV MEX MKD MLT MNE MNG MOZ MRT MUS MWI MYS NAM NIC NLD NOR NPL PAK PAN PER PHL POL PRI PRT PRY ROM RUS RWASDNSAU
SEN
SLV SPG SRB
SUR SVKSVN SWE SWZ TGO THA TJK TON TTO TUN TUR TZA UGA UKR URY USA UZB VEN VNM YEM ZAF ZAR ZMB ZWE 0 20 40 60 80 1 0 0
60 70 80 90 100 110 Human Capital
Manufacture Value added (% du PIB) Fitted values
AFG AGO ALB ARE ARG ARM AUS AUT AZE BDI BEL BEN BFA BGD BGR BHR BHS BIH BLR BLZ BMU BOL BRA BRB BRN BTN BWA CAF CAN CHE CHL CHN CIV CMR COG COL COM CPV CRI CUB CYP CZE DJI DMA DNK DOM DZA ECU EGY ERI ESP EST ETH FIN FJI FRA GAB GBR GEO GER GHA GIN GMB GNB GNQ
GRC GTM GUY HND HRV HTI HUN IDN IND IRL IRN IRQ ISL ISR ITA JAM JOR JPN KAZ KEN KGZ KHM KWT LAO LBN LBR LBY LKA LSO LTU LUX LVA MAR MDA MDV MEX MGD MLI MLT MMR MNE MNG MOZ MRT MUS MWI MYS NAM NER NGA NIC NLD NOR NPL NZL OMN PAK PAN PER PHL POL PRT PRY QAT ROM RUS RWA SAU SDN SEN SLE SLV SOM SPG SRB STP SUR SVK SVN SWE SWZ SYC SYR TCD TGO THA TJK TKM TON TTO TUN TUR UGA UKR URY USA UZB VEN VNM VUT YEM ZAF ZAR ZMB ZWE .2 .4 .6 .8 1
60 70 80 90 100 110 Human Capital
4
Another contribution of the present study is to seriously investigate the issue of endogeneity by taking into account instrumental variables. This provides a more informed opinion on the relationship between the two underlying variables. This knowledge is quite relevant in complementing the literature given the substantial bulk of studies on the importance of diversification in economic development (Piñeres & Ferrantino, 1997 ; Feenstra et al., 1999; Al-Marhubi, 2000; Funke & Ruhwedel, 2005; Herzer & Nowak-Lehnmann, 200; Hausmann et al., 2007; Hess, 2008; Jarreau & Poncet, 2012).
The third contribution of the current exposition to the literature is the measurement of human capital. Economists have traditionally appreciated human capital using quantitative measures and qualitative educational indicators, with the former more exploited (Lutz, 2009). The traditional indicators are predominantly used in growth regressions, inter alia: average years of schooling, life expectancy at school, gross schooling rate in the primary, secondary and tertiary schools (see Barro, 1991; Benhabib & Spiegel, 1994; Barro & Lee, 1993, 2001; Caselli et al., 1996; Mankiw et al., 1992 ; Levine & Renelt, 1992; Sala-i-Martin et al., 2004). The effects of these indicators have not yielded a consensus because of data measurement issues (Cohen & Soto, 2007; De la Fuente & Doménech, 2006). Notably, Weede & Kämpf (2002) have criticised the neglect of output in these human capital indicators, which essentially relies on inputs. This has led to some authors using international academic evaluation tests, notably: Trends in International Mathematics and Science Study (TIMSS) and the Program of International Student Assessment (PISA) (Hanushek & Kimko, 2000; Hanushek &Woessmann, 2008, 2009).
Another strand of authors including the psychologist and Vanhanen (2001,2002, 2006) has compiled data on intellectual quotient (IQ) from many countries. This data has led to many published studies (Lynn & Vanhanen, 2012b). This data is also increasingly being employed by economists (Weede & Kämpf, 2002; Jones & Schneider, 2006; Ram, 2007; Potrafke, 2012; Kodila-Tedika & Kanyama-Kalonda, 2014; Kodila-Tedika, 2014; Rindermann et al., 2014; Kodila-Tedika & Mustacu, 2014; Kodila-Tedika & Bolito-Losembe, 2014). The stream of data from Hanushek and, Lynn & Vanhenen is increasingly being improved and has recently been improved (Rindermann, 2007a, b; Meisenberg & Lynn, 2011). Meisenberg & Lynn, (2012) and Kanyama-Kalonda (2014) have recently employed this new stream of data. In the present study, we also borrow from this new stream.
5
outliers, a plethora of estimation techniques as well as the inclusion of control variables. We have also considered the hypothesis of causality flowing from human capital to economic diversification. Our estimations suggest a positive effect of this capital on diversification. Hence, more human capital engenders greater economic diversification. This conclusion contributes to the literature on economic diversification in the areas already discussed above.
The rest of the paper is structured as follows. Section 2 discusses the methodology while Section 3 focuses on the data. The main results are presented in Section 4 whereas Section 5 concludes.
2. An Empirical Model Linking Economic Diversification to Human Capital
The main hypothesis of this investigation sustains that Human Capital (HC) has a significant and positive impact on Economic Diversification (EC). As a primary first-step, we estimate the following basic empirical model:
where ED is economic diversification, HC denotes the human capital, i=1,2... captures the country index, Z = (z1,… zk) is the vector of control variables, and εi represents the error term
that is assumed to be normally and independently distributed. 0 is the intercept, 1 captures the effect of human capital and =(1, 2,.. n) is the parameter denoting the vector for control variables. The control variables used are consistent with those employed by Hausmann et al. (2007). The model is estimated using Ordinary Least Squares (OLS) that are robust to standard errors. As emphasized by Hausmann et al. (2007), if is the cause of the endogeneity and hence, reverse causality, ED should be regressed with only the exogenous component of HC in order to correct the bias in endogeneity.
The endogeneity issue is corrected by employing a Two-stage-least squares (2SLS) estimation technique. In the first-stage, we regress the endogenous component of HC in an OLS equation as follows:
6
In the second-stage of the regression, we insert the fitted values from Eq. (3) into Eq. (1). Hence, we replace HC with in Eq. (1), to obtain the following OLS equation:
The concern arising from Eq. (4) is to investigate if the fitted values are good instruments for human capital. This issue is handled by an overidentification restrictions test in the empirical section of the paper. Moreover, to ensure robustness we shall employ at least two instruments to mitigate the endogeneity concern.
3. Data
We examine a world sample of ……countries for the year 2010.The concept of diversification is employed to emphasise the development of the productive industry which improves the economic structure towards modern economic activities. It is also the source of positive externalities for other sectors. Hence, this concept underlines export diversification. Accordingly, we measure economic diversification with the annual comparative diversification index of export and import of commodities (CNUCED, UNCTADstat). Low values of this variable denote high levels of diversification in a given country. We therefore expect the human capital variable to have a negative effect on this dependent variable. This is contrary to what we expect of two other variables. Our second variable is the added value of the manufacturing sector to GDP from World Development Indicators (WDI) of the World Bank (WB). The third indicator that we employ to measure economic diversification is a binary variable, taking the values of 1 if the country is a major exporter. Major export category: substantial exports are those that account for 50 percent or more of total exports of goods and services from one category, in the period 1988-92. The categories are: nonfuel primary (SITC 0,1,2,4, plus 68), fuels (SITC 3), manufactures (SITC 5 to 9, less 68), and services (factor and nonfactor service receipts plus workers' remittances). If no single category accounts for 50 percent or more of total exports, the economy is classified as diversified. This measurement is consistent with Easterly & Sewadej (2001).
7
With regard to institutional quality, we consider IQ as a measure of the ability of a nation's human capital to cooperate in order to produce a nationally efficient outcome in terms of pro-market policies. The advantage of the recent dataset is that it includes more countries as well as a composite measure of intelligence in the form of human capital.
Three measures of intelligence are considered: the IQ measure from Lynn & Vanhanen, a measure where the missing values are filled with school achievement, and a measure of human capital which is a composite measure that accounts for IQ and school achievement. However, since the first measure is a subset of the second, we shall only use the second and the third measures in our analysis.
The measures of institutional quality are obtained from the dataset compiled by Daniel
Kaufmann, and Art Kraay and Massimo Mastruzzi at the World Bank
(www.govindicators.org). This dataset aggregates indicators of six broad dimensions of governance: voice &accountability, political stability & absence of violence/terrorism, government effectiveness, regulatory quality, rule of law and control of corruption. The six aggregate indicators are based on 30 underlying data sources reporting the perceptions of governance from a large number of survey respondents and expert assessments worldwide. We use only rule of law.
The data on GDP per capita and openness are obtained from Pen World Tables, the 7.1 version. The relevance of the GDP per capita (Imbs & Wacziarg, 2003; De Benedictis et al., 2009; Parteka, 2007; Cadot et al., 2007) and openness indicators have been substantially documented in the literature (Krugman & Venables 1990; Costas et al. 2008).
The data on population and area is from the WDI of World Bank. The works of Hummels & Klenow (2005) and Parteka & Tamberi (2008) have clearly articulated the important role of economic size in economic diversification. Population size here is considered as a measure of this market size. Given that geographic elements (Radelet & Sachs, 1998; Limão & Venables, 2001) can also influence the dependent variable; we have considered the effect of Area in the analysis.
8
Table 1: Summary Statistics
Variables Obs Mean Std. Dev. Min Max
Index of diversification 182 .66 .15 .25 .88
Manufacture – value added (%GDP) 139 14.64 11.17 2.12 96.58
Exports of manufactures 139 .17 .38 0 1
Human capital 175 84.21 10.85 61.2 106.9
Open 140 95.42 57.16 26.65 446.06
GDP per capita (log) 140 8.873 1.19 5.90 11.17
Rule of law 139 .013 .99 -1.75 1.95
Population 123 16.53 63.11 -13.54 612.36
Area 123 381.13 1020.2 .122 8600.39
Obs : Observations. Std. Dev: Standard Deviation. Min: Minimum. Max: Maximum.
4. Empirical results
4.1 Main results
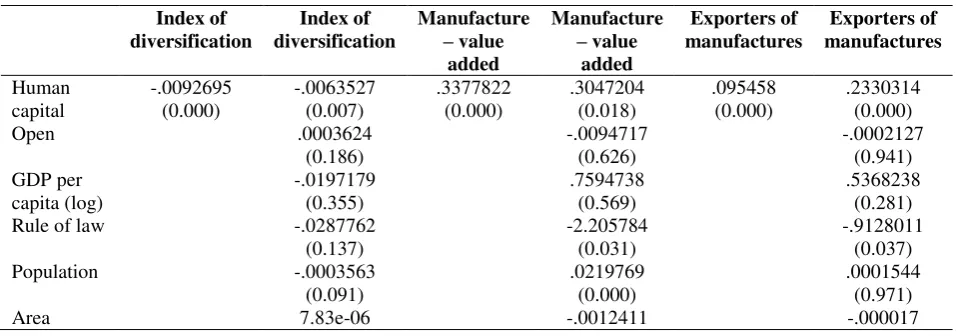
The main result are based on OLS and Probit estimators that are robust to White’s (1980) heteroskedasticity correction, are presented in Table 2 below. The following conclusions are established. First, when the dependent variable is the index of diversification, while Area and Openness decrease economic diversification, the other variables have the opposite effect, notably: human capital, GDP per capita, rule of law and population. Second, when economic diversification is either measured by Manufacture value or Exporters of manufactures added value, human capital increases economic diversification, consistent with the predictions of economic theory. With the exception of the rule of law which consistently increases economic diversification across all specifications (with the alternative dependent variables), the other control variables for second and third dependent variables consistently display opposite signs. This opposition in signs is expected because one of the dependent variables (or diversification index) is appreciated in decreasing order, such that higher values denote low diversification and vice-versa.
Table 2. Main regressions Index of diversification
Index of diversification
Manufacture
– value added
Manufacture
– value added
Exporters of manufactures
Exporters of manufactures
Human capital
-.0092695 (0.000)
-.0063527 (0.007)
.3377822 (0.000)
.3047204 (0.018)
.095458 (0.000)
.2330314 (0.000)
Open .0003624
(0.186)
-.0094717 (0.626)
-.0002127 (0.941) GDP per
capita (log)
-.0197179 (0.355)
.7594738 (0.569)
.5368238 (0.281)
Rule of law -.0287762
(0.137)
-2.205784 (0.031)
-.9128011 (0.037)
Population -.0003563
(0.091)
.0219769 (0.000)
.0001544 (0.971)
[image:9.595.65.545.584.752.2]9
(0.505) (0.002) (0.910)
Adj R² 0.4356 0.4948 0.0972 0.1951
Pseudo R2 0.3015 0.4833
Obs 170 112 125 83 173 115
Method OLS OLS OLS OLS Probit Probit
Notes: For OLS regressions, the heteroscedasticity correction is consistent with White. Constants are included in all regressions. P-values in brackets.
4..2 Robustness checks
4.2.1 Additional variables and fixed effects
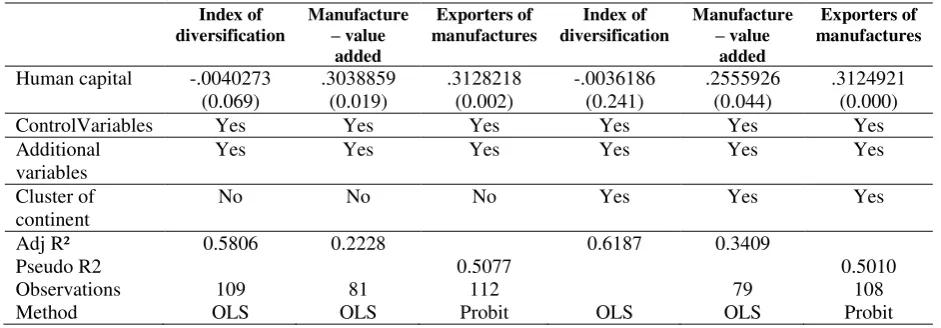
[image:10.595.63.534.411.575.2]In this section, three more control variables are added to verify the solidity of estimations in Table 2. In Table 3, additional continental clusters and more control variables are used. The additional control variables include: a dummy variable for the Organisation for Economic Co-operation and Development (OECD) membership, corruption from WDI and shadow economy from Schneider et al. (2010). The effects of human capital on the dependent variables are significant for the most part across specifications and broadly consistent with those of Table 3.
Table 3. Additional variable and clusters
Index of diversification
Manufacture
– value added
Exporters of manufactures
Index of diversification
Manufacture
– value added
Exporters of manufactures
Human capital -.0040273 (0.069)
.3038859 (0.019)
.3128218 (0.002)
-.0036186 (0.241)
.2555926 (0.044)
.3124921 (0.000)
ControlVariables Yes Yes Yes Yes Yes Yes
Additional variables
Yes Yes Yes Yes Yes Yes
Cluster of continent
No No No Yes Yes Yes
Adj R² 0.5806 0.2228 0.6187 0.3409
Pseudo R2 0.5077 0.5010
Observations 109 81 112 79 108
Method OLS OLS Probit OLS OLS Probit
Notes: For OLS regressions, the heteroscedasticity correction is consistent with White. Constants are included in all regressions. P-values in brackets
10
Table 4. Using regional dummies
Index of diversification
Manufacture – value added
Exporters of manufactures
Human capital -.0050032
(0.040)
.065878 (0.618)
.2854369 (0.004)
Variables controls Yes Yes Yes
Dummy régional Yes Yes Yes
Adj R² 0.50 0.2762
Pseudo R2 0.3778
Observations 111 82 52
Method OLS OLS Probit
Note: For OLS regressions, the heteroscedasticity correction is consistent with White. Constants are included in all regressions. P-values in brackets
4.2.2 Outlier variables
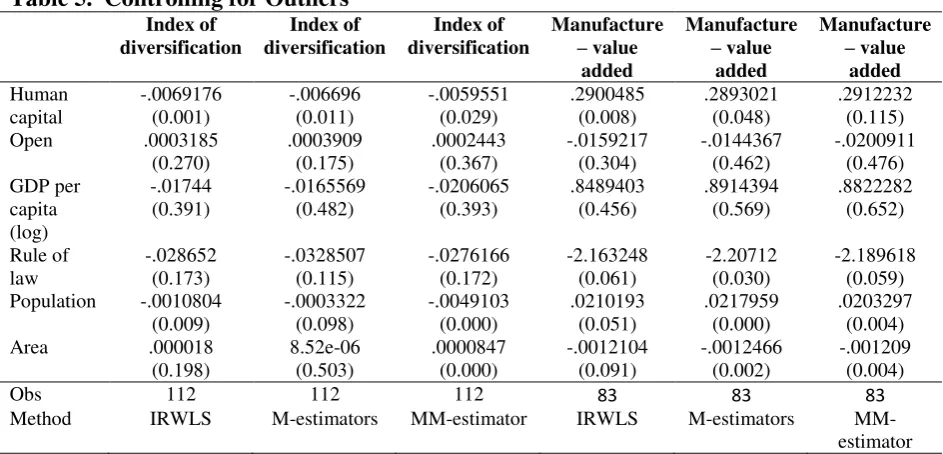
In order to further improve the estimations, our empirical approach follows the M-estimators of Huber (1973) by using iteratively reweighted least squares (IRWLS) and MM-estimator proposed by Yohai (1987). As Midi & Talib (2008) have noted, compared to the OLS approach, the advantage of these robust estimators is that they fix simultaneously any issue arising from the existence of outliers and/or heteroskedasticity (non-constant error variances). As far as we know, these regression techniques are not currently available for logistic specifications. Hence, our third dependent variable is not used. We find that the signs and significance of the variables across specifications are consistent with those of the preceding tables.
Table 5. Controlling for Outliers Index of diversification Index of diversification Index of diversification Manufacture
– value added
Manufacture
– value added
Manufacture
– value added Human capital -.0069176 (0.001) -.006696 (0.011) -.0059551 (0.029) .2900485 (0.008) .2893021 (0.048) .2912232 (0.115)
Open .0003185
(0.270) .0003909 (0.175) .0002443 (0.367) -.0159217 (0.304) -.0144367 (0.462) -.0200911 (0.476) GDP per capita (log) -.01744 (0.391) -.0165569 (0.482) -.0206065 (0.393) .8489403 (0.456) .8914394 (0.569) .8822282 (0.652) Rule of law -.028652 (0.173) -.0328507 (0.115) -.0276166 (0.172) -2.163248 (0.061) -2.20712 (0.030) -2.189618 (0.059) Population -.0010804
(0.009) -.0003322 (0.098) -.0049103 (0.000) .0210193 (0.051) .0217959 (0.000) .0203297 (0.004)
Area .000018
(0.198) 8.52e-06 (0.503) .0000847 (0.000) -.0012104 (0.091) -.0012466 (0.002) -.001209 (0.004)
Obs 112 112 112 83 83 83
Method IRWLS M-estimators MM-estimator IRWLS M-estimators
MM-estimator
[image:11.595.66.538.499.726.2]11
4.2.3. Endogeneity test
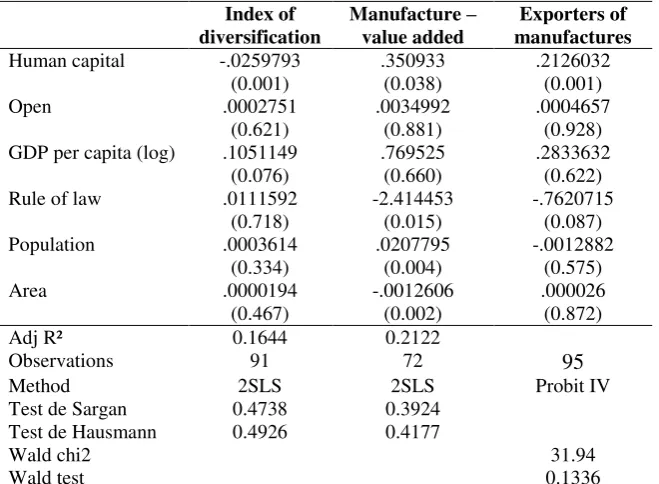
[image:12.595.135.465.287.529.2]In order to control for endogeneity, we employ instruments of protein and fats per capita daily macronutrients for 2005–2007 (FAO1 Statistics Division, 2010), human capital accumulation in the early twentieth century and Historic IQ (Lynn, 2012). Data on students enrolled in primary and secondary schools in the early twentieth century is from Mitchell (2003a, b, c). The first-two instruments are exploited in the first column whereas the first and third are exploited in the other two columns. The sign of the main independent variables remains unchanged while most of the significant control variables have the expected signs.
Table 6. Controlling for endogeneity Index of diversification
Manufacture – value added
Exporters of manufactures
Human capital -.0259793 (0.001)
.350933 (0.038)
.2126032 (0.001)
Open .0002751
(0.621)
.0034992 (0.881)
.0004657 (0.928) GDP per capita (log) .1051149
(0.076)
.769525 (0.660)
.2833632 (0.622)
Rule of law .0111592
(0.718)
-2.414453 (0.015)
-.7620715 (0.087)
Population .0003614
(0.334)
.0207795 (0.004)
-.0012882 (0.575)
Area .0000194
(0.467)
-.0012606 (0.002)
.000026 (0.872)
Adj R² 0.1644 0.2122
Observations 91 72 95
Method 2SLS 2SLS Probit IV
Test de Sargan 0.4738 0.3924
Test de Hausmann 0.4926 0.4177
Wald chi2 31.94
Wald test 0.1336
Notes: Constants are included in all regressions. P-values in brackets. 2SLS: Two-Stage-Least Squares. IV: Instrumental Variable.
The main policy implication is centred on the positive effect of human capital on: export diversification, manufactured added value and export manufactures. Hence, this has a potential to mitigate the Dutch disease in resource-dependent countries. In essence, investing in human capital (especially in least developed countries) would bring economic diversity and therefore dampen negative external shocks related to resource-dependence. As recently shown by Tchamyou (2014) and Asongu (2014ab), South Korea’s economic miracle substantially depended on the enhancing of human capital. Two important points emerge here: the need to
1
12
boost college enrolment and research & development (R&D) on the one hand; and the imperative for workers to adapt to challenging and changing conditions of technology.
First, countries need to adopt very bold moves towards increasing school enrolment rates and allocating more budgets to R&D. Such measures should be implemented hand-in-glove with improvements in other areas like policy and institutional environments. These include, inter alia: capacity building and independence of government agencies. It is expected that education should enhance a country’s possibilities of acquiring knowledge, novel know-how and technological abilities. This combination of policies would produce and strengthened blocks is learning activities, human resource development and economic diversification ( Suh & Chen, 2007; Lee, 2009; Tchamyou, 2014; Asongu, 2014a).
Second, the policy of education needs to be one of lifelong-learning and should be fully implemented in the workplace to enhance adaptation to changing and evolving technology. Moreover, technical apprenticeship and vocational trainings would substantially boost the possibilities for economic diversification. Continuous trainings at work places should also be encouraged. Nurturing of high calibre engineers and scientists capable of analysing the needs for economic diversification and adapting know-how to existing challenges is crucial for competitive advantage in the global economic environment. This is also true because, as nations grow, technological competence becomes critical to sustaining growth and development. In order to continuously exploit economic diversification opportunities on the boundaries of science and technologies, knowledge-economy based policies should be fundamental to economic policy. As shown by Such & Chen (2007), when educational and industrialisation policies converge within a single strategic umbrella, the effects in enhancing and sustaining development are substantial. Accordingly, education would produce technology-base learning and industrialisation that have positive effects on economic diversification. On the other hand, accelerating industrialisation and economic diversification would promote the demand for more skills. This policy is consistent with the findings of Tchamyou (2014) who has recently established the positive effect of knowledge economy on doing business.
13
Conclusion
This paper has extended the growing literature on knowledge economy by investigating the effect of intelligence on economic diversification. Using a battery of estimation techniques that are robust to endogeneity, we have found that human capital has positive effects on export diversification, manufactured added value and export manufactures. This empirical evidence is based on a world sample for the period 2010. The findings have significant implications for the fight against the Dutch disease. In essence, investing in human capital could bring economic diversity and therefore dampen negative external shocks related to resource-dependence. Other knowledge-economy implications have been discussed, notably: the need to boost college enrolment and research & development on the one hand; and the imperative for workers to adapt to challenging and changing conditions of technology within a lifelong learning policy framework.
References
Al-marhubi, F. (2000). “Export diversification and growth: an empirical investigation”. Applied economics letters , 7(9): 559–562.
Asongu, S. A., (2014a). “Knowledge Economy Gaps, Policy Syndromes and Catch-Up Strategies: Fresh South Korean Lessons to Africa”, African Governance and Development Institute Working paper, No. 14/014.
Asongu, S. A., (2014b). “Software piracy and scientific publications: knowledge economy evidence from Africa”, Africa Development Review: Forthcoming.
Barro, R., 1991. Economic Growth in a Cross-Section of Countries. Quarterly Journal of Economics
106, 407–443.
Benhabib, J. and Spiegel, M. 1994. The Role of Human Capital in Economic Development: Evidence from Aggregate Cross-Country Data. Journal of Monetary Economics 34, 143–173.
Cadot, O., Carrère, C. and Strauss-Kahn, V. (2007). “Export diversification: what’s behind the hump?”. Centre for Economic Policy Research Discussion Paper, No. 6590.
Caselli, F., Ciccone, A. (2013), The Contribution of Schooling in Development Accounting: Results from a Nonparametric UpperBound, Journal of Development Economics, 1-13, http://dx.doi.org/10.1016/j.jdeveco.2013.02.006
Caselli, Francesco, Esquivel, Gerardo, Lefort, Fernando, 1996. Reopening the Convergence Debate: a New Look at Cross-Country Growth Empirics. Journal of Economic Growth 3, 363–389.
14 Costas, A., Demidova, S., Klenow, P. and Rodriguez-Clare, A. (2008). “Endogenous variety and the
gains from trade”. American Economic Review Papers and Proceedings, 98(2): 444–450.
De Benedictis, L., Gallegati, M. and Tamberi, M. (2009). “Overall specialisation and development:countries diversify”. The Review of World Economics, 145(1): 37–55.
De la Fuente, A. & Doménech, R. (2006) Human Capital in Growth Regressions: How Much Difference Does DataQuality Make? Journal of the European Economic Association 4: 1-36. Easterly, W and Sewadeh, M. (2001), Global Development Network Growth Database (GDN)
Dobrinsky, R., (2008). “Knowledge-Oriented Diversification Strategies: Policy Options for Transition Economies”, UN Commission for Europe,
http://www.un.org/en/development/desa/policy/publications/general_assembly/eitconference/ 4aprpm_dobrinsky.pdf (Accessed: 18/10/2014).
FAO Statistics Division (2010). Food Balance Sheets. Rome, Italy: Food and Agriculture Organization of the United Nations.
Feenstra, R., Madani, D., Yang, T. and Liang, C. (1999). "Testing endogenous growth in South Korea and Taiwan", Journal of Development Economics, 60(2): 317–341.
Funke, M., and Ruhwedel R. (2005). ”Export variety and economic growth in East European transition economies”. Economics of Transition, 13 (1): 25–50.
Gullstrand, J. (2000). Country-Specific Determinants od Vertical Intra-Industry Trade With Application to Trade Between Poland and EU, [in:] B. Wawrzynjak (Ed.), Globalisation and Change – Ways to Future, Leon Kozminski Academy of Enterpreneurship and Management, Warsaw.
Hanushek, E. A. & Woessmann, L. (2008). The Role of Cognitive Skills in Economic Development.
Journal of Economic Literature, 46(3), 607-668.
Hanushek, E. A., & Kimko, D. D. (2000). Schooling, Labor-Force Quality, and the Growth of Nations.
American Economic Review, 90, 1184-1208.
Hanushek, E.A. & Woessmann, L. (2009) Do better schools lead to more growth? Cognitive skills, economicoutcomes, and causation. IZA Discussion Papers No. 4575
Hausmann, R., Hwang, J. and Rodrik, D. 2007. What you export matters. Journal of Economic Growth 12 (1), 1–25.
Herzer, D. and Nowak-Lehmann, F. (2006). “What does export diversification do for growth? An Econometric Analysis”. Applied Economics, Vol. 38 (15), S. 1825–1838.
Hess, H. 2008. “Export Diversification and Growth” Working Paper No. 21, Growth Commission, World Bank, Washington DC.
Huber, P.J. (1973). Robust Regression: Asymptotics, Conjectures and Monte Carlo, The Annals of Statistics, 1: 799-821.
Hummels, D. and Klenow, P. (2005). “The variety and quality of a nation’s exports”. The American Economic Review 95(3): 704-723.
Imbs, J. and Wacziarg, R. (2003). "Stages of diversification," American Economic Review, 93(1): 63– 86.
Jarreau, J., Poncet, S. 2012. Export sophistication and economic growth: evidence from China. Journal of Development Economics 97 (2), 281-292.
Jones, G. & Schneider, W. J. (2006). Intelligence, human capital, andeconomic growth: A Bayesian Averaging of Classical Estimates (BACE)approach. Journal of Economic Growth, 11, 71-93. Kalonda-Kanyama I, Kodila-Tedika O (2012). Quality of Institutions: Does Intelligence Matter?,
Working Papers 308. Economic Research Southern Africa.
Kodila-Tedika and Cinyabuguma, M. 2014. HIV/AIDS, Intelligence and Human Capital : Exploration New, mimeo.
Kodila-Tedika, 2014, Governance and Intelligence: Empirical Analysis from African Data, forthcoming in the Journal of African Development
Kodila-Tedika, O. and Bolito-Losembe, R. 2014, Poverty and Intelligence: Evidence Using Quantile Regression, Economiic Researrch Guarrdiian, (1): 25-32.
15 Krueger, Alan, Lindhal, Mikael, 2001. Education for growth: why and for whom? Journal of
Economic Literature XXXIX, 1101–1136.
Krugman, P. (1981). Intraindustry specialisation and the gains from trade. The Journal of Political Economy, 89(5): 959–973.
Krugman, P. and Venables, A. (1990). Integration and the competitiveness of peripheral industry. [in:] Bliss C. and J. Braga de Macedo (Eds.). Unity with diversity in the European economy: the Community's southern frontier. Cambridge University Press, Cambridge.
Lee, K., (2009), “How Can Korea be a Role Model for Catch-up Development? A ‘Capability- based’ View”, UN-WIDER Research Paper No. 2009/34.
Levine, R. & Renelt, D.(1992) A sensitivity analysis of cross-country growth regressions.
AmericanEconomic Review 82: 942-963.
Limão, N. and Venables, A. (2001). “Infrastructure, geographical distance, transport costs and trade”.
World Bank economic review, 15(3): 451–479.
Lutz, W. (2009) Sola schola et sanitate: human capital as the root cause and priority for international development? Philosophical Transactions of the Royal Society B 364: 3031-3047
Lynn, R. & Vanhanen, T. (2001) National IQ and economic development: a study of eighty-one nations. Mankind Quarterly 41: 415-435.
Lynn, R. & Vanhanen, T. (2002) IQ and the Wealth of Nations. Westport CT: Praeger.
Lynn, R. & Vanhanen, T. (2006) IQ and Global Inequality. Augusta GA: Washington Summit.
Lynn, R. & Vanhanen, T.(2012a) Intelligence. A Unifying Construct for the Social Sciences. London: Ulster Institute.
Lynn, R. (2012), IQs predict differences in the technological development of nations from 1000 BC through 2000 AD, Intelligence 40 (2012) 439–444.
Lynn, R., & Vanhanen, T. (2012b). National IQs: A review of their educational,cognitive, economic, political, demographic, sociological, epidemiological,geographic and climatic correlates.
Intelligence, http://dx.doi.org/10.1016/j.intell.2011.11.004.
Mankiw, Gregory, Romer, David, Weil, David, 1992. A contribution to the empirics of growth.
Quarterly Journal of Economics 107, 407–437.
Meisenberg, G. & Lynn, R. (2011). Intelligence: A measure of human capital in nations. Journal of Social, Political and Economic Studies, 36(4), 421-454.
Meisenberg, G. & Lynn, R. (2012). Cognitive Human Capital and Economic Growth:Defining the Causal Paths. Journal of Social, Political and Economic Studies, 37(4), 141-179.
Midi, H. and Talib, B.A. (2008). The Performance of Robust Estimator on Linear Regression Model Having both Continuous and Categorical Variables with Heteroscedastic Errors, Malaysian Journal of Mathematical Sciences, 2(1): 25-48.
Mitchell, B.R. (2003a) International Historical Statistics: Africa, Asia & Oceania, 1750–2001, 4th ed. (New York: Palgrave Macmillan).
Mitchell, B.R. (2003b) International Historical Statistics: Europe, 1750–2000, 5th ed. (New York: Palgrave Macmillan).
Mitchell, B.R. (2003c) International Historical Statistics: The Americas 1750–2000, 5th ed. (New York: Palgrave Macmillan).
Parteka, A. (2007). Employment and export specialisation patterns versus GDP per capita performance: unifying approach. Quaderno di Ricerca (WorkingPaper), No 302,Università Politecnica delle Marche, Dipartimento di Economia Universita'
Parteka, A. and Tamberi M., (2008). “Determinants of export diversification: an empirical investigation". Quaderno di Ricerca (WorkingPaper), No. 327, Politecnica delle Marche, Dipartimento di Economia Universita'
Piñeres, S. and Ferrantino, M. (1997). “Export diversification and structural dynamics in the growth process: A case study of Chile.” Journal of Development Economics , 52, 375–391.
Potrafke, N. (2012). Intelligence and corruption. Economics Letters, 114,109-112.
Radelet, S. and Sachs, J. (1998). “Shipping Costs, Manufactured Exports, and Economic Growth.” Draft paper presented at the American Economic Association meetings, (January).
Ram, R. (2007). IQ and economic growth: Further augmentation ofMankiw-Romer-Weil model.
16 Rindermann, H. (2007a). Intelligence, cognitive abilities, human capital, and rationality at
differentlevels. Psychologische Rundschau, 58(2), 137-145.
Rindermann, H. (2007b). The g-factor of international cognitive ability comparisons: The homogeneity of results in PISA, TIMSS, PIRLS and IQ-tests across nations. European Journal of Personality, 21, 667-706.
Rindermann, H., Kodila-Tedika, O. & & Christainsen, G. 2014. "Cognitive capital, governance, and the wealth of nations," MPRA Paper 57563, University Library of Munich, Germany.
Sala-i-Martin, X., Doppelhofer, G. & Miller, R.I.(2004) Determinants of long-term growth: a Bayesian averaging of classicalestimates (BACE) approach. American Economic Review 94: 813-835. Schneider, F., A. Buehn and C.E. Montenegro (2010) “Shadow economies all over the world: new
estimates for 162 countries from 1999 to 2007,” Policy Research Working Paper Series 5356, The World Bank.
Suh, J., & Chen, D. H. C., (2007). “Korea as a Knowledge Economy. Evolutionary Process and Lessons Learned”, Korea Development Institute,
https://www.usp.ac.fj/worldbank2009/frame/Documents/Publications_regional/409300PAPER0 KR101OFFICIAL0USE0ONLY1.pdf (Accessed: 18/10/2014).
Tchamyou, S. V., (2014). “The Role of Knowledge Economy in African Business”, Master Thesis. HEC-Management School, University of Liège.
Verardi, V. and C. Croux (2009).Robust regression in Stata. The Stata Journal 9: 439-453.
Weede, E. & Kämpf, S. (2002). The impact of intelligence and institutionalimprovements on economic growth. Kyklos, 55, 361-380.
Weldemicael, E. 2010, Determinants of Export Sophistication