DEVELOPMENT AND VALIDATION OF STABILITY INDICATING
RP-HPLC METHOD FOR ANALYSIS OF ACYCLOVIR IN API AND
PHARMACEUTICAL DOSAGE FORM
Atul Musmade1, Hemant Jain2* and Rohit Prajapati3
1Department Quality Assurance Techniques, STES’s, Sinhgad College of Pharmacy,
Vadgaon (Bk.), Pune- 411041, Maharashtra, India.
2SPTM, SVKM’s NMIMS, Shirpur, Dhule-425 405, Maharashtra, India.
ABSTRACT
A rapid stability indicating RP-HPLC method was developed and
validated for determination of Acyclovir in bulk and tablet dosage
form. Sample was analysed on a Kromasil ODS C18 column (250 × 4.6
mm, 5µ). The mobile phase consist of MeCN: Ammonium acetate
buffer (pH 4.5) in the ratio of 50:50 at a flow rate 1 ml min-1 with UV
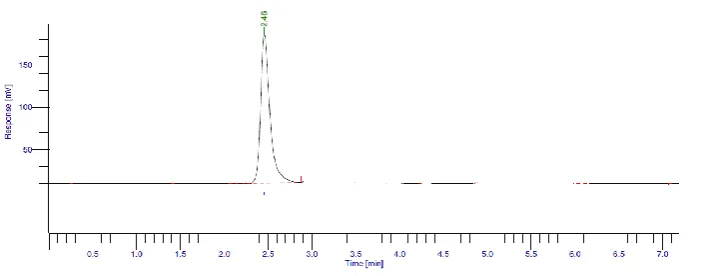
detection wavelength at 253 nm. The retention time of Acyclovir was
2.47 minutes. The calibration curve was linear over the concentration
range of 10-60 µg/ml (r2=0.998) Acyclovir was found to degrade in
alkaline and oxidative stress conditions. However it was stable in acid
and dry heat conditions. The validation studies were carried out
according to ICH guidlines, The developed method was found to be
linear, precise, accurate and robust.
KEYWORDS: Acyclovir, ICH, Validation, RP-HPLC.
INTRODUCTION
Acyclovir (ACV) [(9,2-ethoxyhydroxy) methyl guanine] is a nucleoside analogue with
potent antiviral activity for herpes simplex viruses (HSV), varicella zoster virus (VZV),
Epstein- Barr virus and cytomegalovirus (CMV).[1,2] It is official in Indian Pharmacopoeia.[3]
Determination of acyclovir in bulk drugs and formulations by spectphotometric method, [4]
and chromatography method.[5-7] were reported. Acyclovir determination in biological
samples like serum,[8] skin layers,[9] plasma,[10] saliva and urine.[11] was subjected to extensive
study by RP-HPLC method. But none of the literature described validated stability indicating
Volume 4, Issue 8, 1043-1052. Research Article ISSN 2277– 7105
Article Received on 10 May 2015,
Revised on 05 June 2015, Accepted on 02 July 2015
*Correspondence for
Author
Dr. Hemant Kumar Jain
Department Quality Assurance Techniques, STES’s, Sinhgad College
of Pharmacy,
RP-HPLC method. A new method for the RP-HPLC analysis of acyclovir is described in this
paper. The method is substantially simpler, faster and more sensitive.
EXPERIMENTAL Instuments
A HPLC (Perkin Elmer Lambda 25) equipped with Perkin Elmer Binary LC Pump 200B/
250, solvent degasser, Series 200 UV/VIS detector and Kromasil ODS C18 column was used
with Total Chrome Navigator Software (version 6.3.1).
Chemical and Reagent
Pharmaceutical grade acyclovir was kindly provided by Lupin Ltd. Boiser, Mumbai and was
used as received. Proprietary drug Sitavig-50 mg. was purchased from local store. Analytical
reagent grade Ammonium acetate (Qualigens Fine Chemicals), MeCN (Merck Specialities
Private Limited), AcOH (Merck Specialities Private Limited) and distilled water filtered
through a 0.45 µm Millipore PVDF (polyvinyl difluoride) filter were used.
Standard solution
Accurately weighed quantity of acyclovir 10 mg was transferred to 100 ml volumetric flask
and made up to volume with diluent. Samples were dilute to concentration of 10, 20, 30,
40,50 and 60 µg ml-1 and used for validation study.
Assay of tablet formulation
Sitavig-50 mg were procured from local market. Tablet of Acyclovir equivalent to 49.7 mg
Of Acyclovir was accurately weighted and tranfered in to 100 ml volumetric flask. About 50
ml of diluent was added to dissolve the components present in tablet. The contents were
sonicated for 15 minutes with intermittent shaking and diluted up to the mark with the diluent
This solution was filtered through 0.45µm nylon filter, discarding first five ml of filtrate. The
sample solution was prepared in triplicate and 20µl volume of each sample solution was
injected in to the sample injector of RP-HPLC under the optimized chromatographic
condition (Table:1 ).
PROCEDURES
Method development and validation
A literature survey indicated that number of HPLC methods were developed and validated for
guideline Q1A (R2).[12] Thus method was developed which can used for quantification of
acyclovir and its degradation product and validated for linearity, accuracy, precision,
repeatability and robustness as per ICH guideline Q2 (R1).[13] Method was developed on a
reverse-phase Kromasil ODS C18 column (250 × 4.6 mm, 5µ) at ambient temperature with a
mobile phase consisting of MeCN:20 mM ammonium acetate buffer (pH 4.5) (50:50) at a
flow rate 1 ml min-1 with 20 µl injection volume. The detector wavelength was set at 253 nm
as determined by Perkin Elmer Lambda 25 UV/VIS spectrometer with distilled water as
solvent [Fig.2].
Force degradation studies
The force degradation studies were carried out under the conditions of hydrolysis, oxidation
and dry heat as described in ICH guideline Q1A (R2).[12] The approach suggested by Bakshi
and Singh.[15] was adopted for these studies. The drug solution prepared in stressor (e.g. HCl,
NaOH, H2O2) at concentration of 1 mg ml-1 was used for force degradation study. Acidic and
alkaline hydrolysis was carried out by heating acyclovir in 0.1 M HCl and 0.1 M NaOH at
60°C for 4 h and then samples were neutralised. The oxidative study was carried out in 3 %
v/v H2O2 at 60°C for 3 h. 0.1 ml neutralised sample of hydrolysis and oxidative study were
diluted with 10 ml diluent and injected into HPLC. For thermal degradation study, drug was
sealed in glass vial and heated at 80°C for 24 h then 10 µg ml-1 solution in diluent was
injected.
Method Development
The method utilising Methanol: Water as mobile phase yielded broad peak, whereas with
MeCN: Water tailing was observed with water as diluent. Procedure utilising Ammonium
acetate buffer (pH 4.5): Water as mobile phase with water as diluents also yielded tailing
where as with MeCN: Ammonium acetate buffer (pH 4.5) with MeCN: Water as diluent
sharp peak was obtained.
During method development, a number of variations were tested like pH, buffer
concentration, MeCN concentration and flow rate to give a symmetric peak. With a mobile
phase MeCN: 20mM ammonium acetate buffer (pH 4.5) (50:50) at flow rate 1 ml min-1 and
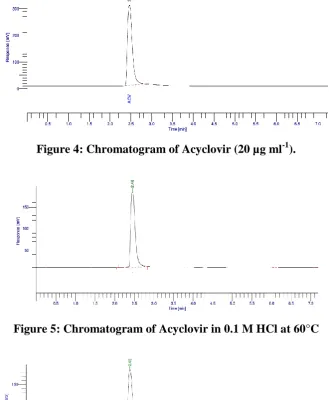
MeCN: Water (60:40), symmetric peak was obtained [Fig. 4].
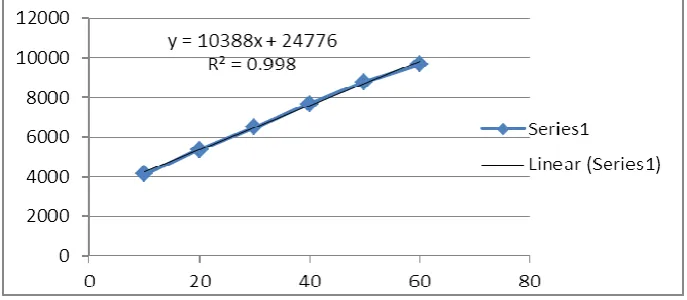
Validation Linearity
A linear calibration graph (y = 103887x + 24776; where y and x are peak area and
concentration, respectively) was obtained over six concentrations 10, 20, 30, 40, 50, 60 µg
ml-1 in triplicates with 20 µl injection volume. Correlation coefficient was found to be 0.9989
[Fig. 3].
Accuracy
Accuracy was evaluated at three different concentrations 4, 5 and 6 µg ml-1 equivalents to 80,
100 and 120% of the active ingredient. To a pre quantified sample solution known amount of
acyclovir was spiked then acyclovir amount was estimated by measuring the peak area and
fitting these values to the straight line equation of linearity curve. The recoveries at three
different concentrations were found to be within the range of 98 to 102% as per ICH
guidelines Q2 (R1).[17] Mean % recovery (mean ± SD) was found to be 99.83 ± 0.27 [Table
3].
Limit of detection (LOD) and Limit of Quantification (LOQ)
Four sets of known concentration (10-40µg/ml)were prepared . calibration curve plotted for
each set. LOD and LOQ were calculated using the formula as
Where,
= the standard deviation of the response.
S = Average of the slope of the calibration curves.
The results are discussed in Table:4
Precision
Intra-day precision of the method was determined by repeat analysis (three identical
injections) at three concentration levels. Inter-day precision was established by performing
the analysis next day on a freshly prepared solution. The low RSD values of Table 3 indicate
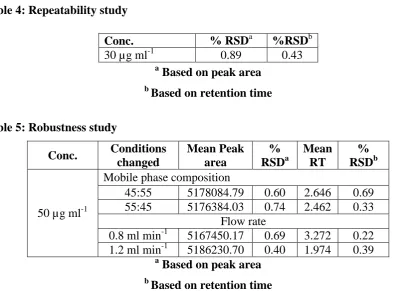
Repeatability
For repeatability study, 30 µg ml-1 acyclovir solution was analyzed six times on the same day.
% RSD was calculated for the resultant peak area and retention time as shown in Table 5.
Robustness
The robustness was assessed by altering the experimental conditions such as, by changing the
flow rate from 0.8 to 1.2 ml/min, the mobile phase composition with MeCN-ammonium
acetate buffer (pH 4.5) (55:45, 45:55) and analysed in triplicate.
In all varied Chromatographic conditions, there was no significant change in
chromatographic parameters. There was no effect of mobile phase composition on retention
time as seen in Table 6.
Degradation study Acid hydrolysis
Initially 0.1 M HCl was used for the degradation of acyclovir but it was found that the drug
was stable and no degradation was observed With 1M HCl no degradation was observed
which indicates that drug is stable to acid.
Alkali hydrolysis
Fig. 6 shows that drug degraded in 0.1 M NaOH at 60°C. At the end of 4 hrs it was degraded
to an extent of 9 % with retention time of degradation product at 4.490 minutes and that of
drug at 2.457 minutes.
Oxidative degradation
Drug was also degraded in 3 % H2O2 as seen in Fig. 7. At the end of 3 hrs 27 % degradation
was observed. Retention time of degradation product was 2.465 minutes and retention time of
drug was 2.783 minutes.
Thermal degradation
Shows no degradation at 80°C for 24 hrs. It indicated that the drug is stable to heat.
RESULT AND DISSCUSSION
The calibration curve was plotted of Acyclovir peak area v/s concentration. The generated
regression equation was y = 103887x +24776(R20.998). The R2 value as 0.999 indicates that
10-60µg/ml. The proposed method was found to be precise as % R.S.D. values for intraday as
well as interday precision was satisfactory. The drug at each of the 80%, 100% and 120%
levels 100.1, 99.95, 99.52 showed good recoveries . Hence it can be said that this method was
accurate. The LOD and LOQ were calculated as 0.015 µg/ml and 0.047 µg/ml, respectively.
The result of analysis of final formulation by the developed method consistent with the lable
claim, highly reproducible and reliable. The method can be used for the routine analysis of
[image:6.595.130.465.382.553.2]the Acyclovir in tablet dosage form.
[image:6.595.126.470.598.748.2]Figure 1: Chemical structure of Acyclovir.
Figure: 2: λmax of Acyclovir by Perkin Elmer Lambda 25UV/VIS Spectrometer
Figure 4: Chromatogram of Acyclovir (20 µg ml-1).
[image:7.595.138.462.607.733.2]Figure 5: Chromatogram of Acyclovir in 0.1 M HCl at 60°C
Figure 6: Chromatogram of Acyclovir in 0.1 M NaOH at 60°C
Figure 8: Chromatogram of Acyclovir at 80°C for 24 hrs.
Table 1: Result of assay of Acyclovir
Table 2: Force degradation conditions. Force degradation
condition
Concentration of stressor
Exposure
condition Duration
Hydrolysis Acid 0.1 M HCl 60°C 4 h
Base 0.1 M NaOH 60 °C 4 h
Oxidation 3 % v/v H2O2 60°C 3 h
Thermal - 80°C 24 h
[image:8.595.72.488.266.676.2]
Table 3: LOD and LOQ of Acyclovir.
Table 2: Recovery study.
Table 3: Precision study Sample Solution Concentration (µg/ml) Sample solution area Mean sample Solution area % Drug Found
50 5175
5177 100.2%
50 5177
50 5179
Drug LOD LOQ
Acyclovir 0.015 µg/ml 0.047 µg/ml
Spiked conc. (µg ml-1)
Calculated spiked conc. ± SD (µg ml-1), % RSD
% Recovery
4 4.00 ± 0.008, 0.21 100.01
5 5.00 ± 0.035, 0.70 99.95
6 5.95 ± 0.475, 0.79 99.52
Conc. (µg ml-1)
Intra-day precision Inter-day precision Measured conc. ± SD (µg ml-1),
% RSD
Measured conc. ± SD (µg ml-1),% RSD
Table 4: Repeatability study
a
Based on peak area
b
Based on retention time
Table 5: Robustness study
Conc. Conditions changed Mean Peak area % RSDa Mean RT % RSDb
50 µg ml-1
Mobile phase composition
45:55 5178084.79 0.60 2.646 0.69
55:45 5176384.03 0.74 2.462 0.33
Flow rate
0.8 ml min-1 5167450.17 0.69 3.272 0.22 1.2 ml min-1 5186230.70 0.40 1.974 0.39
a
Based on peak area
b
Based on retention time
CONCLUSION
This study is typical example of development of stability indicating method, established
following the recommendations of ICH guidelines Q2 (R1).[17] It is one of the rare studies
where degradation product and drug were resolved in a single isocratic run.The developed
method is simple, accurate, precise and rugged. This method can be applied to the quality
control of acyclovir raw material and long term stability control of pharmaceutical product.
ACKNOWLEDGEMENT
The authors are grateful to Lupin Ltd. Boiser, Mumbai, India for providing API of Acyclovir
as gift sample. Authors also thanks to Sinhgad College of Pharmacy, Pune, India for
providing necessary facilities to complete this project.
REFERENCES
1. K. Basavaiah, H. C. Prameela, U. Chandrashekar, Simple high-performance liquid
chromatographic methof for the determination of acyclovir in pharmaceuticals, IL Farm.,
2003; 58: 1301–1306.
2. The Merck Index, fourteenth ed., Merck, New Jersey, 2006.
30 29.90 ± 0.187, 0.62 29.66 ± 0.236, 0.80
50 49.49 ± 0.434, 0.88 49.62 ± 0.305, 0.61
Conc. % RSDa %RSDb
[image:9.595.112.483.255.381.2]3. Indian Pharmacopoeia, The Indian Pharmacopoeia Commission, Ghaziabad, 2010, p. 775.
4. K. Basavaiah, H. C. Prameela, Simple spectrophotometric determination of acyclovir in
bulk drug and formulations, IL Farm., 2002; 57: 443-449.
5. A. L. Huidobro, F.J. Ruperez, C. Barbas, LC methods for acyclovir and related impurities
determination, J. Pharm. Biomed. Anal., 2005; 37: 687-694.
6. P. D. Tzanavaras, D. G. Themelis, High-throughput HPLC assay of acyclovir and its
major impurity guanine using a monolithic column and a flow gradient approach, J.
Pharm. Biomed. Anal., 2007; 43: 1526-1530.
7. M. M. Caamano, L.V. Garcia, B. Elorza, J. R. Chantres, Improved RPLC determination
of acyclovir using hexylamine as silanol masking agent, J. Pharm. Biomed. Anal., 1999;
21: 619-624.
8. J. Emami, N. Bazargan, A. Ajami, HPLC determination of acyclovir in human serum and
its application in bioavailability studies, Res. Pharm. Sci., 2009; 4(1): 47-54.
9. N. M. Volpato, P. Santi, C. Laureri, P. Colombo, Assay of acyclovir in human skin layers
by high performance liquid chromatography, J. Pharm. Biomed. Anal., 1997; 16:
515-520.
10.K. B. Nemes, B. D. Kiss, I. Klebovich, Determination of acyclovir in dog plasma by
HPLC using a column switching technique, Chromatogr. Suppl., 2000; 51: S-211-216.
11.H. Testereci, H. Dulger, A. Ertekin A., T. Kahraman, The determination of acyclovir in
sheep serum, human serum, saliva and urine by HPLC, East. J. Med., 1998; 3(2): 62-66.
12.ICH, Stability testing of new drug substances and products Q1A (R2), International
Conference on Harmonisation, IFPMA, Geneva, 2003.
13.ICH, Validation of analytical procedures: Text and Methodology Q2 (R1), International
Conference on Harmonisation, IFPMA, Geneva, 1996.
14.M. Bakshi, S. Singh, Development of validated stability-indicating assay methods-