A Resistance Based Biosensor That Utilizes Conductive
Microfibers for Microbial Pathogen Detection
Shannon K. McGraw1,2, Evangelyn Alocilja1*, Kris Senecal3, Andre Senecal2
1Biosystems and Agricultural Engineering, Michigan State University, East Lansing, USA 2Food Safety and Defense Team, US Army NSRDEC, Natick, USA
3Macromolecular Sciences and Engineering Team, US Army Natick Soldier Research, Development
and Engineering Center (NSRDEC), Natick, USA Email: *[email protected]
Received September 18, 2012; revised October 18, 2012; accepted October 26,2012
ABSTRACT
Escherichia coli O157:H7 (E. coli O157:H7) is one of the top pathogens of interest for the development of rapid diag- nostic systems for food and water samples. The objective of this research is to develop a rapid, novel electrochemical biosensor based on the use of polypropylene microfiber membranes coated with a conductive polypyrrole and antibody functionalized for the biological capture and detection of E. coli O157:H7 in the field. Using glutaraldehyde, pathogen specific antibodies are covalently attached to conductive microfiber membranes which are then blocked using a 5% bovine serum albumin solution. The functionalized membranes are then exposed to E. coli O157:H7 cells washed in Butterfield’s phosphate buffer and added to a phosphate-buffer electrolyte solution. When a voltage is applied to the system, the presence of the captured pathogen on the fiber surface results in an increase in resistance at the electrotextile electrode surface, indicating a positive result. In this study, the initial resistance of the membrane in the electrochemical system was established and found to range between 5.8 kΩ and 13 kΩ. The resistance of the system not associated with the electrotextile fibers was calculated to contribute to only 2.8% of the total system resistance, and found not to be sig- nificant. A proof of concept experiment was conducted and determined that the electrotextile electrode was able to dif- ferentiate between small changes in a solution’s conductivity associated with the presence of E. coli O157:H7 cells over a concentration range of log 0 - 9 CFU/mL.
Keywords: Electrotextile; Biosensor; Polypyrrole; Immunosensor; Resistance Based Detection
1. Introduction
Although food and waterborne pathogens do not have as significant an effect on US military operations as they have in the past, enteric pathogens are still one of the top causes of non-combat related injuries in the field and are therefore one of the primary military medical concerns for deployed troops [1]. Gastroenteritis was the leading cause of illness among troops during Operations Desert Shield (1990 - 1991) and Desert Storm (1991) [2]. This is a significant issue for the military to address because an outbreak of diarrheal disease in the field has the ability to rapidly affect a large number of war fighters. During Op- eration Restore Hope (1992 - 1993), it was shown that 16% of all hospital admissions were for diarrheal illness [3]. Of these admissions, 16% could be traced back to Escherichia coli (E. coli). Various studies on diarrheal illness in deployed troops have listed an array of enteric pathogens as the source with the most commonly occur- ring ones being: Shigella, E. coli, Salmonella, and Cam-
pylobacter species [2-5]. The ability to rapidly and accu- rately detect enteric pathogens with low infective doses, such as E. coli O157:H7, in the field has significant im- portance.
Biosensors are one technology being developed in or- der to improve pathogen detection and reduce response times. Immunobiosensors utilize pathogen specific anti- bodies coupled to a transducer as the biological recogni- tion element for detection [6]. The use of antibodies in the design of a biosensor is beneficial because, as the field of clinical immunoassays has shown, the benefits of the antibody-antigen reaction include high binding ef- ficiency and specificity for detection. In addition, anti- bodies can be generated against nearly any bacterial pathogen. The faster speed and lower cost of immuno- biosensors versus standard detection methods and bio- sensors using other biorecognition techniques, such as DNA, have made them especially marketable for use in food matrices [7-9]. In an electrochemical biosensor, the biological recognition element is immobilized on an ele- ctrode, which then converts the biological recognition
event (i.e. antibody—antigen binding) into a measurable electrical signal [6]. Electrochemical biosensors are gen- erally less expensive than optical detection methods and are easier to use with turbid samples. Electrochemical impedance/resistance based sensing also does not require enzyme labels or redox mediators to facilitate detection the way optical based sensing does [10]. Instead, a mea- surable system response is created when the biological recognition event disrupts the flow of either the current or the potential at the working electrode while the re- ference electrode maintains a constant potential [6]. In order for biosensor technology to advance and surpass common pathogen detection techniques, such as polyme- rase chain reaction (PCR) and culture/colony counting, the current drawbacks of biosensors must be addressed. These include high cost, low durability, a lack of envi- ronmental robustness for in field testing, detection limits that do not reach those of traditional techniques, and a necessity for extra extraction methods to be performed before use which adds to the total detection time.
One approach for addressing some of the drawbacks of current biosensor technology is through the development/ use of nonwoven fibers to create “electrotextiles”. High- surface area non woven electro textile membranes are ver- satile materials that can be developed into “smart mem- branes” designed for use with all forms of sensor signal transduction. Research is scarce, however, regarding the integration of electrotextile, biological, and electrical te- chnology to create novel biosensor systems for applica- tions such as food protection and environmental samp- ling. Previous work has been done to develop electrically active non-metallic textile coatings made of doped poly- pyrrole polymer [11-14]. By producing a conductive po- lymer coating on nonwoven microfibers, an electroche- mical biosensor electrode can be created that is less ex- pensive than its planar metal counterpart [15]. The over- lapping fiber layers also have more available surface area than planar electrodes, resulting in more potential target attachment sites. In addition, these electrotextile elec- trodes can be engineered to be durable, disposable, light- weight, and require minimal attachment chemistry. These qualities make them ideal for in field use. The chemical composition of nonwoven fibers and their coatings can also be easily changed or adjusted based on their inten- ded use. Small changes to the processing parameters can change the fiber diameter, mesh size, porosity, texture, or weave pattern. This processing flexibility makes them a very versatile material for sensor development. They can be designed to be used with many different analytes and experimental conditions and can be designed to have high chemical stability [16]. The ability to use antibody functionalized fibers for the capture and concentration of target analytes has been previously demonstrated with electrospun nanofibers and a carboxyl functional group (-COOH) [17,18]. With the attachment of biological re-
cognition elements to the electrotextile surface, these ele- ctrodes have the capacity to perform pathogen capture, concentration, and detection. This would simplify a food pathogen biosensor, resulting in a significantly smaller and lighter detection system.
A non woven polypropylene electro textile coated with a pyrrole and 3-thiopheneacetic acid (3-TAA) conductive copolymer has been developed [19,20]. Studies were conducted to look at the effects of the inclusion of dif- ferent monomers, reaction solvents, and a dopant. Analy- sis was also done to determine the best concentration of oxidant and functionalizing monomer to use. The suc- cessful attachment of antibodies to the coated fibers for the capture of bacterial cells using this electrotextile has been previously reported [18]. Bhattacharyya et al. have shown that a nylon electrotextile coated with a 3,4-ethy- lenedioxythiophene (EDOT) and 3-thiopheneethanol (3- TE) copolymer functionalized with avidin can be used to detect biotin in solution [21]. They observed that the tex- tile resistance increased as the concentration of biotin protein in the solution increased and that the resistance of each sample also increased over time. These increases in resistance were theorized to be the result of the surface bound avidin on the electrotextile reacting with the biotin in solution and that the attachment of the biotin to the surface altered the electrical environment close to the electrode layer. This same theory can be applied to our sensor, the average resistance for each bacterial sample increases as the bacterial cells impede the flow of elec- tricity through the electrode. This response becomes lar- ger and more significant as the concentration of cells in solution increases.
E. coli O157:H7. To our knowledge, this is the first time a functionalized conductive copolymer coated nonwoven electrotextile has been used with immobilized antibodies as an electrode for the successful electrical detection of live bacterial cells.
2. Materials and Methods
2.1. MaterialsNonwoven polypropylene microfibers were obtained from North Carolina State Nonwovens Cooperative Research Institute. For the polymer synthesis, the monomer used was a 10% pyrrole solution that was copolymerized with carboxylic acid functional 3-TAA. The oxidant was iron (III) chloride (FeCl3). The polymer was doped using
5-sulfosalicylic acid (5-SSA). All of the polymerization chemicals were obtained from Sigma-Aldrich (St. Louis, MO). Covalent attachment of KPL (Gaithersburg, MD) BacTrace antibody goat anti-E. coli O157 was performed using glutaraldehyde (Sigma-Aldrich) and deactivating buffer (0.2 M Tris, 10 mM sodium cyanoborohydride (Sigma-Aldrich)) and blocked with bovine serum albu- min (BSA) (Sigma-Aldrich).
2.2. Electrotextile Synthesis
Electrotextile synthesis was conducted according to pre- viously published techniques [18]. Briefly, an aqueous deposition process of conductive and functional polymer coatings upon a polypropylene fiber matrix was used, as described below. A 6 cm × 8 cm polypropylene microfi- ber mat was submerged in a 10% pyrrole and 3-TAA (10 mg/mL) solution, creating a functionalized monomer that was absorbed onto the fiber mat. The wet fiber sample was then removed from the solution and laid flat in a glass reaction vessel for polymerization. FeCl3 (0.1 M,
30 mL) was added to the sample to initiate the chemical reaction while a dopant, 5-SSA (0.1 M, 3 mL), was si- multaneously added. The fibers in solution were incu- bated at room temperature for 30 minutes with constant agitation, thereby ensuring that polymerization occurred on both sides of the mat. The nonwoven fiber sample was removed from the solution, gently washed on both sides with deionized (DI) water, and dried at room temperature overnight.
2.3. Antibody Immobilization
Covalent attachment of the anti-E. coli O157 antibodies onto the electrotextile fiber surface was conducted fol- lowing a previously published technique [18]. Briefly, the conductive nonwoven fiber mats were cut into 2 cm × 2 cm squares. The fiber squares were washed with 0.01 M phosphate-buffered saline (PBS), pH 7.4, and dried for 10 minutes. After drying, a volume of 3 mL of 2.5 mM glutaraldehyde was applied to each disc and incubated
for 1 hour at 4˚C. After incubation, the discs were wa- shed with 0.01 M PBS and dried for 10 minutes. A vol- ume of 4 mL of antibody (10 µg / mL in PBS) was then applied to each disc and incubated for 15 minutes at 37˚C. The discs were washed with 0.01 M PBS, dried for 10 minutes, and then 3 mL of deactivating buffer was ap- plied and allowed to react at 37˚C for 15 minutes. A 5% BSA block was added and reacted at room temperature for 1 hour. The discs were washed twice with PBS, and then once with PBS containing 0.1% Tween-20 (PBST).
2.4. Cell Culture Preparation and Enumeration
E. coli O157:H7 Sakai strain was obtained from the Mi- chigan State University Food Safety and Toxicology Center. Cell cultures were grown to a concentration of roughly 108 colony forming units (CFU)/mL based on
strain specific growth curves in tryptic soy broth (TSB) at 37˚C. A 10 mL volume of cell culture was removed and centrifuged for 5 minutes at 5000 rpm. The pelleted cells were washed with Butterfield’s phosphate buffer (BPB), pH 7.2. This wash procedure was performed in triplicate. The cells were resuspended (10 mL) and then serially diluted using BPB. A volume of 100 µL of the 5th, 6th, 7th, and 8th dilutions as well as the blank con- trol sample, sterile BPB, was plated in triplicate onto MacConkey-sorbitol (SMAC) agar and incubated over- night at 37˚C. Sample concentration estimates were cal- culated using standard estimation methods based on the average plate counts [22,23].
2.5. Resistance Measurements and Electrical Theory
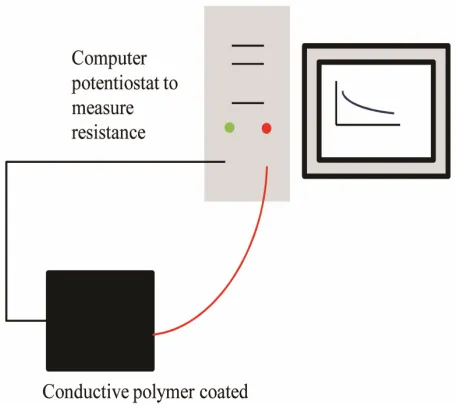
Resistance values were obtained by connecting the elec- trotextile electrodes to a potentiostat with two stainless steel alligator clip. The experimental setup can be seen in
Figures 1 and 2.
Briefly, the antibody bound 2 cm × 2 cm electrotextile squares were completely submerged in a beaker contain- ing 0.1 M phosphate buffer (18 mL, pH 7.4) while at- tached to the potentiostat in order to establish a baseline resistance for the fibers. After 30 minutes, a 2 mL sample from the E. coli O157:H7 serial dilutions was added, bringing the total solution volume to 20 mL. Constant potential amperometry (0.5 V), where a constant poten- tial is applied and the current is measured, was used and the current values were recorded at fixed time intervals over 15 minutes. Previous studies have demonstrated that a potential of 0.2 V to 0.8 V is a preferable input signal when dealing with whole cells or other biological ele- ments [24-27]. Based on this information, the potential of 0.5 V was arbitrarily selected.
Figure 1. Schematic of the system design. The electrotextile fibers are connected to the computer/potentiostat for resis- tance measurements.
Figure 2. Experimental set-up that measures the change in resistance of the antibody bound electrotextile electrode when bacteria are added to the buffer solution. Alligator clips connect the conductive polymer electrotextile to the computer/potentiostat where the measured current of the system is recorded.
time point could be used to calculate the total resistance of the system based on Ohm’s law, Equation (1). Ohm’s law states that the current flowing through a conductor, at a constant temperature, is directly proportional to the potential difference across the points of applied voltage.
V IR (1) where V is the potential across, I is the current through, and R is the resistance of the system. The ratio of V/I indicates the resistance value at that point in time. To validate the use of this equation, a linear sweep was per- formed on the electrotextile. A linear sweep is a voltam-
metric method where the applied potential to the elec- trode is linearly varied in time. A material that produces a linear response to a linear sweep is described as an oh- mic material, a material that exhibits ohmic behavior. Data showing ohmic behavior of the electrotextile is shown in Figure 3. The electrotextile exhibits ohmic behavior across the potential range of interest, meaning that it obeys Ohm’s law, as the potential increases, the- measured current increases proportionally. The electro- textile can therefore be used as an electrode for this study.
The complete system setup can be viewed as a simple circuit with two resistors in parallel, as can be seen in
Figure 4. The resistance caused by interactions at the conductive fiber electrode surface would be considered resistor 1 (R1) and any resistance occurring due to inter- actions between the buffer solution and the rest of the system components would be considered resistor 2 (R2). Based on the theory of parallel resistors, these two resis- tances combine to form the total resistance of the system (RT) as seen in Equation (2).
1 RT1 1 1R R2 (2) R2 can be determined by measuring the resistance of the system when the conductive fiber electrode is not present. Once measured values for RT and R2 have been obtained, R1 can be calculated. In order to determine if the effect of R2 is significant in the system, it is impor- tant to look at how much it contributes to RT. Equation (3) was used to determine what percentage of the total system resistance, RT, was due to R2.
2% contribution to 100
R RT R RT (3) Equation (3) calculates the contribution to RT from R2 as a percentage, where ΔR is equal to the difference be- tween RT and R1, or the difference in the total system re- sistance due to R2.
[image:4.595.321.520.548.663.2]Figure 4. Circuit model of the antibody immobilized fibers with bacteria present. The system acts as a circuit with two resistors in parallel. R1 is the resistance at the electrotextile surface. R2 is the resistance in the buffer solution.
2.6. Determining System Resistances
In order to address objective 1, squares (2 cm × 2 cm) of the electrotextile fabric were attached to the potentiostat in phosphate buffer and their amperometric response to the addition of E. coli O157:H7 samples at calculated concentrations of 100, 103, 105, and 108 (log 0, 3, 5, and 8,
respectively) CFU/mL as well as a control (BPB, 0 CFU/ mL) at fixed time points over 15 minutes was recorded. Using Equation (1), RT was calculated.
2.7. Determining the System’s Component Contributions
In order to address objective 2, the procedure described in Section 2.6 was performed using 2 cm × 2 cm squares of non-coated, non-functionalized polypropylene fibers. Using Equation (1), these values were designated as R2. Using Equation (2), the value of R1 at each time point was calculated. Once the values of R1, R2 and RT were established, Equation (3) was used to determine the per- cent contribution to RT that was due to the resistance from R2. Significance was tested by using a Student’s t-Test (1 tail, α = 0.05).
2.8. Using the Electrotextile as a Resistance Based Sensor
To address objective 3, squares (2 cm × 2 cm) of the ele- ctrotextile fabric were attached to the potentiostat in pho- sphate buffer and multiple measurements were first taken using the electrotextile electrodes and constant potential amperometry with a pure BPB solution over several days to establish the range of the initial baseline values for the system. Triplicate measurements were taken using the electrotextile electrode and constant potential amperome- try to establish the resistance values for a control sample (BPB, 0 CFU/mL) and E. coli O157:H7 at concentrations of 101, 104, 106, and 109 (log 1, 4, 6, and 9, respectively)
CFU/mL. The resistances for each concentration at each
time point were averaged to determine an average resis- tance value for each concentration. The resistance of the sensor at each bacterial concentration was tested against the values of the control using a Student’s t-Test (1 tail, α = 0.05) to determine significance.
3. Results and Discussion
The purpose of this study was to determine: the resis- tance of the membrane in the electrochemical cell; what effect the buffer solution has on the total resistance of the system and if that effect is significant; and if the electro- textile electrode can differentiate between small changes in the conductivity of a solution due to the addition of target bacterial pathogens. As a result of this study a functionalized conductive copolymer coated nonwoven electrotextile was successfully used as an electrode with immobilized antibodies on the surface for the successful electrical detection of live bacterial cells for the first time. This technology has the potential to be used in the de- velopment of light-weight, flexible, inexpensive, and dis- posable field based systems for the rapid detection of various target pathogens.
3.1. Determining System Resistances
Using the method described in Section 2.6, amperometric responses to the addition of E. coli O157:H7 samples at calculated concentrations of 100, 103, 105, and 108 ( log 0,
3, 5, and 8, respectively) CFU/mL as well as a control (BPB, 0 CFU / mL) at fixed time points over 15 minutes were recorded. Using Equation (1), RT was calculated, achieving objective 1. These results can be seen in Fig- ure 5.
The average total system resistance (RT) ranged from 5.8 to 7.3 kΩ, with the resistance increasing as the con- centration of bacterial cells in solution increased. The
[image:5.595.313.532.539.686.2]cytoplasm of live bacterial cells has been previously re- ported to have a resistivity of 106 Ω/cm2, which ex-
plains this phenomenon [28,29]. The measurements ap- peared to settle at a near constant resistance after roughly 2 minutes had passed and the system had reached equi- librium.
3.2. Determining the System’s Component Contributions
In order to complete objective 2 the method described in Section 2.7 was performed. The difference between the methods described in Sections 2.6 and 2.7 is that in Sec- tion 2.7 2 cm × 2 cm squares of non-coated, non-func- tionalized polypropylene fibers were used. Using Equa- tion (1), these values were designated as R2. Using Equa- tion (2), the value of R1 at each time point was calcu- lated.
The average resistance of the system without the coa- ted fibers (R2) ranged from 10.5 MΩ to 21.5 MΩ, a 103
magnitude difference from the values of R1. The values of R2 for each cell concentration exhibited the same gen- eral trend as seen with the values of RT, but were more variable with random fluctuations occurring as late as 10 minutes into the measurement. This is most likely due to the fact that at such high resistance, and therefore low current levels, the measured values were near the limit of sensitivity for the potentiostat and difficult to separate from the regular system noise. The values of R2 also had larger standard deviations, ranging from 7.8 to 37.8 MΩ, as compared to 1.2 to 1.5 kΩ for the values of RT.
With the values of R1, R2 and RT established, Equa- tion (3) was used to determine that at its maximum point, the contributed resistance from R2 was calculated to be 2.8% of the total system resistance. After 2 minutes, R2 contributed at maximum only 0.73% to the total system resistance, with the average percentage of RT due to R2 being 0.09%. A Student’s t-Test (1 tail, α = 0.05) was performed and found no significant difference between RT and R1 at any of the tested concentrations. With R1 contributing over 97% of the value of RT, RT and R1 were determined to be essentially equivalent. All future reported resistances and analysis for the sensor are based on the value of RT.
3.3. Using the Electrotextile as a Resistance Based Sensor
Multiple measurements were taken using the electrotex- tile electrodes and constant potential amperometry with a pure BPB solution over several different days to establish a baseline range for the system. The sensor was found to have an initial resistance range of 5.8 kΩ to 13.0 kΩ with an average value of 9.6 kΩ (standard deviation = 3.1 kΩ).
This range can be attributed to variability in the polymer synthesis and deposition process as well as the potential for inconsistencies of the amount and orientations of the bound antibodies and blocking proteins between the fiber membranes. Because of this range in the initial baseline for the system, it is important to evaluate the system ba- sed on the response of each individual sensor and the average observed trends across multiple sensors.
Triplicate measurements were taken using the electro- textile electrode and constant potential amperometry to establish the resistance values for a control sample (BPB, 0 CFU/mL) and E. coli O157:H7 at concentrations of 101,
104, 106, and 109 (log 1, 4, 6, and 9, respectively) CFU/
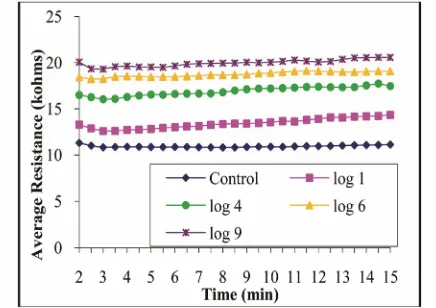
mL. A time of 2 minutes was determined to be necessary to reach system equilibrium. The resistances for each concentration at each time point were averaged and the value after the initial 2 minute equilibrium time can be seen in Figure 6.
The relatively smooth stacked lines for each of the samples indicate that the resistance of the sensor at each concentration is not significantly changing over the 15 minute period. The resistance for each sample increases as the concentration of cells increases. This trend can also be seen in Figure 7, where the individual resistance values at each time point after 2 minutes for each sample concentration were averaged together to determine an average resistance for each sample.
[image:6.595.314.532.509.663.2]In Figure 7, it can be seen that the differences in re- sistance values between samples are smaller at the high concentrations than the differences observed between the lower half of the concentrations. This is most likely due to the fibers reaching a threshold for attachment on the surface, so that the increase of cells in the sample is no longer generating a proportional increase on the system
Figure 7. Average resistances for varying bacterial cell con- centrations. Resistances taken after 2 minutes equilibrium time for each cell concentration were averaged to provide a single resistance value. Error bars show the standard devia- tions of the experimental data.
resistance. The surface attachment capabilities could be improved by decreasing the size of the fibers, allowing more fibers per square centimeter and therefore increas- ing the surface area of the fiber mats. It can also be im- proved by attaching more antibodies to the fibers and decreasing the amount of blocking agent being used.
The resistance of the sensor at each bacterial concen- tration was tested against the values of the control using a Student’s t-Test (1 tail, α = 0.05) to determine signifi- cance. The resistance at each concentration of E. coli O157:H7 tested was determined to be significantly dif- ferent from the blank. The Student’s t-Test was also used to determine that, after 2 minutes, the resistances meas- ured at each concentration were significantly different than at every other tested concentration. This shows that the electrotextile electrode is capable of differentiating between small changes in conductivity due to the addi- tion of bacterial pathogens to the system. It also has the potential to eventually be used as a simple sample cap- ture and read system for pathogen detection.
4. Conclusion
A high surface area electrotextile based biosensor has been developed by the aqueous deposition of a function- alized conductive copolymer onto a nonwoven polypro- pylene microfiber mat. Pathogen specific antibodies were covalently attached to the fibers using glutaraldehyde. The proof of concept for the system was established by measuring the resistance response of the fibers when they were exposed to a target pathogen in solution over 15 minutes. By evaluating the system as a circuit with two resistors in parallel, it was found that the average resis- tance of the electrotextile electrode in phosphate buffer without any bacterial cells present ranged from 5.8 kΩ - 13.0 kΩ. The resistance of the system not associated with the electrotextile fibers was calculated to contribute to
only 2.8% of the total system resistance, and was deter- mined not to be a significant contribution. Finally, the biosensor system was shown to be able to differentiate between small changes in conductivity due to the pres- ence of a target pathogen in a solution over a sensitivity range of log 0 - 9 CFU/mL. This technology has the po- tential for application in the development of a light- weight, flexible, inexpensive, and disposable field based system for the rapid detection of various target patho- gens.
5. Acknowledgements
The work presented in this paper was supported by RDECOM NSRDEC and the ASEE SMART program. The authors would also like to acknowledge Krista Lueck and Dr. Barbara Cloutier for their assistance with this project.
REFERENCES
[1] J. W. Sanders, S. D. Putnam, M. S. Riddle and D. R. Trib- ble, “Military Importance of Diarrhea: Lessons from the Middle East,” Current Opinion in Gastroenterology, Vol. 21, No. 1, 2005, pp. 9-14.
[2] K. C. Hyams, K. Hanson, F. S. Wignall, J. Escamilla and E. C. Oldfield, “The Impact of Infectious Diseases on the Health of US Troops Deployed to the Persian Gulf during Operations Desert Shield and Desert Storm,” Clinical In- fectious Diseases, Vol. 20, No. 6, 1995, pp. 1497-1504. doi:10.1093/clinids/20.6.1497
[3] A. N. Sharpe, “Food Sample Preparation and Enrichment for Rapid Detection,” In: S. T. Clarke, K. C. Thompson, C. W. Keevil and M. S. Smith, Eds., Rapid Detection As- says: For Food and Water, Royal Society of Chemistry, Cornwall, 2001, pp. 129-137.
doi:10.1039/9781847551818-00129
[4] B. A. Oyofo, et al., “A Survey of Enteropathogens among United States Military Personnel During Operation Bright Star ‘94, in Cairo, Egypt,” Military Medicine, Vol. 160, No. 7, 1995, pp. 331-334.
[5] A. Senecal and P. Marek, “Military Food Safety Tech- nologies,” In: A. H. Barrett and A. V. Cardello, Eds., Mi- litary Food Engineering and Ration Technology, DE-Stech Publications, Inc., Lancaster, 2012, pp. 157-194. [6] J. Wang, “Analytical Electrochemistry,” 2nd Edition, John
Wiley & Sons, New York, 2000. doi:10.1002/0471228230
[7] E. C. Alocilja and S. M. Radke, “Market Analysis of Bio- sensors for Food Safety,” Biosensors and Bioelectronics, Vol. 18, No. 5-6, 2003, pp. 841-846.
doi:10.1016/S0956-5663(03)00009-5
[8] A. Swain, “Biosensors: A New Realism,” AnnalesdeBio- logie Clinique, Vol. 50, No. 3, 1992, pp. 175-179. [9] A. Warsinke, “Biosensors for Food Analysis,” In: F. W.
sel, Basel, 1997, pp. 121-140. doi:10.1007/978-3-0348-9045-8_9
[10] X. Munoz-Berbel, et al., “Impedance-Based Biosensors for Pathogen Detection,” In: M. Zourob, S. Elwary and A. Turner, Eds., Principles of Bacterial Detection: Biosen- sors, Recognition Receptors and Microsystems, Springer Science+Business Media, New York, 2008, pp. 341-370. doi:10.1007/978-0-387-75113-9_15
[11] R. V. Gregory, W. C. Kimbrell and H. H. Kuhn, “Electri- cally Conductive Non-Metallic Textile Coatings,” Jour- nal of Coated Fabrics, Vol. 20, 1991, pp. 167-175. [12] C. L. Heisey, J. P. Wightman, E. H. Pittman and H. H.
Kuhn, “Surface and Adhesion Properties of Polypyrrole- Coated Textiles,” Textile Research Journal, Vol. 63, No. 5, 1993, pp. 247-256. doi:10.1177/004051759306300501 [13] H. H. Kuhn and W. C. Kimbrell, “Method for Making
Electrically Conductive Textile Materials,” US Patent No. 4877646, 1989.
[14] H. H. Kuhn, W. C. Kimbrell, J. E. Fowler and C. N. Bar- ry, “Properties and Applications of Conductive Textiles,”
Synthetic Metals, Vol. 57, No. 1, 1993, pp. 3707-3712. doi:10.1016/0379-6779(93)90501-M
[15] F. Granato, et al., “Disposable Electrospun Electrodes Based on Conducting Nanofibers,” Electroanalysis, Vol. 20, No. 12, 2008, pp. 1374-1377.
doi:10.1002/elan.200804185
[16] C. Burger, B. S. Hsiao and B. Chu, “Nanofibrous Materi- als and Their Applications,” Annual Review of Materials Research, Vol. 36, 2006, pp. 333-368.
doi:10.1146/annurev.matsci.36.011205.123537
[17] A. Senecal, J. Magnone, P. Marek and K. Senecal, “De- velopment of Functional Nanofibrous Membrane Assem-blies Towards Biological Sensing,” Reactive& Functional Polymers, Vol. 68, No. 10, 2008, pp. 1429-1434. doi:10.1016/j.reactfunctpolym.2008.06.022
[18] S. K. McGraw, et al., “Antibody Immobilization on Con- ductive Polymer Coated Nonwoven Fibers for Biosen-sors,” Sensors and Transducers Journal, Vol. 13, Special Issue, 2011, pp. 142-149.
[19] S. K. McGraw, E. Alocilja, A. Senecal and K. Senecal, “Synthesis of a Functionalized Polypyrrole Coated Elec-trotextile for Use in Biosensors,” Biosensors, in Press. [20] S. K. McGraw, E. Alocilja, A. Senecal and K. Senecal,
“The Effect of 3-Thiopheneacetic Acid in the Polymeri-zation of a Conductive Electro Textile for Use in Biosen- sor Development,” Manuscript Submitted for Publication. [21] D. Bhattacharyya, K. Senecal, P. Marek, A. Senecal and
K. K. Gleason, “High Surface Area Flexible Chemiresis-tive Biosensor by OxidaChemiresis-tive Chemical Vapor Deposi-tion,” Advanced Functional Materials, Vol. 21, No. 22, 2011, pp. 4328-4337. doi:10.1002/adfm.201101071 [22] International Dairy Federation, “Milk and Milk Products:
Enumeration of Microorganisms: Colony Count at 3 De- grees C,” Provisional IDF Standard 100A, International Dairy Federation, Brussels, 1987.
[23] S. Niemela, “Statistical Evaluation of Results from Quan- titative Microbiological Examinations,” Nordic Commit- tee in Food Analysis Report No. 1, Nordic Committee in Food Analysis, Uppsala, 1983.
[24] Z. Tahir, E. Alocilja and D. Grooms, “Indium Tin Oxide- Polyaniline Biosensor: Fabrication and Characterization,”
Sensors, Vol. 7, No. 7, 2007, pp. 1123-1140. doi:10.3390/s7071123
[25] M. V. Cattaneo, J. H. T. Luong and S. Mercille, “Moni- toring Glutamine in Mammalian Cell Cultures Using an Amperometric Biosensor,” Biosensors and Bioelectronics, Vol. 7, No. 5, 1992, pp. 329-334.
doi:10.1016/0956-5663(92)85028-9
[26] F. Darain, S.-U. Park and Y.-B. Shim, “Disposable Am-perometric Immunosensor System for Rabbit IgG Using a Conducting Polymer Modified Screen-Printed Electrode,”
Biosensors and Bioelectronics, Vol. 18, No. 5-6, 2003, pp. 773-780. doi:10.1016/S0956-5663(03)00004-6
[27] C. G. Tsiafoulis, M. I. Prodromidis and M. I. Karayannis, “Development of an Amperometric Biosensing Method for the Determination of L-Fucose in Pretreated Urine,”
Biosensors and Bioelectronics, Vol. 20, No. 3, 2004, pp. 620-627. doi:10.1016/j.bios.2004.03.012
[28] S. M. Radke and E. C. Alocilja, “Design and Fabrication of a Microimpedance Biosensor for Bacterial Detection,”
IEEE ofSensors Journal, Vol. 4, No. 4, 2004, pp. 434- 440.
[29] H. Tien and A. Ottova-Leitmannova, “Membrane Bio- physics: As Viewed From Experimental Bilayer Lipid Membranes, MST Membrane Science and Technology Series, Vol. 5,” Elsevier, Amsterdam, 2000.