PGM1
gene
and a search for
PGM3
and
PGM4
Jane H. Ives
April 1995
Thesis submitted for the degree of Doctor of Philosophy in the University of London
MRC Human Biochemical Genetics Unit The Galton Laboratory
All rights reserved
INFORMATION TO ALL USERS
The quality of this reproduction is dependent upon the quality of the copy submitted. In the unlikely event that the author did not send a complete manuscript and there are missing pages, these will be noted. Also, if material had to be removed,
a note will indicate the deletion.
uest.
ProQuest 10045709
Published by ProQuest LLC(2016). Copyright of the Dissertation is held by the Author. All rights reserved.
This work is protected against unauthorized copying under Title 17, United States Code. Microform Edition © ProQuest LLC.
ProQuest LLC
789 East Eisenhower Parkway P.O. Box 1346
Phosphoglucomutase is an enzyme central to glycolysis and
gluconeogenesis. There are three well characterised forms: PGM1, PGM2 and PGM3.
Genomic clones containing the 5' end of the PGM1 gene were Isolated and characterised. The exon/intron boundaries of the first exon (designated 1A) were determined. 15kb of intron 1 have been mapped and 2.8kb of the flanking regions sequenced. The proximal promoter shows features of a 'housekeeping' promoter. Features characteristic of a CpG island have been identified in this region. An alternative first exon has been identified (1B). The two exons show similarities indicating a gene duplication event. Exon IB is transcribed from a promoter in the first large intron of PGM 1.1 A. Expression studies of PGM 1.IB by RNA-PCR show a limited tissue expression, with predominate expression in striated muscle.
Exons 1A and 1B were sequenced in DNA from eight individuals of known PGM1 protein phenotypes. No genetic variation in these sequences was
encountered.
The PGM1 cDNA was used as a probe in a search for the PGM3 gene. A human chromosome 6 library was screened. Positive cosmids were assigned to chromosome positions by fluorescent in situ hybridisation, restriction mapped and sequenced in part. These studies led to the identification of a novel PGM on chromosome 9. PGM3\Nas not isolated by this procedure, suggesting that the sequences of PGM1 and PGM3 have diverged significantly.
I would like to thank Dr. Yvonne Edwards, who supervised this work, for all her dedication, help and enthusiasm throughout the project. I would also like to thank Dr. David Whitehouse for his support and encouragement and both he and Prof. David Hopkinson for critical reading of this manuscript. Thanks also to everybody in the lab. for their varied help and support, with special mention to Dr. Jane Sowden for her friendship and endless patience, and Wendy Putt for help with everything technical. Thanks to Dr. Margaret Fox who supplied the FISH
analysis, and Dr. Ruth March for the SSCP analysis, and a general thank you to lots of friends at the Galton who were supportive regardless of the situation including Katie, Julian, Una, Lisa, Felicity, Janine, Jenny, Rod and Alex.
Enormous thanks go to Martine who is an excellent friend. A very special thank you goes to Nik, for all his love and support in the last year. Finally, thank you to my Mum, Graeme and Sarah for all their love and encouragement.
This thesis is dedicated to the memory of my father, William C. Ives.
Page
Abstract 2
Acknowledgements 3
Contents 4
Figures 8
Tables 13
Abbreviations 14
Chapter O ne Introduction 16
1.1 Phosphoglucomutase - the enzym e ie
1.1.1 The historical context 16
1.1.2 Purification of PGM protein 17
1.1.3 PGM isoforms 17
1.1.3.1 Structural and physical properties 18
1.1.3.2 Genetic properties 21
1.1.3.3 Chromosome assignments of PGM1, PGM2 26 and PGM3
1.1.3.4 PGM4 - is there a fourth locus? 26
1.1.4 Multiple loci 29
1.1.5 Protein structure 29
1.1.6 Immunological studies 32
1.2 Phosphoglucomutase 1 - the gene. 33
1.2.1 Isolation and characterisation of PGM1 cDNA 33
1.3 Clinical aspects of PGM 35
1.3.1 Deficiencies of enzymes involved in glycogen metabolism 35
1.3.2 PGM deficiency 36
1.4 Objectives 40
Chapter Two Materials and Methods 41
2.1 Materials 41
2.1.1 Standard reagents 41
2.1.2 Enzymes 41
2.1.3 Electrophoresis reagents 41
2.1.4 Miscellaneous 41
2.1.7 Bacterial strains 43
2.2 Methods 43
2.2.1 DNA precipitation and assay of concentration 43
2.2.2 DNA modification 44
2.2.2.1 Restriction enzyme digests 44
2.2.2.2 Dephosphorylation 44
2.2.2.3 Ligation 44
2.2.3 Agarose gel electrophoresis and recovery of DNA 44 fragments
2.2.4 Preparation and transformation of competent E. coli 45
2.2.5 Large scale plasmid preparation 46
2.2.6 Mini-plasmid preparations 47
2.2.7 Large scale X preparations 47
2.2.8 In vivo excision of pBluescript SK(-) from Uni-ZAP XR 48
2.2.9 Single-stranded DNA preparations 48
2.2.9.1 Preparations from M l3 48
2.2 9.2 Preparations from pBluescript 49
2.2.10 Southern blotting 50
2.2.11 Preparation of 32p labelled probes 50
2.2.12 cDNA library screening 51
2.2.12.1 Screening with antibody probes 52
2.2.12.2 Screening with cDNA probes 52
2.2.13 Screening the chromosome 6 library 53 2.2.14 Polymerase Chain Reaction (PGR) 54 2.2.15 'AT' direct cloning of unmodified PGR products 55
2.2.16 DNA sequencing 56
2.2.16.1 Sequencing of single stranded DNA 56 2.2.16.2 Sequencing of double-stranded templates 57
2.2.17 Isolation of RNA 58
2.2.18 Preparation of cDNA by Reverse Transcription and 58 RT-PGR
2.2.19 RNAse Protection assay 59
2.2.20 Primer extension analysis 60
3.1 The architecture of the 5' end of human PGM1 es
3.2 Sequence analysis of the 5' end of PGM1 67
3.3 The promoter region of human PGM1 74
3 .4 Exon 1B, an alternative first exon in PGM1 : position and 81
sequence
3.4.1 Evidence for a duplication of PGM1 87 3.4.2 The 5' extent of the PGM1.1B transcript 92 3.4.3 Expression of the PGM1.1B transcript 94
3 .5 Search for genetic variation in the 5' exons of PGM1 lOO
Chapter Four PGM 3 102
4.1 Isolation and analysis of cosmids from the sorted 102
chromsome 6 library.
4.1.1 Sequence analysis of cosmid P I721 (6p23-24) 111 4.1.2 Sequence analysis of cosmid 1238 111 4.1.3 Sequence analysis of cosmid L1347 (9p11, 9q12) 113
Chapter Five PG M 4 121
5.1 Isolation and analysis of cDNAs from mammary tissue 122
cD NA libraries
5.1.1 A search for PGM4 cDNA using antibody probes 122 5.1.2 Isolation using human PGM1 cDNA as probe 129 5.1.2.1 Analysis of human recombinants 130 5.1.2.2 Analysis of mouse recombinants 138
5.2 PCR amplification of human cD NA library 140
5 .3 lEF analysis of milk 147
Chapter Six Discussion 151
6.1 PGM1 gene structure 151
6.1.1 Alternative first exons, function and significance 152 6.1.2 Exon 1A and the upstream promoter 154
polymorphism
6.2 A search for P G M 3 163
6.2.1 Initial screening for PGM3 164
6 .3 P G M 4 167
Chapter One Introduction
Page
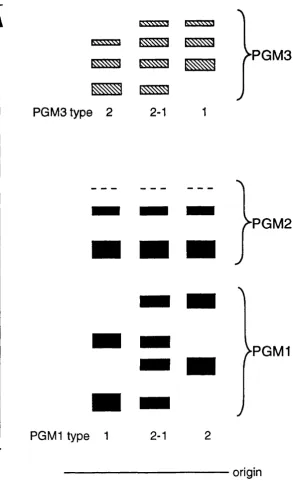
Fig. 1.1 Diagram of PGM components of phenotypes PGM1 1, 19PGM1 2-1, PGM1 2, PGM2 1, PGM3 1. PGM3 2-1 and PGM3 2.
Fig. 1.2 PGM1 phenotypes on starch gel electrophoresis and 22 further resolved by lEF.
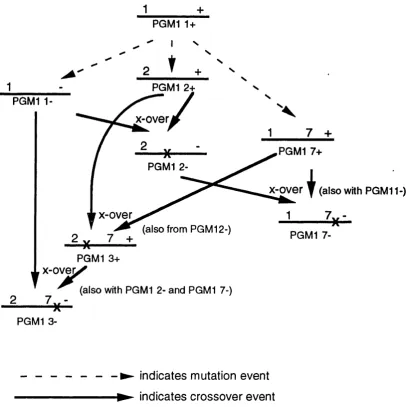
Fig. 1.3 A proposed phytogeny relating 8 alleles in the PGM1 25 system.
Chapter Three PGM1
Fig.3.1 The cloning site of X2001 64
Fig.3.2 A Single and double digests of recombinant PGM1.5' 65 B Autoradiograph following hybridisation of PGM1 cDNA
to recombinant PGM1.5'.
Fig.3.3 Restriction map of PGM 1.5'. 66
Fig.3.4 A Restriction digests of Xba\/Hind\\\ 2.8kb region of 68 PGM1.5'
B Autoradiograph following hybridisation of 5'
EcoRI/Hindlll fragment of PGM1 cDNA to XbaUHindW 2.8kb region.
0 Restriction map of Xba\/Hind\\\ 2.8kb region.
Fig.3.5 A Sequencing strategy of Xba\/Hind\\\ 2.8kb region. 69 B Summary of Xba\/Hind\\\ 2.8kb sequence data.
Fig.3.6 Sequence of XbaUHindW 2.8kb region. 71 Fig.3.7 Restriction map of PGM1.5' showing position and 72
orientation of exon 1.
Fig.3.8 Genomic clones which span the entire PGM1 gene. 73 Fig.3.9 Resolution of GC compression in intron 1 75
A Compressed sequence
B Accurate sequence using dITP and ddlTP mixes.
Fig.3.10 PGM1 exon 1 and flanking sequence 76 Fig.3.11 A Xba\/Hind\\\ 2.8kb fragment and position of exon 1 77
D Plot of Hpall restriction sites
Fig.3.12 A Sma\/Hindi\ genomic fragment encompassing exon 1 78 used as a RNAse protection assay probe.
B Multiple cloning site and positions of T7 and SP6 RNA polymerases promoters in plasmid pGEM-3Z (+).
Fig.3.13 A Sma\/Hind\ RNAse protection assay probe 80 B RNAse protection assay of exon 1 with the SmaUHindi
probe.
Fig.3.14 A Comparison of the 5' ends of rabbit PGM1 and novel 82 rabbit sequences.
B PCR amplification of rabbit DNA with primers pgmppF and pgmppR
Fig.3.15 A Genomic clones spanning the entire human PGM1 84 gene.
B PCR amplification products of human genomic clones with primers pgmppF and pgmppR.
Fig.3.16 A Single and double digests of PGM1 genomic clone X3. 85
B Autoradiograph of exon 1B PCR product hybridised to clone X3.
C Restriction map of clone X3.
Fig.3.17 A Position of exon IB within the PGM1 genomic structure. 86
B Sequence in and around exon IB.
Fig.3.18 Comparison of rabbit and human exon 1B and upstream 88 sequences.
Fig.3.19 A Nucleotide sequence comparison between human 89 exons 1Aand IB.
B Amino acid sequence comparison of human exons 1A and IB .
Fig.3.20 PGM 1 genomic structure. 91
Fig.3.21 A Position and orientation of primer used for exon 1B 93 primer extension analysis.
B Autoradiograph of exon 1B primer extension analysis.
transcriptase analysis of expression.
Fig.3.24 Analysis of expression of exons 1A and 1B in a range of 98 human tissues by reverse transcriptase PCR.
Fig.3.25 Reverse transcriptase PCR analysis of expression of 99 exons 1A and 1B in rabbit muscle.
Chapter Four PGM3
Fig.4.1 Chromosome 6 cosmids Do446, L1347, P1721 and 1238: 104
A Restriction enzyme digests
B Hybridisation to PGM1 cDNA.
Fig.4.2 Chromosome 6 cosmids C l O il, C1847, C l 853 and C l 849: 105
A Restriction enzyme digests
B Hybridisation to PGM1 cDNA.
Fig.4.3 Psfl digests of cosmids D046, PI 721 and C 1011, and 106 hybridisation to PGM1 cDNA.
Fig.4.4 Fluorescent in situ hybridisation of cosmids LI 347 107 (Panel A) and P I721 (Panel B) to chromosome spreads
from blood of a normal 46XX female.
Fig.4.5 Fluorescent in situ hybridisation of cosmids 1238 108 (Panel A) and C1847 (Panel B) to chromosome spreads
from blood of a normal 46XX female.
Fig.4.6 Fluorescent in situ hybridisation of cosmids C l 853 109 (Panel A) and C l 849 (Panel B) to chromosome spreads
from blood of a normal 46XX female.
Fig.4.7 A Sequence of 489bp Sph\/Hind\ fragment from cosmid 112 P1721.
B BESTFIT sequence comparison of PI 721 sequence to PGM1 cDNA.
Fig.4.8 450bp of sequence from cosmid 1238. 114 Fig.4.9 Sequence of the 900bp HindW fragment from cosmid 115
LI 347.
homology between L I347 and exon 5 of human PGM1.
Fig.4.12 A Sequence of PCR primers LI 347F and LI347R. 119
B L1347F/L1347R PCR amplifications of human and rodent genomic DMAs, and human chromosome 6 and chromosome 9 DMAs.
Chapter Five PGM4
Fig.5.1 Illustration of the relative positions of PGM1 exons and 123 protein domains, and the regions of the protein used to
raise anti-PGM antibodies.
Fig.5.2 A Position and sequence of Xgtl 1 forward and reverse 126 primers relative to the LacZ gene.
Fig.5.3 A PCR amplification products of clones 1, 4, 5, 6 and 7. 127
B Autoragiograph following hybridisation of PGM1 cDNA to clones 1, 4, 5, 6 and 7.
Fig.5.4 A Sequence of clone MPL-1. 128
B Sequence of clone MPL-5.
Fig.5.5 A H/ndl and Rsa\ digests of clones H I, H2, H3, H4 133 and H5.
B Autoradiograph following hybridisation of PGM1 3' probe to clones H I, H2, H3, H4 and H5.
Fig.5.6 Aligned restriction maps of PGM1 cDNA and clones 135 H I, H2, H4and H5.
Fig.5.7 A Illustration of the 5' extent of clones H I, H2, H4 136 and H5.
B Position an sequence of the PGM1 3' sequencing primer.
Fig.5.8 Proposed structure of clone H3 aligned to PGM1 exons 137 2 and 4 and intervening sequences.
Fig.5.9 Ps/I, H/ndl 11 and HincW restriction sites in and around 139 PGM1 exons 2 to 4, aligned to the Ps/I, H/ndl I and H/ndl
sites in clone H3.
Fig.5.10 5 'sequence of mouse clone M l aligned to the 5' 141 untranslated and exon 1 sequence of human PGM1.
to human PGM1 sequence.
Fig.5.13 Position of PGM 1 PCR primers Ex2, Ex3/4 and Mg, and 145 expected and observed sizes of amplification products
from the human mammary tissue library.
Fig.5.14 Sequence of Ex2/Mg/300 PCR product. 146 Fig.5.15 A Colostrum samples from mothers following isoelectric 148
Chapter One Introduction
Page
Table 1.1 Multiple loci in some of the glycolytic enzymes. 30Table 1.2 Glycogen storage diseases. 37
Chapter Three PGM1
Table 3.1 Summary of the number of samples collected from 101 individuals of the ten common PGM1 phenotypes and
numbers analysed by sequencing exon 1A and exon 1B.
Chapter Four PGM3
Table 4.1 Summary of the chromosomal localisations of chromosome 110 6 cosmids L I 347, P I721, 1238, C l 847, C l 853 and C l 849
determined by fluorescent in situ hybridisation.
Chapter Five PGM4
Table 5.1 Summary of the screening results of the human nad mouse 125 mammary tissue libraries with anti-rabbit PGM and anti
human PGM1 6' and 10' antibodies.
Table 5.2 Summary of screening of human and mouse libraries with 131 PGM1 cDNA as probe.
Table 5.3 Summary of sizes of cDNA inserts of human breast tissue 132 recombinant clones H I, H2, H3, H4 and H5, estimated by
PCR.
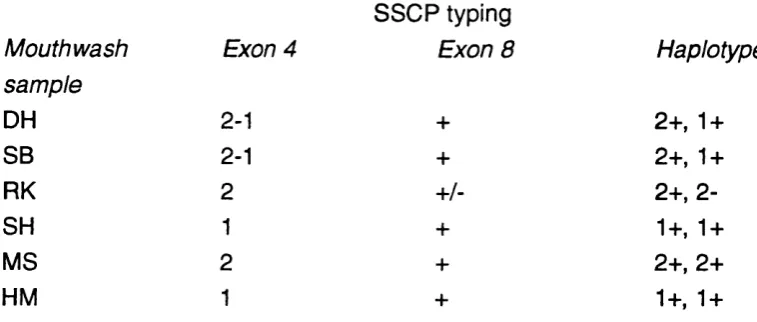
Table 5.4 Summary of the SSCP analysis of PGM1 exon 4 and exon 8 149 from mothers' DNA samples, and the deduced PGM1
haplotypes of these individuals.
Chapter Six Discussion
ATP adenosine 5' triphosphate
bp base pair
BSA bovine serum albumin
cDNA complementary deoxyribonucleic acid
Ci curie
GIF calf intestinal phosphatase
cpm counts per minute
DAB diaminobenzidine
ddw double distilled water DERG diethylpyrocarbonate DNA deoxyribonucleic acid
DNAse deoxyribonuclease
dNTP deoxynucleoside triphosphate
DTT dithiothreitol
EDTA ethylenediaminetetraacetic acid 1ER isoelectric focusing
IPTG isopropyl-p-D-thiogalactopyranoside
kb kilobase
min minute
MMLV Moloney murine leukaemia virus
MTT (3-[4,5-dimethylthiazol-2-yl]-2,5)-diphenyltetrazolium bromide
MW molecular weight
nt nucleotide
OD optical density
PGR polymerase chain reaction
PEG polyethylene glycol
pfu plaque forming unit
PGM phosphoglucom utase
PGM phosphoglucomutase gene
pipes 1,4-piperazinediethanesulphonic acid PMS phenazine methosulphate
psi pounds per square inch
PSM phage storage medium
RNAsin ribonuclease inhibitor rpm revolutions per minute
SAP shrimp alkaline phosphatase BCD systemic carnitine deficiency SDS sodium dodecyl sulphate
TEMED N,N,N',N'-tetramethylethylenediamine Tris 2-amino-2(hydroxymethyl)-propane-1,3-diol
UV ultraviolet
Chapter One
Introduction
Phosphoglucomutase is an enzyme central to glycolysis and
gluconeogenesis. In evolutionary terms it is an ancient protein, found in all orders of organisms from bacteria to mammals, reflecting its important position in a central metabolic pathway. PGM1 was one of the first polymorphic loci to be recognised. The high degree of genetic variation and the occurrence of multiple loci has made it the focus of genetic, forensic and molecular studies.
Phosphoglucomutase will be presented here in its historical context together with a discussion of its catalytic properties. Genetic studies will also be presented, revealing insight into the molecular basis of the polymorphism of PGM1, and ideas concerning the evolutionary mechanisms which gave rise to the PGM gene family.
1.1 Phosphoglucomutase - the enzvme 1.1.1 The historical context
The history of research into the glycolytic pathway can be traced to the turn of this century when interest was stimulated by the studies of mechanisms involved in alcoholic fermentation. Important contributions were made in 1905 by Harden and Young. They observed that inorganic phosphate disappeared in the course of fermentation and inferred that it was being incorporated into sugar phosphate. Two types of components in fermentations were recognised, and later identified as enzymes and cofactors (metal ions, ATP, ADP and
coenzymes). Later, studies of muscle extracts showed that many of the individual reactions which were steps in lactic acid biosynthesis and alcoholic fermentations were the same and this finally led to the elucidation of the glycolytic pathway in
1940.
By the mid 1930's the existence of enzymes that catalyse an
1-phosphate) can be converted to glucose 6-phosphate and hence enter the glycolytic pathway.
In the deduction of the catalytic activity of PGM, Leloir et al, (1948) and Cardini ef a/(1949) found that glucose 1-6 bisphosphate played an important part in the reaction. It acts as a type of cofactor for the enzyme (Ray and Roscilli, 1964) and is formed as an intermediate in catalysis when the phosphoryl group of the active enzyme molecule is transferred to the hydroxyl group at C6 of glucose
1-phosphate. The C l phosphoryl group of this intermediate is then transferred to the active site of the enzyme resulting in glucose 6-phosphate and regeneration of the phosphoenzyme (Najar and Pullman, 1954). At equilibrium the reaction mixture contains 95% glucose 6-phosphate (Stryer, 1988). The phosphoryl group on PGM is slowly lost by hydrolysis, but is restored by phosphoryl transfer from glucose 1,6 bisphosphate, catalysed by phosphoglucokinase. An analagous cataltytic activity is that of phosphoglyceromutase, which functions in glycolysis interconverting 3 phosphoglycerate to 2 phosphoglycerate. A phosphoenzyme intermediate also participates in this reaction.
1.1.2 Purification of PGM protein
Purified PGM protein was first isolated from rabbit muscle tissue extracts (Najar, 1955; Najar, 1962; Joshi e ta ! 1967; Ray and Peck, 1972) by a series of precipitations involving pH, heat, and addition of ammonium sulphate with
subsequent purification on modified cellulose or Sephadex resins. Procedures for the isolation of PGM protein from a variety of other organisms, both prokaryotic and eukaryotic, including shark muscle (Hashimoto and Handler, 1966), human muscle (Joshi et at, 1967), rabbit liver, rat muscle, rat liver (Joshi et al, 1967; Hashimoto et al, 1967) and Escherichia co//(Joshi and Handler, 1964) were developed.
1.1.3 PGM isoforms
were compared implicating a second structural locus, PGM2 (Hopkinson and Harris, 1965). Subsequent studies of mouse PGM isozymes also revealed
several distinct molecular forms which could be divided into at least two zones of PGM components and the PGM phenotype was shown to be determined by at least two different genes (Shows etal, 1969).
While the isozymes attributable to these two loci made up the majority of PGM activity in human tissues, electrophoretic analysis of fibroblast cells
revealed a third set of components (Hopkinson and Harris, 1968). The genetic variation in the electrophoretic patterns of these isozymes was independant of that identified for PGM1 and PGM2, thus implying the presence of a third locus, PGM3.
The relative positions of the three sets of isozymes as demonstrated by starch gel electrophoresis are illustrated in Fig.11. The sets of isozymes
associated with each PGM isoform are composed of both primary polypeptide products (the least anodal bands) and more negatively charged secondary modification products: in addition to the primary product each isozyme set
includes two or three secondary isozymes. The relative activities of the isozymes in a set determined by any one locus varies with the average age of the cell population sampled (Harris, 1980). For example, the primary polypeptide product is more prominent in extracts of cultured lymphocytoid cells, where there is more new protein, than in normal circulating red cells where the average age of the proteins is greater (Fisher and Harris, 1972). The in vivo mechanism of the post- translational modification generating the secondary isozymes is not known in detail, but might be due to deamidation of certain asparagine or glutamine residues in the molecule (Harris, 1980).
1.1.3.1 Structural and physical properties
+
À
PGM3 type 2) 2 2-1 1
PGM1 type 1 2-1
> P G M 3
J
> P G M 2
J
>PGM1
y
origin
Fig. 1.1
by PGM1 and PGM2 isozymes but no PGM3 isozymes are found, however, in fibroblasts, PGM3 isozymes are relatively more active and account for
approximately 7% of the PGM activity.
It is interesting to compare the physical properties of the three loci products.The active isozymes are all monomeric.The sizes of the human PGM isozymes have been estimated by gel filtration and ultracentrifugation (Joshi etal, 1967; Santachiara and Modiano, 1969(a); McAlpine etal, 1970). These studies indicate that the isozymes determined by different alleles at the same locus, and those within a set determined by a single allele have the same molecular weight. In contrast, size measurements of the products of different loci, made by gel filtration, show each to be different (McAlpine et al, 1970). A consensus of the sizes presents the PGM2 isozymes at M.W. 61,000, significantly larger than the PGM3 isozymes (M.W. 53,000) which are slightly larger than the PGM1
isozymes (M.W. 51,000).
1.1.3.2 Genetic properties
Starch gel electrophoresis studies revealed the existence of three isoforms of PGM, but in addition differences in the banding patterns were seen amongst individuals. As such PGM became one of the first genetic polymorphisms to be studied by electrophoresis. Each of the isoforms PGM1, PGM2 and PGM3 exhibits different degrees of polymorphism and varying frequencies of these forms in different populations.
The PGM1 locus is the most widely studied of the three PGM loci. The phenotypes were first separated using starch gel electrophoresis (Spencer et a/, 1964). Four isozyme bands were identified: two bands associated with one allele designated PGM1*1 and two bands with a second allele, PGM1*2. In each case one of the bands is the primary gene product and the other is a secondary
modification product. PGM1*1 is found at a frequency of 0.757 and PGMV2. at a frequency of 0.242 (Harris and Hopkinson, 1976). In addition to these alleles, other rare electrophoretic variants have been observed. The alleles PGMV3,
PGM1*4 and PGM1*5vjere identified by starch gel electrophoresis and observed
in heterozygous combination with one of the common alleles (Hopkinson and Harris, 1965). Alleles PGM1 *6 and PGM1 *7 were also identified in heterozygous combination with both PGMV1 and PGM1*2. The frequency of these alleles was found to be very low in 'English' populations. In each case (from a group of 2000 individuals) only one example of each of the alleles PGM1*3, PGM1*4, PGM1*5
and PGM1 *7 was observed (Hopkinson and Harris, 1966). However, the PG M V3
and PGM1*7 alleles occur with higher frequencies in Japanese populations
(reviewed in Blake and Omoto, 1975) with PGM1*7 at 0.014 and PGM1*3 at 0.0015. The PGM1*3 allele determines two new isozyme bands with mobilities slower than the fastest PGM1*2 band and faster than the slowest PGM2 band, and the PGM1*7 type has two components, one at a similar position to the fastest component of PGM1*1 and the other faster than the fastest PGMV2. band.
The development of isoelectric focusing allowed further investigation of protein polymorphisms. In this type of electrophoresis the thin layer
2-1
2
+2
-1
+1
-■
■
■
starch gel electrophoresis PGM1 bands
Isoelectric ^ focusing
PGM1 bands
Fig.1.2
contributions of negatively and positively charged groups exactly balance. Using this method a further interpretation of the PGM1 system was made by Bark et al (1976), this is illustrated in Fig.1.2. The PGM1 1 phenotype was further resolved as three phenotypes designated PGM1 1+, PGM1 1-, PGM1 1+1-; the PGM1 2 phenotype was resolved as the three phenotypes designated PGM1 2+, PGM1 2- PGM1 2+2-; the PGM1 2-1 phenotype was resolved as four phenotypes
designated PGM1 2-1+, PGM1 2+1-, PGM1 2-1- and PGM1 2+1+. This now gave a total of ten common PGM1 phenotypes explained by the occurrence of four common alleles PGM1*1+, PGM1*1-, PGM1*2+ and PGM1*2- .In each case the '+' refers to the more anodal band and the to the more cathodal band. The new interpretation increased the value of PGM1 as a forensic marker in the
identification of individuals. This can be expressed in terms of "discrimination power" which is the probability that two individuals would differ in phenotype (Sensabaugh, 1982). With the starch gel resolution of phenotypes the
discriminating power is 0.56 (56 pairs out of 200 pairs of samples are
discriminated) whereas with isoelectric focusing typing the discriminating power is 0.74 (74 pairs out of 200 are discriminated) (Bark et ai, 1976).
All populations studied have the PGM1 1 and PGM1 2 groups of
phenotypes (Hopkinson and Harris, 1966). The frequencies of the four common alleles PGM1*1+, PGMV1-, PGM1*2+ and PGM1*2- vary within populations (reviewed in Roychoudhury and Nei, 1988) however a study of four human
populations showed that PGM1*1+ is the most frequently occurring allele, with for example a frequency of 0.62 in Northern European populations (Carter etal, 1979). Variations in the frequencies of these four common alleles between different racial populations, although statistically significant (Carter et al, 1979), do not give discriminating power between races (Sensabaugh, 1982).
between '+' and for both the 1 and 2 alleles is similar. This key observation led to the novel suggestion that the other alleles could have evolved from PGM1*1+ by two independant mutations, one forming the'-' type and the other the '2' type, and a subsequent intragenic crossover between the different alleles to form the fourth '2-' type. The mechanism could be applied to the evolution of the other rarer allelic types and indeed this idea was expanded by Takahashi e ta l (1982) with particular reference to the PGM1*3an6 PGM1 *7 aWeles. The proposed phylogeny is depicted in Figl.3. They proposed that the four alleles PGM1*3+,
PGM1*3‘ , PGM1*7+an6 PGM1*7- could be explained by one more nucleotide
substitution and a further three intragenic recombination events.
In summary, the model proposes a total of three nucleotide substitutions and four intragenic recombination events at two separate sites to form the eight common alleles. The involvement of intragenic reciprocal recombination in the creation of variation within a locus is rare. This type of exchange of genetic information causes no alteration in the overall size of the locus, relatively subtle protein variation and can be difficult to distinguish from more usual
polymorphisms involving point mutations only. In contrast, unequal intragenic recombination leads to gain or loss of genetic material forming hybrid genes and therefore greater changes to the resultant protein seen, for example, in the globin genes coding for Lepore haemoglobin (Weatherall etal, 1989).
PGM2 is monomorphic in virtually all populations with individuals
homozygous for the PGM2*1 allele. However, it was the recognition of some rare, independently segregating variants which led to the firm identification of PGM2 as a separate locus (Hopkinson and Harris, 1965). The PGM2*2 aWele was found in black Africans living in England, Nigeria and South Africa and in these
populations achieved polymorphic frequencies (Hopkinson and Harris, 1966). In addition other rare alleles found in a study of an English family were PGM2*4ar\di
PGM2*5 (Farrington et ai, 1968), and a distinct PGM2*5 allele was observed in
1
PGM1 1 + I N
t
s N+
PGM1 2+ PGM1
1-x-over
PGM1 7+ PGM1
2-x-over
y
(also with PGM11-)x-over
(also from PGM12-)
PGM1 7-PGM1 3+
(also with PGM1 2- and PGM1 7-)
PGM1
3-Indicates mutation event indicates crossover event
X indicates position of the postulated crossover
Fig. 1.3
polymorphic frequencies (Blake and Omoto, 1975). Other recognised alleles are
PGM2*6, PGM2*6, PGM2*9 and PGM2*10 (reviewed in Blake and Omoto,
1975).
The genetics of the PGM3 polymorphism was investigated by typing the placentae from dizygotic twin births (Hopkinson and Harris, 1968). The
frequencies and electrophoretic pattern of the phenotypes could be accounted for by two alleles : PGM3*1 and PGM3*2.J\\e English population was found to be polymorphic for these two alleles with gene frequencies of 0.74 and 0.26 for
PGM3*1 and PGM3*2. respectively. In a parallel study of the Nigerian population,
the same alleles were represented at different frequencies of 0.34 and 0.66 for
PGM3*1 and PGM3*2. respectively. All populations studied so far are
polymorphic at this locus. European, Asian and North American gene frequencies are in a similar range to those first described for the English population, whereas the Australian frequencies are between the English and the Nigerian values (reviewed in Roychoudhury and Nei, 1988),
1.1.3.3 Chromosome assignments of PGM1. PGM2 and PGM3
Due to the polymorphic nature of the three PGM loci, it has been possible to assign them to chromosomes by isozyme and linkage analysis. Isozyme analysis in rodent-human somatic cell hybrids allowed PGM1 to be assigned to chromosome 1 (Harris, 1980) and the regional localisation was then refined by linkage analysis to 1p22 (Bruns and Sherman, 1989). In the CEPH consortium linkage map of human chromosome 1 (Dracopoli etal, 1991) multipoint analysis of 58 loci on chromosome 1 positioned PGM1 distal to the markers D1S22 and ACADM and proximal to D1S19. The same order was reported by Pakstis e ta l (1989) after linkage analysis of non-CEPH pedigrees but the shortest region of overlap of these markers implied that PGM1 must lie in 1p31. PGM2 vjas
assigned to chromosome 4 at 4p14-q12, and PGM 3\o chromosome 6 at 6q12 (McAlpine etal, 1990).
1.1.3.4 PGM4- is there a fourth PGM locus?
days previously. The electrophoresis pattern of each milk sample was compared with that of a sample of erythrocytes from the same woman. Eight milk specific phenotypes were distinguished and explained on the basis of a distinct PGM locus with four alleles PGM4*1, PGM4*2, and PGM4*4. The PGM4-4 homozygote was not found and the *4 allele was only found in combination with
*1 and *2 alleles. The gene frequencies of the alleles were studied and analysis showed good agreement with the Hardy-Weinberg expectation (Cantu and Ibarra, 1982).
Other studies were made of PGM4. For example, tests using a pentose sugar as substrate showed that PGM activity in milk did not show
phosphopentomutase activity (characteristic of PGM2). Thermostability tests were conducted with samples heated to a range of temperatures before
electrophoresis. These showed that after 15 minutes PGM4 activity disappeared at 60°C, PGM1 at 65^0 and PGM2 at 7 0 % . This result is in accordance with previous estimates of thermostability (McAlpine eta/, 1970), where after 10 minutes heating at 6 0 ^0 both PGM1 and PGM2 isozymes were stable , and after 20 minutes at 6 0 % PGM1 isozymes had reduced but still detectable activity and PGM2 isozymes had intact activity. Thus, this result supports the idea of a
distinct PGM protein, PGM4.
Cantu and Ibarra found that in non-lactating mammary gland extract, PGM activity was composed of PGM1 and PGM2 isozymes. In milk however they saw no evidence of these isozymes and so proposed a 'switch' from PGM1 and PG/W2 gene expression to PGM4 gene expression, which is reversible and
probably dependant on the hormonally controlled activation of lactation. Kvito and Weimer expanded on this proposal in their study of PGM activity in milk samples taken from a Brazilian population (Kvito and Weimer, 1990). Electrophoresis patterns in 652 colostrum samples (taken 24 to 48 hours after birth) were typed and milk samples from 175 of these individuals were typed approximately 17 days later. The same eight phenotypes were identified in this study as in Cantu and Ibarra's study. However, in the Brazilian study, the gene frequencies of the alleles seen in the colostrum samples did not fit the Hardy-Weinburg equilibrium, and furthermore, in 15% of the colostrum samples no PGM activity was
changes were always from a proposed homozygote to a heterozygote phenotype. As in the Mexican study, gene frequencies of alleles in the milk samples did fit the Hardy-Weinburg expected values but the frequencies were dissimilar to those of the Mexican population.
To explain their observations Kvito and Weimer (1990) proposed either that there may be differences in enzyme activity at the beginning of lactation or that there may be variability in regulation of the locus. In the first proposal, low activity may result in false typing initially of the colostrum with higher activity later in lactation accounting for the apparent changes in phenotype. In the second proposal they suggest segregation of two regulatory alleles, one for early and one for late activation. The homozygote 'late' individual would have no PGM activity in colostrum, the homozygote 'early' would have the same phenotype in colostrum and milk, whereas the heterozygote would have a changing
phenotype. A possible molecular model for the regulatory allele would be changes in the promoter and upstream regulatory regions which altered the binding of hormone receptor sites hence altering sensitivity to hormonal activation of lactation. From the results of their study there appears to be no association between structural allele status and regulatory allele status. In this case the model for variability in regulation of the locus becomes complex, with all combinations of late and early and all of the four recognised structural alleles necessary to explain the observed electrophoretic patterns. In view of this
complexity, the first proposal of differential activity of the enzyme during lactation is perhaps more attractive and could be explained by environmental factors affecting the general health of the mother: in this context it would be of interest to investigate the activity levels of other enzymes in milk samples.
Confirmation of a distinct gene locus can often be provided by
demonstrating inherited independant, genetic variation. However, since PGM4 shows expression only in milk, it is precluded from this type of study. In view of the lack of information about the heritability of the putative polymorphism, another interpretation of the data is that PGM4 is encoded by PGM1 and arises either by modification of the PGM1 mRNA or protein product. For example the PGM1 gene could undergo alternative splicing events, or PGM1 protein could be modified post-translationally.
1.1.4 Multiple loci
As described above there are at least three isoforms PGM1, PGM2 and PGM3 encoded by three separate gene loci. Gene families are a feature common to many proteins, including other enzymes which act in glycolysis. Isoforms of enzymes were initially grouped together on the basis of similar catalytic
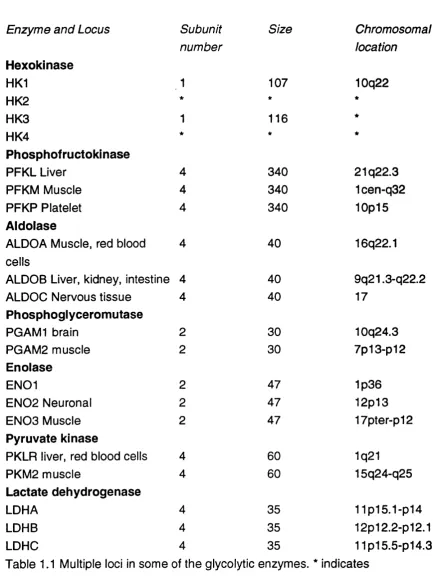
properties but structural studies of the proteins, and in most cases analysis at the level of the cDNA, have confirmed the evolutionary relationship of members of the gene family. Table 1.1 summarises details of multiple loci of some glycolytic enzymes.
It is intriguing that many of the enzymes in the glycolytic pathway show evidence of gene duplication. Exceptions are glucose phosphate isomerase, those phosphate isomerase and phosphoglycerate kinase with only one isoform each. Glyceraldehyde 6-phosphate dehydrogenase has a single active locus, but many pseudogenes. As yet there is no evidence to suggest that the PGM gene family includes pseudogenes.
1.1.5 Protein structure
Enzyme and Locus Subunit number 1 1 4 4 4 Hexokinase HK1 HK2 HK3 HK4 Phosphofructokinase PFKL Liver PFKM Muscle PFKP Platelet
Aldolase
ALDOA Muscle, red blood cells
ALDOB Liver, kidney, intestine ALDOC Nervous tissue
Phosphoglyceromutase
PGAM1 brain PGAM2 muscle
Enolase
EN01
EN02 Neuronal EN03 Muscle
Pyruvate kinase
PKLR liver, red blood cells PKM2 muscle
Lactate dehydrogenase
LDHA LDHB LDHC
of each fragment. The fragments themselves were ordered by identifying
peptides produced after a lysine-blocked trypsin digest. The sequence obtained was 561 residues long and the protein molecular weight was calculated as
61,609, considerably larger than in previous estimates (McAlpine ef a/, 1970 (a)). The active site of the enzyme was known to contain a phosphoryl goup
(discussed in section 1.1.1), Ray ef a/defined this as the phosphoserine residue, serine 116. There was found to be no obvious sequence similarities with the phosphoglycerate mutase from yeast (Ray etal, 1972) nor with alkaline phosphatase, a phosphate-transferring enzyme, (from Escherichia coli, Bradshaw etal, 1981). PGM was distinguished by its unusually long and frequently occurring stretches of hydrophobic residues.
The three dimensional structure was described by Lin ef a /(1986) and further refined by Dai ef a/in 1992. The PGM monomer contains 42
strands/helices arranged in four oc/p domains. The appearance of the monomer is that of a thick, 'heart-shaped' box. There is an unusually deep crevice between the two lobes which involves 58 residues. The active site of the enzyme is buried at the bottom of the cleft at approximately the position where the four domains meet. The active-site cleft is large (volume of 4000-6000A3) relative to the size of the normal substrate, compared to fructose bisphosphatase for example (which has a substrate of the same molecular weight) where the active site cleft is only 600A3. The metal-ion binding loop (which binds Mg^+) is composed of the
sequence -Asp-Gly-Asp-Gly-Asp- and is found in domain II at the very bottom of the active site cleft. The two lobes of PGM are formed by domains I and IV and are connected by domains II and III, giving a more robust connection than seen in other enzymes with a two-lobed structure such as phosphoglycerate kinase (Banks etal, 1979).
Dai ef a /(1992) noted that only four other four-domain globular proteins have been reported (wheat germ agglutinin, aconitase, and the related
phosphorylase. As mentioned previously no amino acid sequence similarities were seen between PGM and either phosphoglycerate mutase or alkaline phosphatase and this disimilarity is seen again when comparing their structures.
1.1.6 Immunological studies
Polyclonal antibodies were raised against PGM protein (Whitehouse etal, 1989) by immunising a sheep with a commercially made preparation of purified rabbit skeletal muscle PGM. An IgG fraction of the serum was prepared and was found to recognise both purified rabbit muscle PGM and PGM from a crude extract of rabbit muscle material, on both SDS and isoelectric focusing gels. The same immunoglobulins were shown to cross-react with a human protein after SDS gel electrophoresis of human tissue homogenates. The protein detected was determined to be PGM from its molecular size. Furthermore, the antibody detected the isozyme patterns usually detected by activity staining and
characteristic of the PGM1 genetic polymorphism. The antiserum was found to be a more sensitive reagent than activity staining for the detection of rabbit PGM, but was less sensitive in detecting human PGM.
Drago at al (1991) investigated the cross-reactivity of the anti-rabbit muscle PGM antibodies to the other human PGM isozymes, PGM2 and PGM3. By incubating suitable tissue extracts and haemolysates with the IgG antibody fraction and then separating the extracts by starch gel electrophoresis, it was demonstrated that PGM2 and PGM3 activities were undiminished and thus PGM2 and PGM3 are probably not immunoreactive. This implies a large structural divergence between PGM1 and both PGM2 and PGM3 which is reflected in the earlier description of their differing physical properties. As
described above (section 1.1.3.4) the antibodies did react with PGM4 isozymes, and this observation could be taken to support the model of a recent gene
1.2 PG M the gene
1.2.1 Isolation and characterisation of PGM1 cDNA
A method for cloning genes, using antibodies as probes for polypeptide products, was developed whereby large libraries of recombinant DNA in the phage expression vector A,gt11 could be rapidly screened (Young and Davis, 1983 (a); Young and Davis, 1983 (b)). Clearly this was a powerful technique for the isolation of genes whose protein products were easily purified. Therefore, the development of anti-rabbit muscle PGM antibodies soon after the development of the first cDNA expression libraries made the cloning of the PGM1 gene a real possibility.
As described in section 1.1.6, the anti-rabbit muscle PGM antibodies were found to be a highly sensitive reagent in the detection of rabbit PGM but were less sensitive in the detection of human PGM1 ; it was subsequently found that the antibodies were not sufficiently sensitive to detect human PGM1 expressed in phage expression libraries .The approach therefore taken was to employ the antibodies to clone the rabbit PGM cDNA from a rabbit muscle cDNA library, and then to use the rabbit PGM1 cDNA to isolate the human PGM1 cDNA from a human muscle cDNA library (Whitehouse et a I, 1992). Positive clones from the human muscle cDNA library and the original rabbit cDNAs were sequenced.
Human PGM1 cDNAs detected mRNA bands of aproximately 2.3 kilobases after Northern Blot analysis of human skeletal muscle RNA. The full length of the human cDNA was 2320 base pairs, and of the rabbit cDNA 2279 base pairs. A comparison of the rabbit and human PGM nucleotide sequences showed 92% homology. From the sequence data each RNA was found to have an open reading frame of 1686 base pairs. The 5' untranslated region was 62 base pairs in the human mRNA and 39 base pairs in rabbit while the 3'
When translated into amino acids, the derived rabbit sequence agreed completely with the published rabbit muscle PGM amino acid sequence (Ray et al, 1983) and the human sequence showed 97% homology with the derived rabbit sequence (Whitehouse etal, 1992). The amino terminals of the two proteins are more conserved than the carboxyl terminals, including an eighty three amino acid region of complete conservation spanning the active site region and including the active serine (residue 116). Nine of the eighteen amino acid substitutions between human and rabbit are in the final 145 amino acid residues; the residue changes give a higher positive charge to the rabbit protein and this is reflected in its more basic isoelectric point (Whitehouse etal, 1989). The
molecular weight derived from the amino acid translation of the human cDNA is 61,300 which is in close agreement with the work of Ray etal(^9& 3) and is considerably larger than the previous estimate by gel-filtration chromotography (McAlpine et al, 1970 (a)). In accordance with the findings of Ray ef a /(1983) that there were no protein similarities between rabbit muscle PGM and yeast
phophoglycerate mutase, Whitehouse et al (1992) could show no homologies between human PGM1 nucleotide sequence and that of human muscle-specific phosphoglycerate mutase (Shanske etal, 1987) and diphosphoglycerate mutase (Joulin etal, 1986).
The cloning of the PGM1 gene allowed direct chromosomal localisation of the locus, by in situ hybridisation, to 1p31 (Whitehouse etal, 1992).
The human cDNA was used as a probe in a Southern Blot analysis which demonstrated that PGM1 is conserved in vertebrates including primates (e.g. orangutan), birds (e.g. chicken) and amphibia (e.g. Xenopus) (Whitehouse etal, 1992). However, the PGM2 and PGM3 loci were not detected with the human PGM1 cDNA by either Southern Blot analysis nor by in situ hybridisation to chromosomes. This observation complements that of no cross-reactivity
observed between anti-PGMI antibodies and PGM2 and PGM3 (Whitehouse et al, 1989) as discussed in section 1.1.6.
unrelated individuals, using the PGM1 cDNA as probe (Hollyoake etal, 1992). From family studies there was found to be complete linkage between the two sites, and between the sites and the +/■ PGM1 protein polymorphism. Using a fragment of the cDNA from the 3' end as probe only one polymorphic Tacf site could be detected and this was mapped to a position approximately 1.3 kilobases downstream of the most 3' exon. A third polymorphism has been described on the basis of base pair changes at three sites spanning 81 base pairs in the 3' untranslated region of the PGM1 gene (March etal, 1993). The observed gene frequencies of four alleles fitted with the Hardy-Weinburg expectation. A
comparison of the PGM1.3' phenotypes and PGM1 isozyme polymorphism showed a high level of linkage disequilibrium between the +/- protein
polymorphism and the PGM 1.3' polymorphism. The positioning of the Tacji and 3* untranslated polymorphisms and their tight linkage to the +/- PGM1 protein
polymorphism strongly indicated that the position of the +/- mutation must lie towards the 3' end of the PGM1 gene. Furthermore, as the polymorphisms did not show association with the 2/1 protein polymorphism, these results provided support for the model of two distinct sites in the gene determining the 2/1 and +/- mutation positions separated by a region where intragenic recombination occurs (March etal, 1993).
1.3 Clinical aspects of PGM
1.3.1 Deficiencies of enzymes involved in glycogen metabolism
Glycogen is present in all animal cells and especially abundant in the liver and in skeletal muscle. Regulation of glycogen metabolism involves both
homeostatic and hormonal mechanisms. Alterations in the amount and structure of glycogen can be caused by defects in enzymes and transporters involved in glycogen metabolism. Such defects are clinically described as diseases of glycogen storage, or the glycogenoses.
Gierke's disease" for this type of deficiency, which was also termed Type I glycogen storage disease.
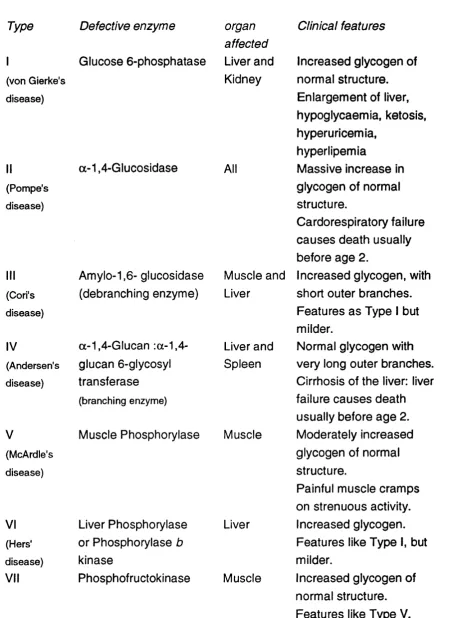
The causative defects in at least ten other glycogenoses have been identified, and the numerical classification has been extended to at least number VII. The affected organs and both the structure and amount of glycogen present has been investigated and the data for types I to VII is summarised in table 1.2 (Brown and Brown, 1968; Hers et al, 1989). The ways in which glycogen is stored and utilised in liver and muscle differs and is reflected in the clinical expressions of the different defects. In liver the glycogen is stored to provide glucose to the blood for the benefit of other tissues. In diseases types I, III and VI, where the liver is affected, the tissue cannot convert glycogen to glucose which leads to hepatomegaly (increase in the size of hepatocytes) and hypoglycaemia. In muscle the glycogen is there to provide a fuel for contraction, and defects cause milder symptoms limiting strenuous exercise. These symptoms are seen in types V, VII, III and a subgroup of type VI. In types II and IV the defect is not in
degradation of glycogen but in its location and structure. Type II cases are identified by the presence of many membrane-bound, glycogen filled vacuoles in all tissues. TypelV cases are distinguished by glycogen with abnormally long branches found in many tissues but especially the liver and spleen.
The glycogenoses are inherited in an autosomal recessive fashion (reviewed in Hers etal, 1989). A complex exception is that of type VI which includes at least three genetic defects (Lederer etal, 1975) : autosomal
phosphorylase b kinase deficiency , liver phosphorylase deficiency, and X-linked phosphorylase b kinase deficiency (Huijing and Fernandes, 1969).
1.3.2 PGM deficiency
The first reported case of PGM deficiency was of a four year old boy who presented with abnormal gait (Thomson etal, 1963). The case history of the child revealed episodes of abnormal heartbeat in early childhood, with subsequent normal development until the age of 2 V2 years. At this age he began to walk on his toes, but had no muscular pain and did not tire sooner than other children of his age. On examination he was found to have a generally slightly weak muscle tone for his age and both gastrocnemii showed marked shortening which
Type Defective enzyme
I Glucose 6-phosphatase
(von Gierke's disease) (Pompe's disease) (Cori's disease) IV (Andersen's disease) V (McArdle's disease) VI (Hers' disease) VII a-1,4-Glucosidase Amylo-1,6- glucosidase (debranching enzyme)
a-1,4-G!ucan :a-1,4- glucan 6-glycosyl transferase (branching enzyme) organ affected Liver and Kidney All Muscle and Liver Liver and Spleen
Muscle Phosphorylase Muscle
Liver Phosphorylase Liver or Phosphorylase b
kinase
Phosphofructokinase Muscle
Clinical features
Increased glycogen of normal structure. Enlargement of liver, hypoglycaemia, ketosis, hyperuricemia,
hyperlipemia
Massive increase in glycogen of normal structure.
Cardorespiratory failure causes death usually before age 2.
Increased glycogen, with short outer branches. Features as Type I but milder.
Normal glycogen with very long outer branches. Cirrhosis of the liver: liver failure causes death usually before age 2. Moderately increased glycogen of normal structure.
Painful muscle cramps on strenuous activity. Increased glycogen. Features like Type I, but milder.
biopsies (by the periodic acid-Schiff method) revealed abnormally large amounts of glycogen in the sarcoplasm and under the sarcolemma in the muscle fibres of the gastrocnemius. Determination of glycogen content of the biopsies
demonstrated that the child had skeletal muscle glycogenosis. Glycogenoses types I, II, III, IV and VI were excluded as candidates because symptoms of hepatomegaly, cardiac enlargement and abnormal glycogen structure were not observed.
In active muscle, anaerobic glycolysis provides most of the energy needed and this is reflected in a rise in lactic acid concentration; the subject did not show the sharp increase expected, which is indicative of defective muscle glycolysis. The nature of the defects was examined by measuring the lactic acid produced after anaerobic glycolysis by muscle homogenates in the presence of various substrates. The defects seemed to involve the glycolytic pathway widely, but PGM was notably severly deficient (no direct assay for PGM was made). At the time of investigation the case was classified as type V but with adequate muscle phosphorylase activity. However, muscle phosphorylase deficient cases are now classed as type V, so this early case should be excluded from this grouping. Thomson e t a l{1963) give an explanation for the suficient glycolysis observed in this case. Although the PGM activity is still adequate for provision of enough glucose-1-phosphate for glycogen synthesis by the UDPG system, the need for PGM in glycogen degradation is by-passed by amylo-1,6-glucosidase. This enzyme degrades glycogen to free glucose, which is then converted to glucose- 6-phosphate by hexokinase (in the presence of ATP) which can enter the
glycolytic pathway.
liver level. Muscle from the same individual did not have excess glycogen storage, but PGM activity levels were found to be reduced in muscle, although not to the same extent as found in liver.
A third case of PGM deficiency was described by Sugie et al (1988). A 5 month-old boy with lethargy and poor weight gain was shown to have significantly low serum and muscle carnitine levels (60% and 10% of control means
respectively) suggesting systemic carnitine deficiency syndrome (SCO). A muscle biopsy showed a slight accumulation of glycogen; an in vitro study on aerobic glycolysis confirmed a block after glucose-1-phosphate and before glucose-6-phosphate and direct measurement showed PGM to be at 11% of the control mean. Sugie et al (1988) propose that the specific deficiency of PGM is the primary abnormality in this case, and that PGM deficiency can be recognised as the cause of secondary systemic carnitine deficiency syndrome. The
mechanism proposed to explain the carnitine deficiency is that impairment of the glycolytic pathway might enhance use of lipids to supplement the energy supply for muscle contraction. Excess acyl CoA would be formed in muscle cells causing a biased acyl CoA/ CoA-SH ratio. Carnitine modulates this ratio such that excess acyl CoA would be converted to acyl carnitine and in the process deplete the carnitine levels.
1.4 Objectives
When this project began, the human and rabbit PGM1 cDNAs had been cloned. The primary objective was to establish the molecular basis of the PGM1 genetic polymorphism with a view to testing the hypothesis that recombination was a major factor in the generation of different alleles.
In addition, the broad expression of PGM1 predicted that the gene was likely to be 'house-keeping' in nature, and therefore another objective was to identify the promoter region. This was part of a group based effort to establish the structure of the entire PGM1 gene.
The PGM1 cDNA provided a useful tool to try to recover other members of the PGM gene family and to investigate the nature of the PGM4 milk isozymes.
In brief my major aims were:
1. To take part in the resolution of the molecular basis of the PGM1
polymorphism by sequence analysis of DNA from individuals of known PGM1 phenotype.
2. To isolate clones which encoded the PGM1 promoter region and characterise the 5' region of the PGM1 gene by restriction mapping, sequence analysis and RNAse protection assays.
3. To attempt to isolate other members of the gene family in particular PGM3 using the PGM1 cDNA as probe on a sorted chromosome 6 library.
Chapter Two
Materials and Methods
2.1 Materials
2.1.1 Standard reagents
Analar grade standard reagents were supplied by Sigma, Fisons and BDH/Merck, Sharpe & Dome.
2.1.2 Enzymes
Restriction enzymes were supplied by Betheseda Research Laboratories (BRL), and Boehringer Mannheim. All other enzymes were from Boehringer Mannheim except Tag polymerase from Advanced Biotechnologies, and shrimp alkaline phosphatase and Sequenase from USB/Amersham.
2.1.3 Electrophoresis reagents
Agarose was from ICN, and Nusieve low melting point agarose from PMC Bioproducts. Acrylamide was from BIO-RAD; TEMED was from BDH.
Ampholines for lEF were supplied by LKB Pharmacia.
2.1.4 Miscellaneous
2.1.5 Common buffers
10 xTBE: 890mM Tris. HCI, 890mM Boric acid, 20mM EDTA
IxTE: 10mM Tris. HCI and ImM EDTA, pH 7.5
20xSSC: 3.0M NaCI, 0.3M Na citrate, pH to 7.0 with citric acid
PBS: 137mM NaCI, 2mM KCI, 8mM Na2HP04, 1.5mM KH2PO4
TBS (lOx): lOOmM Tris. HCI pH 7.5, 1.7M NaCI.
PSM: lOOmM NaCI, 8mM MgS04, 50mM Tris. HCI pH 7.2, 0 .01% gelatin
lOOxDenhardt's: 2% Ficoll, 2% polyvinylpyrrolidone, 2% BSA
'Phenol' refers to phenol equilibrated with TE pH 7.5
'Chloroform' refers to a 24:1 (v/v) mixture of chloroform and isoamyl alcohol
'Phenol/chloroform' refers to a 25:24:1 (v/v) mixture of equilibrated phenol, chloroform and isoamyl alcohol
'Polyacrylamide' refers to a 29:1 mixture of acrylamide and bis acrylamide
2.1.6 Microbiology media
Tryptone, Yeast Extract and Bacto agar from Difco.
L-broth (L-1): lOg Tryptone, 5g Yeast Extract, 5g NaCI, 1 g glucose
L-agar (L"1): as L-broth but with glucose omitted and 14g Bacto agar added
L-agarose (L'1): as L-broth but with glucose omitted and 7g agarose added
LM-broth (L'**): lOg Tryptone, 5g Yeast Extract, 5g NaCI, 2g MgS0 4 .7H2 0
LM-agar (L’ "*): as LM-broth with 14g Bacto agar added
LM-agarose (L"1): as LM-broth with 7g agarose added
2xVT (L-1): lOg Tryptone, lOg Yeast Extract, 5g NaCI
H-agar (L-1): lOg Tryptone, 8g NaCI, 12g Bacto agar
H-top agar (L"1): lOg Tryptone, 8g NaCI, 8g Bacto agar
M9 minimal salts (L-1): 6g Na2HP04, 3g KH2PO4, 1g NH4CI, 0.5g NaCI
Glucose/mlnlmal medium plates: add to 1 litre of sterile M9 salts: 1 ml 1M MgS0 4 , 1ml 0.1M CaCl2, 1m l1M Thiamine HCL, 10ml 20% (w/v) glucose
2.1.7 Bacterial strains
JM IO I (M13 host): supE thi (lac-proAB). F[traD36proAB'^ lacR lacZMIS], r+m+
RR1 (pUC host): supE44 /7sc/S20(rB“mB") ara-14 proA2 /acYT galKZ
rpsh20 xyl-5 mfAl
XLIBIue (host strain for pBluescript and Uni-ZAP): supE44 hsdR M recA^
endA^ gyrA46 thirelA I lac" F'[proAB+ lacR lacZAMIS TnlO(faf^)] {hsdR)
Y1090 (host strain for X g tll) S u p F h sd R araD^39 A/onA/acU169 rpsL
trpC22 :: Tn 10{tef^pMC9
LE392 (host strain for À2001) supE44 supFSS hsdR514 galK2 ga!T22 me/61 trpR55 iacY^
2.2 Methods
All solutions for nucleic acid work were sterilised by autoclaving (15psi, 121^0 for 20 min) or by filter sterilisation (through 0.22pm pore size 'Acrodisc', Gelman Sciences). Glassware and disposable plasticware was sterilised by autoclaving (15psi, 121^0 for 20 min). Disposable gloves were worn for all experimentation. All autoradiography involving 32p and 35g was carried out by exposure to X-ray film (Kodak), at room temperature for 35g and with an
intensifying screen at -70°C for 32p
2.2.1 DNA precipitation and assay of concentration
DNA was quantified by measurement of absorbance at 260nm; 1 OD unit=50p,g. ml-i (the ratio of OD260/OD280 should be 1.8 for pure DNA).
2.2.2 DNA modification
2.2.2.1 Restriction enzyme digests. Digests were performed using the incubation buffers provided with the enzymes and according to the conditions recommended by the manufacturer.
2.2.2 2 Dephosphorylation. The terminal phosphate of linearised vector DNA was removed to prevent self-ligation in subcloning reactions. Typically 1p.g of vector was linearised in a standard restriction enzyme digest and
phosphatased with either calf intestinal alkaline phosphatase (CIP) (Boehringer Mannheim) or shrimp alkaline phosphatase (SAP) (USB/Amersham).
When using CIP the volume was made up to 43pl with ddw and incubated with 5p,l CIP buffer and 1 unit of CIP for 15 min at 37^C, then for 15 min at 56°C. A further 1 unit of CIP was added and the two incubation stages repeated. The reaction was stopped by adding 40pl ddw, lOpI TE and SDS to 0.5% followed by incubation at 68°C for 15 min. The CIP was removed by a phenol extraction followed by a chloroform extraction and DNA recovered by ethanol precipitation and resuspended in TE at 50ng. p|-i
When using SAP the vector restriction enzyme digest was first performed in a 20pl total volume which was then directly incubated with 0.1 pi SAP (atSunits. pl"1 ) for 15 min at 37°C. A further 0.1 pi SAP was added and incubation for 30 min at 37^C was followed by heat inactivation for 5 min at Q5^C.
2.2.2 3 Ligation. Insert DNA was ligated to appropriately cut and phosphatased vector in a lOpI reaction mix, containing 20-50ng vector and generally a 3-fold molar excess of insert DNA to vector DNA in Ixligase buffer (lOx buffer is 660mM Tris-HCI, 50mM MgCl2, lOmM DTT, lOmM ATP, pH 7.5) with Ip l (lunit. p i-”*) T4 DNA ligase enzyme. Sticky-ended ligations were incubated at 15°C overnight.
DNA was resolved in 0.8-2.0% agarose gels made up and run in 1xTBE buffer, and prepared in 20x20 cm, 14x11 cm or 8x10 cm flat-bed moulds. Gels were usually run at 2V. cm-i overnight or at up to 10V. cm"i for shorter periods. Gels prepared with Nusieve low melting point agarose were run in a 4 %
temperature controlled room. DNA fragments were visualised by ethidium
bromide staining (at a concentration of I00ng.ml-1 in both gel and running buffer) and ultra-violet transillumination.
DNA fragments required for subcloning, sequencing or 32p.|abelling reactions were isolated from agarose gels by initially cutting the band from the gel under long-wave UV. Bands cut from standard agarose gels were placed inside 2 cm width boiled dialysis tubing with 300|xl TE and electroeluted by placing the sealed tube in a tank of IxTBE at 100V for 1-4 hr. The recovered solution was then ethanol precipitated. Bands cut from low melting point agarose gels were weighed and cleaned either by processing with GeneClean™ kit (BIO 101) or with Wizard™ PCR Preps DNA Purification columns (Promega) both according to the manufacturers instructions.
2.2.4 Preparation and transformation of competent E. Coli
Competent E.Co//JM101 and RR1 cells were prepared using the CaCl2 procedure as described by Maniatis et al (1982).
JM101 were grown on a minimal medium plate to preserve the F' episome containing the gene for proline synthesis (including the lac gene used for
blue/white screening of recombinants). A single JM101 colony was picked from an M9 plate into 10 ml of 2xYT and grown overnight at 3 7 ^0 with shaking. 40 ml of 2xYT was innoculated with 1 ml of the overnight culture and grown at 37°C with shaking until the culture reached an ODeoo of 0.4-0.6. The culture was centrifuged at 2500 rpm at 4°C in a MSE Mistral 2000 centrifuge. The cell pellet was re-suspended in 20 ml of ice-cold, filter-sterilised lOOmM CaCl2, lOmM Tris pH 7.5, and kept on ice for 15 min. Cells were pelleted as before and
non-recombinant phage can be distinguished due to insertional inactivation of the B- galactosidase gene of M 13. A plate of competent cells with no DNA was set up as a control for the cells and a phosphatased vector-only ligation was
transformed to test the efficiency of the dephosphorylation process.
A 10ml L-broth culture was innoculated with a single RR1 colony and grown overnight with shaking at ST^C. 100ml of L-broth was innoculated with 1ml of the overnight culture and grown with shaking at 370C until the O D 5 5 0 was 0.28. The culture was kept on ice for 30 min then spun at 2500 rpm in a MSE Mistral 2000 centrifuge for 5 min. The pellet was resuspended in 40ml ice-cold, filter-sterilised lOOmM CaCl2, lOmM Tris pH 7.5 and kept on ice for 20 min. Cells were re-spun as before and resuspended in 1ml ice-cold, filter-sterilised lOOmM CaCl2, lOmM Tris pH 7.5. For each transformation, lOOpI of competent cells were mixed with 40-60ng DNA, and after 20 min on ice were heat-shocked at 4 2 % for 2 min. 200|il of L-agar, warmed to 37^0, was added to each sample and incubated at 3 7 % for 15 min. The mixture was spread onto the surface of a 90 mm L-agar plate (with ampicillin at lOOpg. m|-i) with a glass loop. Plates were incubated overnight at 37^0.
2.2.5 Large scale plasmid preparations
Bacterial plasmids were isolated from large-scale, liquid cultures by the alkaline lysis method of Birnboim and Doly (1979) as modified by Ish-Horowitz and Burke (1981) and carried out exactly as described in Maniatis ef a / (1982). Supercoiled plasmid DNA was purified either on a CsCI-ethidium bromide