R E S E A R C H
Open Access
Optimization of machining parameters and
wire vibration in wire electrical discharge
machining process
Sameh Habib
Abstract
Background:Wire Electrical discharge machining (WEDM) has higher capability for cutting complex shapes with high precision for very hard materials without using high cost of cutting tools. During the WEDM process, the wire behaves like a metal string, straightened by two axial pulling forces and deformed laterally by a sum of forces from the discharge process. Major forces acting on the wire can be classified into three categories. The first is a tensile force, pulling the wire from both sides in axial direction and keeping it straight. The second is the dielectric flushing force that comes from circulation of the dielectric fluid in the machining area. The third category consists of forces of different kinds resulting from sparking and discharging. Large amplitude of wire vibration leads to large kerf widths, low shape accuracies, rough machined surfaces, low cutting speeds and high risk of wire breakage. Such tendencies for poor machining performance due to wire instability behavior appear with thinner wires.
Methods:The present work investigates a mathematical modeling solution for correlating the interactive and higher order influences of various parameters affecting wire vibration during the WEDM process through response surface methodology (RSM). The adequacy of the above proposed model has been tested using analysis of variance (ANOVA).
Results:Optimal combination of machining parameters such as wire tension, wire running speed, flow rate and servo voltage parameters has been obtained to minimize wire vibration.
Conclusions:The analysis of the experimental observations highlights that the wire tension, wire running speed, flow rate and servo voltage in WEDM greatly affect average wire vibration and kerf width.
Keywords:Wire electrical discharge machining (WEDM), Mathematical modeling, Wire vibration, Kerf width and response surface methodology (RSM)
Background
Wire electrical discharge machining is a thermo-electrical process in which material is eroded from the workpiece through a series of discrete sparks occurring between the workpiece and the wire electrode (tool). The tool is sepa-rated by a thin film of dielectric fluid which is continuously fed to the area being machined in order to flush away the eroded particles. The movement of the wire is numerically controlled to achieve the desired three-dimensional shape and accuracy of the workpiece. The most important per-formance factors effecting WEDM are discharge current, pulse duration, pulse frequency, wire speed, wire tension,
type of die electric fluid and dielectric flow rate. However, wire EDM owing a large number of variables and the sto-chastic nature of the process, even a highly trained operator will still find it difficult to attain an optimal processing and avoid wire breakage.
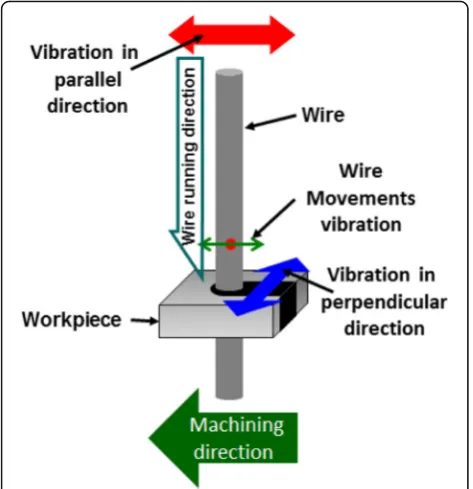
The wire running vertically between two guides and can vibrate in forward or backward directions as shown in Fig. 1. The vibrations of the wire can be divided into two compo-nents: vibrations parallel or perpendicular to the cutting direction. However, the latter is concerned, due to the constrains of the resulted two sides of the workpiece inside the machined kerf, vibration is relatively small and symmet-rical. Vibration and deflection of wire electrode during Wire EDM machining process was studied by few researchers (Herrero et al. 2008; Tomura & Kunieda 2009; Beltrami et
Correspondence:[email protected];[email protected] Mechanical Engineering Department, Faculty of Engineering at Shoubra, Benha University, Cairo, Egypt
al. 1996). They analyzed the force components that influ-ence the wire during machining. Several researchers focused on the measurement of static deflection of the wire (wire lag). However, mathematical modeling of vibration behavior of the wire needs to be studied because it plays an important role in deciding precision and accuracy of wire EDM products.
Geometrical inaccuracy due to wire lag phenomenon in wire-cut electrical discharge machining has been analyzed and optimized by (Puri & Bhattacharyya 2003). Also, the trend of variation of the geometrical inaccuracy caused due to wire lag with various machine control parameters has been studied. Shichun et al. (2009) analyzed kerf width of micro wire EDM. They developed mathematical model of wire lateral vibration in machining process. Kumar et al. (2013) studied describes the effect of six input parameters such as pulse-on time, pulse-off time, peak current, spark gap voltage, wire feed and wire tension on wire breakage frequency and the surface integrity of wear out wire during machining of pure titanium. Wentai et al. (2015) investi-gated wire tension change in high speed wire EDM. They developed simulation model for the process and redesigned wire winding mechanism to improve cutting stability as well as the consistency of workpiece dimension in multi-cutting process. In addition, the higher tension decreases the wire vibration amplitude and hence decreases the cut width so that the speed is higher for the same discharge en-ergy. However, if the applied tension exceeds the tensile strength of the wire, it leads to wire breakage. Kumar & Singh (2012) investigated the variation of cutting perform-ance with pulse on time, pulse off time, open voltage, feed
rate override, wire feed, servo voltage, wire tension and flushing pressure. They used Taguchi approach of L18 or-thogonal array under different conditions to obtain optimal combination of parameters. Nain et al (2015) reviews the effect of process parameters on the performance character-istics such as surface integrity charactercharacter-istics and rough-ness, material removal rate, kerf width and wire wear rate of wire EDM process.
Wire movements vibration during wire EDM process were directly observed by (Habib & Okada 2016a; Habib & Okada 2016b) using a high-speed video camera. High-speed observation model was built, and the wire move-ments during machining were observed and recorded. By analyzing the recorded images, the effects of machining conditions such as wire tension, wire running speed, flow rate of jet flushing and servo voltage on the wire vibration amplitude and machined kerf width were developed. In this work, mathematical models for correlating these machining conditions with wire vibration amplitude and machined kerf width were developed. Response surface methodology was used to optimize machining conditions utilizing the relevant experimental data as obtained through experimentation. The adequacy of the developed mathematical models has also been tested by the analysis of variance test.
Fig. 1Wire moving directions
Table 1Properties of dielectric fluid
Dielectric fluid property Value
Flushing point 125 °C
Melting point -51 °C
Boiling point 300 °C
Appearance colorless
Specific Gravity 0.8236
Odor odorless
Table 2Experimental working conditions
Working conditions Value
Machining length 5.0 mm
Workpiece material SKD11 (JIS)
Workpiece thickness 1.0 mm
Pulse duration te 1.0μs
Discharge current ie 20 A
Wire diameter 0.5 mm
Wire material Tungsten
Wire tension Wt 0.5–4.0 N
Wire running speed Ws 1.0–15.0 m/min
Servo voltage Sv 50–90 V
Flow rate Fr 0–8.0 L/min
Methods
In order to study the influence of machining conditions such as wire tension, wire running speed, flow rate of jet flushing and servo voltage on the wire vibration ampli-tude and machined kerf width, tests were carried out on 5-axis computer numerical control type wire electric
dis-charge machine called “Sodick AP200L”. The workpiece
material was SKD11 in JIS specifications of 1.0 mm thick-ness. SKD11 (alloy tool steel) is Carbon high-Chromium alloy steel possessing high hardness, strength and wear resistance. Its surface is grinded precisely. It is often used for the stamping dies, plastic molds. An acrylic small tank filled with dielectric oil fluid (Kerosene type) is used to facilitate the developed observation system. Table 1 lists the properties of dielectric fluid. The experimental working conditions were listed in Table 2.
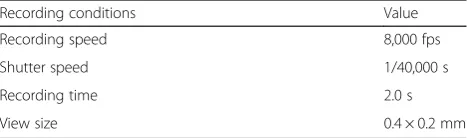
High-speed observation system of fine wire EDM was used in this work as shown in Fig. 2. The wire movements during the process were observed by a high-speed video camera. The digital high-speed video camera system (KEY-ENCE VW-6000) was used for the recording with the aid of a Halogen light source. The recording conditions are listed in Table 3. The wire vibration during the process was analyzed with the motion analysis program (DITECT DIPP Motion Pro). This software was used for the analysis of recorded images obtained using a high-speed video camera (DIPP Motion Pro User s Manual). In order to accurately analyze a vibration problem, it is necessary to describe the vibration in a consistent and reliable manner. Vibration analysts rely primarily on numerical descriptions, rather than on verbal descriptions, to analyze vibration accur-ately. Amplitude describes the severity of vibration, and
frequency describes the oscillation rate of vibration (how frequently an object vibrates) (Habib & Okada 2016a). Average wire amplitude, which is simply the arithmetic average of the signal level over a certain length of time. Kerf width was measured by using NIKON high optical microscope under magnification of 100 times. Kerf width measurements were made three times at three different positions along the kerf width and the average value was calculated.
Response surface modelling and experimental design
Response surface methodology (RSM) is a collection of mathematical and statistical techniques for empirical model building. By careful design of experiments, the objective is to optimize a response (output variable) which is influenced by several independent variables (input variables). An experiment is a series of tests, called runs, in which changes are made in the input variables in order to identify the reasons for changes in the output response (Mahfouz 1999). In this work re-sponse surface methodology was chosen meanwhile many other techniques are available because it explores the relationships between several explanatory variables and one or more response variables. The main idea of RSM is to use a sequence of designed experiments to obtain an optimal response.
Most of the criteria for optimal design of experiments are associated with the mathematical model of the process. Generally, these mathematical models are poly-nomials with an unknown structure, so the correspond-ing experiments are designed only for every particular problem. The choice of the design of experiments can have a large influence on the accuracy of the approxima-tion and the cost of constructing the response surface. A second-order model can be constructed efficiently with central composite designs (CCD) (Montgomery 1997). CCD are first-order (2K) designs augmented by additional centre and axial points to allow estimation of the tuning parameters of a second-order model. the design involves
Fig. 2High-speed observation system of WEDM
Table 3Digital video camera recording conditions
Recording conditions Value
Recording speed 8,000 fps
Shutter speed 1/40,000 s
Recording time 2.0 s
2K factorial points, 2 K axial points and 1 central point repeated 7 times (Habib 2009).
In this study average wire amplitude (Aa) and kerf width (Wk) are selected as the response (output variables). How-ever, the independent (input variables) are wire tension (Wt), wire running speed (Ws), flow rate (Fr) and servo voltage (Sv). The coded levels for input variables are listed in Table 4. The minimum possible number of experiments (N) can be determined from the following equations by using“Minitab 16”software:
N ¼ 2Kþ 2K þ 7 ð1Þ
When K equals 4 (input variables), thus the minimum number of experiments involves a total of 31 experimen-tal observations with different combinations of input variables. In order to study the effects of the input variables on the above responses, second order polyno-mial response surface mathematical models can be devel-oped. In the general case, the response surface is described by an equation of the form:
Yu¼β∘þ
XK
i¼1
βixiþ XK
i¼1
βiix2i þ XK
i〉i
βijxixj…; ð2Þ
Where, Yu is the corresponding response, e.g. the Aa
and Wk produced by the various input variables and the xi (1,2, …k) are coded levels of k quantitative process variables, the termsβ°,βi,βiiandβijare the second order regression coefficients. The second term under the summation sign of this polynomial equation is attributable to linear effect, whereas the third term corresponds to the higher-order effects; the fourth term of the equation includes the interactive effects of the process parameters. In this work, Eq. (2) can be rewritten according to the four variables used as:
Yu¼β∘þβ1x1þβ2x2þβ3x3þβ4x4þβ11x21þβ22x22þβ33x23
þβ44x24þβ12x1x2þβ13x1x3þβ14x1x4þβ23x2x3þβ24x2x4
þβ34x3x4……:;
ð3Þ
Where: X1, X2, X3 and X4 are wire tension, wire
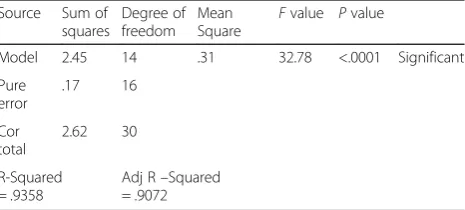
running speed, flow rate and servo voltage respectively. Table 6ANOVA analysis for Wire amplitude (Aa) Source Sum of
squares
Degree of freedom
Mean Square
Fvalue Pvalue
Model 2.45 14 .31 32.78 <.0001 Significant
Pure error .17 16 Cor total 2.62 30 R-Squared = .9358
Adj R–Squared = .9072
Table 5Plan for central composite rotatable second-order de-sign: different controlling parameters and results
Experiment No.
Wt Ws Fr Sv Response Aa (μm) Response Wk (μm)
1 -2 0 0 0 3.66540 71.5790
2 0 0 0 0 2.37396 68.0022
3 -1 1 1 -1 2.54925 68.3599
4 0 0 0 0 2.37396 68.0022
5 -1 -1 1 -1 2.93253 70.4804
6 -1 -1 -1 -1 2.70124 69.2480
7 2 0 0 0 2.17943 65.7750
8 0 0 0 0 2.37396 68.0022
9 -1 1 -1 -1 2.70124 69.2480
10 -1 1 -1 1 2.66031 69.1647
11 0 0 0 0 2.37396 68.0022
12 1 1 1 1 2.01800 66.6289
13 1 1 1 -1 1.84065 65.8024
14 0 2 0 0 2.51052 68.3176
15 0 0 -2 0 2.62025 68.8408
16 0 0 0 0 2.37396 68.0022
17 0 0 0 0 2.37396 68.0022
18 -1 -1 -1 1 2.66031 69.1647
19 0 0 0 -2 2.43437 68.1575
20 -1 1 1 1 2.83786 69.6149
21 0 0 0 2 2.60788 69.0435
22 -1 -1 1 1 2.95642 70.7109
23 1 -1 -1 -1 2.24741 67.2592
24 1 1 -1 -1 2.04350 66.4264
25 1 -1 -1 1 2.09522 66.7474
26 0 0 0 0 2.37396 68.0022
27 0 -2 0 0 2.55843 69.1749
28 0 0 2 0 2.64001 69.5402
29 1 1 -1 1 2.15603 66.9390
30 1 -1 1 -1 2.69919 69.1595
31 1 -1 1 1 2.61182 68.9616
Table 4Coding levels of input variables
Level Wt Ws Fr Sv
-2 0.5 1 0 50
-1 1.5 3 2 60
0 2 7 4 70
1 3 11 6 80
Result and Discussion Mathematical formulation
Based on Eq. (3), the effects of the above mentioned process variables on the magnitude of both average wire amplitude (Aa) and kerf width (Wk) has been evaluated by computing the values of the different constants of Eq. (3) and utilizing the relevant data from Table 5. The mathematical models for correlating Aa and Wk in addition with the considered process variables were obtained by Eqs. 4 and 5:
Aa¼5:98371–1:01661 Wt–0:01284 Ws–0:11263
Fr–0:05458 Sv þ0:21820 Wt2þ 0:00342
Ws2þ0:01601 Fr2þ0:00037 Sv2 – 0:03961
WtWsþ0:03675 WtFr–0:00371 WtSv –0:02046
WsFrþ0:00165 WsSvþ 0:00081 FrSv
ð4Þ Wk ¼80:7126– 2:0166 Wt–0:2562 Ws–0:4518
Fr – 0:2192 Sv þ 0:3631 Wt2 þ 0:0168
Ws2 þ 0:0743 Fr2þ 0:0015 Sv2 –0:1031
WtWs þ 0:1113 WtFr–0:0143 WtSv–0:0789
WsFr þ0:0064 WsSv þ 0:0039 FrSv
ð5Þ Checking the accuracy of the model
The adequacy of the above two proposed models have been tested through the analysis of variance (ANOVA). The usual method for testing the adequacy of a model is carried out by computing the F-ratio of the lack of fit to
the pure error and comparing it with the standard value. If the F-ratio calculated is less than the standard values, the postulated model is adequate (Nain et al. 2015; DIPP Motion Pro User s Manual). The calculated F-ratios were found to be higher than the tabulated values with a 95% confidence level and hence the models were consid-ered to be adequate. Another way of determining the accuracy of the fitted regression model is to find the co-efficient of determination (R2). In all the three cases that the values of determination coefficient (R2) and adjusted
determination coefficient (adj. R2) are more than 90%
which confirms good significance of the model. The results of the analysis justifying the closeness of fit of the mathematical models have been enumerated, as shown
in Tables 6 and 7. The p-values of the models are also
found to be less than 0.05, which verifies that the model is acceptable. It is concluded that the evolved models given by Eqs. (4) and (5) are quite adequate and demon-strate the independent, quadratic and interactive effects of the different machining parameters on the average wire amplitude and kerf width criteria values.
Parametric influence on average wire amplitude
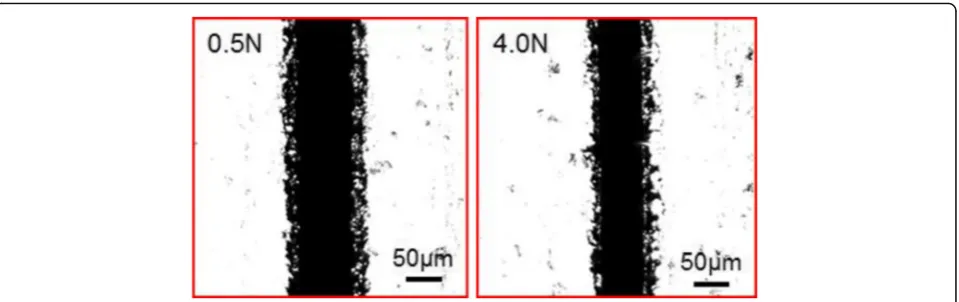
The influence of wire tension, wire running speed, flow rate and servo voltage on average wire amplitude can be shown in Fig. 3. Average wire amplitude decreases with the increase of wire tension and wire running speed. However, it increases with dielectric flow rate. Servo voltage has a weak influence on average wire amplitude. One of the most effecting parameters of wire vibration amplitude in wire EDM process is wire tension. Figure 4 shows wire shape difference under wire tension 0.5 and 4.0 N. Within considerable range, an increase in wire tension significantly increases the cutting speed and ac-curacy due to the sharp straightness of the wire.
Fig. 3Relationship between average wire amplitude and wire tension, wire running speed, flow rate and servo voltage
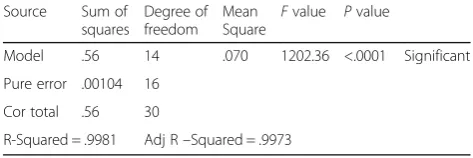
Table 7ANOVA analysis for Kerf width (Wk)
Source Sum of squares
Degree of freedom
Mean Square F
value Pvalue
Model .56 14 .070 1202.36 <.0001 Significant
Pure error .00104 16
Cor total .56 30
When the wire running speed has a lower value, the amplitude slightly increases. The debris exclusion from the discharge gap is a little difficult at lower wire run-ning speed because there is no high-speed flow of work-ing fluid around the wire. Then, the debris stagnation occurs around the wire, which causes unstable machin-ing and larger amplitude of wire vibration. When the wire running speed is higher, the debris is smoothly excluded.
Dielectric flow rate is the rate at which the dielectric fluid is circulated. Flow rate of the working fluid from jet nozzles is important for efficient machining. One of the forces exerted on the wire is the dielectric flow such that as the flow rate increases around the wire, the movement of the wire speeds up and thus the average wire amplitude increases.
Servo voltage acts as the reference voltage to control the wire advances and retracts. Figure 3 shows that there is little decrease of average wire amplitude with change of servo voltage from 50 to 70 V. After that, the average wire amplitude increases slightly.
The effect of both wire tension and servo voltage on average wire amplitude is shown in the contour graph of Fig. 5. It can be concluded that the average wire amplitude
has maximum value higher than 4.0 μm of dark green
color when wire tension values ranges between 1.0 N and 0.5 N with servo voltage values ranges between 65 V and 75 V. However, the average wire amplitude has minimum value less than 2.0 μm of light green when wire tension higher than 3.5 N and servo voltage between 65 V and 75 V. Thus, it can be concluded that to minimize average wire amplitude, it is better to make the value of wire tension ranges between 3.5 N and 4.0 N in addition with servo voltage ranges between 65 V and 75 V.
Figure 6 shows the effect of wire running speed and dielectric flow rate on average wire amplitude. It is found that the average wire amplitude has maximum values ranges between 2.5μm and 3.0μm of green color at the lower part of the figure when wire running speed values ranges between 3.0 m/min and 10.0 m/min. How-ever, the average wire amplitude has minimum values ranges between 2.0μm and 2.5μm of light green at the
Fig. 5Effect of wire tension and servo voltage in average wire amplitude
Fig. 6Effect of wire running speed and flow rate in average wire amplitude
higher part of the figure when wire running speed values ranges between 4.0 m/min and 15.0 m/min for the same range of dielectric flow rate (0 to 8.0 L/min). Thus, it can be concluded that to minimize average wire ampli-tude, it is better to make the value of wire running speed ranges between 4.0 m/min and 15.0 m/min for the same range of dielectric flow rate (0 to 8.0 L/min).
Parametric influence on kerf width
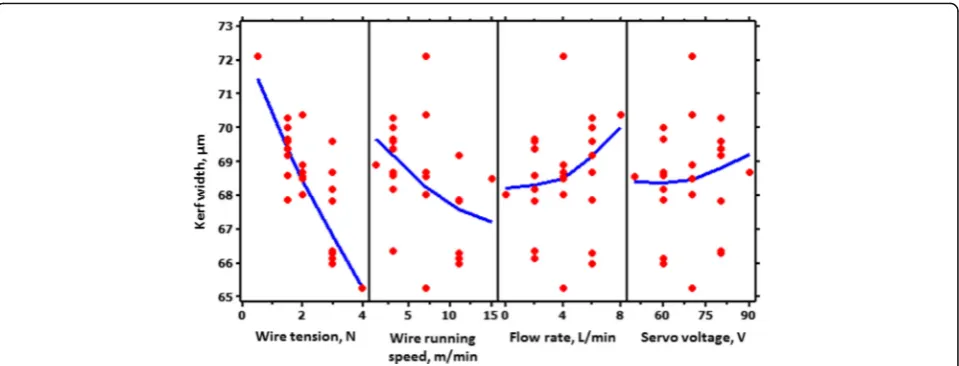
Figure 7 shows the relationship between kerf width and the effecting parameters such as wire tension, wire run-ning speed, flow rate and servo voltage. Kerf width decreases directly with the increase of wire tension and wire running speed. However, it increases with the increase of flow rate and servo voltage. When the wire tension increases, the straightness of the wire increases and thus decreases the average wire amplitude and so decreases the resulted kerf width. It can be noticed that the kerf width decreases with the wire tension, which agrees with the variation of wire vibration amplitude with the wire tension
shown above. Therefore, the increase of wire amplitude results in the increase of kerf width. In other words, the wire amplitude and the machined kerf width can be decreased by increasing wire tension also in fine wire EDM. Figure 8 shows the effect of wire tension and servo volt-age on kerf width. It can be shown that the maximum kerf width of value higher than 72μm is located at the region of color dark green when the wire tension has value ranges between 0.7 N and 0.5 N with servo voltage values ranges between 69 V and 71 V. However, the minimum kerf width of value less than 66μm is located at the region of color dark blue when the wire tension has values ranges between 3.5 N and 4.0 N with servo voltage values ranges between 65 V and 75 V. Thus, it can be concluded that when wire tension values ranges between 3.5 N and 4.0 N in addition with servo voltage ranges between 65 V and 75 V, minimum kerf width values resulted.
The contour graph relating between kerf width with both of wire running speed and dielectric flow rate can be shown in Fig. 9. The maximum kerf width of values
Fig. 7Relationship between kerf width and wire tension, wire running speed, flow rate and servo voltage
ranges between 70 μm and 71 μm that located at the region of color moderate green when the wire running speed has value ranges between 5.0 m/min and 8.0 m/ min with dielectric flow rate values ranges between 7.0 L/min and 8.0 L/min. whereas, the minimum kerf
width of value less than 66 μm is located at the region
of color dark blue when the wire running speed has values ranges between 10.5 m/min and 11.5 m/min with dielectric flow rate values ranges between 1.5 L/min and 2.5 L/min. Thus it can be concluded that to minimize kerf width, it is better to make the value of wire running speed ranges between 10.5 m/min and 11.5 m/min in addition with dielectric flow rate ranges between 1.5 L/ min and 2.5 L/min.
Optimality search
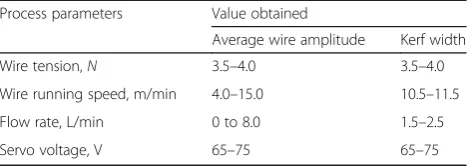
For the purpose of achieving stable wire electrical discharge machining, optimal combination of the vari-ous effecting process-variables such as the wire tension, wire running speed, flow rate and servo voltage, can be analyzed based on the developed mathematical models. The optimal search was formulated for the various process variable conditions based on minimizing aver-age wire amplitude and kerf width values. The optimal combination of various process variables thus obtained within the bounds of the developed mathematical models and contour graphs. The optimal values resulted have been listed, as shown in Table 8.
Conclusions
The analysis of the experimental observations highlights that the wire tension, wire running speed, flow rate and servo voltage in WEDM greatly affect average wire vibration and kerf width. Main conclusions obtained are as follows;
1. Average wire amplitude decreases with the increase of wire tension and wire running speed. However, average wire amplitude increases with dielectric flow rate. Servo voltage has a weak influence on average wire amplitude.
2. Kerf width decreases directly with the increase of wire tension and wire running speed. However, kerf
width increases with the increase of flow rate and servo voltage.
3. To minimize average wire amplitude, the value of wire tension is recommended to range between 3.5–4.0 N in addition with a servo voltage ranging between 65–75 V.
4. When the value of wire running speed ranges between 4.0 and 15.0 m/min for the range of dielectric flow rate from 0–8.0 L/min, minimum average wire amplitude has been achieved. 5. Minimum kerf width values resulted under wire
tensions ranging between 3.5–4.0 N while the servo voltages ranged between 65–75 V. 6. For minimal kerf widths, the WEDM process is
preferred to operate under wire running speeds between 10.5–11.5 m/min in addition to dielectric flow rates ranging between 1.5–2.5 L/min.
Abbreviations
CCD:Central composite designs; Fr: Flow rate; Sv: Servo voltage; Ws: Wire running speed; Wt: Wire tension
Funding
This research got no financial help from any funding organization for the authorship or publication of this article.
Authors’contributions
There only one author for this manuscript, Prof. SSH.
Competing interests
The author declares that he/she has no competing interests.
Received: 11 November 2016 Accepted: 12 January 2017
References
Beltrami I, Bertholds A, Dauw D (1996) A simplified post process for wire cut EDM. J Mater Process Technol 58(4):385–389
DIPP-Motion Pro User’s Manual. www.ditect-corp.com/products/dipp_motionv.html Habib S (2009) Study of the parameters in electrical discharge machining
through response surface methodology approach. Appl Math Model 33: 4397–4407
Habib S, Okada A (2016a) Study on the movement of wire electrode during fine wire electrical discharge machining process. J Mater Process Technol Elsevier 227:147–152
Habib S, Okada A (2016b) Experimental investigation on wire vibration during fine wire electrical discharge machining process. Int J Adv Manuf Technol Springer 84(9):2265–2276
Herrero A, Azcarate S, Rees A, Gehringer A, Schoth A, Sanchez JA (2008) Influence of force components on thin wire EDM, 4th International Conference on Multi-Material Micro Manufacture, 4 M2008, Cardiff, UK.
Kumar A, Singh DK (2012) Performance Analysis of Wire Electric Discharge Machining (W-EDM). Int J Eng Res Technol (IJERT) 1(4):1–9
Kumar AH, Kumar V, Kumar J (2013) Parametric Effect on Wire Breakage Frequency and Surface Topography in WEDM of Pure Titanium. J Mech Eng Technol 1(2):51–56
Mahfouz SY (1999) Design Optimization of Structural Steelwork. University of Bradford, Ph. D. thesis, UK, pp 15–29
Montgomery DC (1997) Design and analysis of experiments. John Wiley & Sons, New York
Nain SS, Garg D, Kumar S (2015) A Study on Performance Characteristics in WEDM. Int J Sci Prog Res (IJSPR) 8:34–42
Puri AB, Bhattacharyya B (2003) An analysis and optimization of the geometrical inaccuracy due to wire lag phenomenon in WEDM. Int J Mach Tools Manuf 43(2):151–159
Table 8Optimal values of WEDM parameters
Process parameters Value obtained
Average wire amplitude Kerf width
Wire tension,N 3.5–4.0 3.5–4.0
Wire running speed, m/min 4.0–15.0 10.5–11.5
Flow rate, L/min 0 to 8.0 1.5–2.5
Shichun D, Xuyang C, Dongbo W, Zhenlong W, Guanxin C, Yuan L (2009) Analysis of kerf width in micro-WEDM. Int J Mach Tools Manuf 49(10):788–792
Tomura S, Kunieda M (2009) Analysis of electromagnetic force in wire-EDM. Precis Eng 33(3):255–262
Wentai S, Zhidong L, Mingbong Q, Zongjun T (2015) Wire tension in high-speed wire electrical discharge machining. Int J Adv Manuf Technol
Submit your manuscript to a
journal and benefi t from:
7 Convenient online submission
7Rigorous peer review
7 Immediate publication on acceptance
7Open access: articles freely available online
7 High visibility within the fi eld
7Retaining the copyright to your article