Available online on 15.08.2019 at http://jddtonline.info
Journal of Drug Delivery and Therapeutics
Open Access to Pharmaceutical and Medical Research© 2011-18, publisher and licensee JDDT, This is an Open Access article which permits unrestricted non-commercial use, provided the original work is properly cited
Open Access
Research Article
RP-HPLC Method Development and Validation for Determination of
Didanosine in Pharmaceutical Dosage Forms
Sachin Gholve
1*, Sharddha Gangapure
1, Mahesh Birajdar
2, Imran Mujewar
1, Omprakash G Bhusnure
11Department of Quality Assurance, Channabasweshwar Pharmacy College (Degree), Kava Road, Basweshwar Chowk, Latur, Maharashtra, India-413512
2Department of Pharmaceutical Chemistry, Channabasweshwar Pharmacy College (Degree) Kava Road, Basweshwar Chowk, Latur, Maharashtra, India-413512
ABSTRACT
To develop a simple, cheap, accurate, and rapid Reverse Phase High Performance Liquid Chromatographic (RP-HPLC) method and validate as per ICH guidelines for estimation of Didanosine in pharmaceutical dosage forms. The separation was conducted by using mobile phase consisting of methanol: water in the ratio (30:70). The wavelength was found at 246nm. Agilent 1220 Infinity LC with ezchrome software is used for chromatographic determination. The separation was conducted by using Zebra Eclipse XDB-C-18 (4.6×250×5µm) at the flow rate of 1.0 ml/min using variable wavelength detector. The developed method resulted in didanosine eluting at 4.650 min. The method was found to be linear over the concentration range 2-12µg/ml with coefficient regression R2-0.997. Mean recovery was found to be in the range of 99.99%, during accuracy studies. The limit of detection (LOD) and limit of quantitiation (LOQ) was found to be 5 mg/ml and 16 mg/ml respectively. A cheap, accurate, precise, linear and rapid RP-HPLC method was developed and validated for the quantitative estimation of Didanosine as per ICH guidelines.
Keywords:-RP-HPLC, Didanosine, Method Validation
Article Info:Received 18 June 2019; Review Completed 24 July 2019; Accepted 28 July 2019; Available online 15 August 2019
Cite this article as:
Gholve S, Gangapure S, Birajdar M, Mujewar I, Bhusnure OG, RP-HPLC Method Development and Validation for Determination of Didanosine in Pharmaceutical Dosage Forms, Journal of Drug Delivery and Therapeutics. 2019; 9(4-s):343-347 http://dx.doi.org/10.22270/jddt.v9i4-s.3328
*Address for Correspondence:
Sachin Gholve, Department of Quality Assurance, Channabasweshwar Pharmacy College (Degree), Kava Road, Basweshwar Chowk, Latur, Maharashtra, India-413512
INTRODUCTION:
Didanosine chemically 2', 3’- dideoxyinosine (fig1) is an antiretroviral medication used to treat HIV/AIDS in combination with other medications as part of highly active antiretroviral therapy. An extensive review of the literature revealed a few analytical methods (1-12), was reported for the estimation of didanosine in dosage forms. Didanosine is a dideoxy analogue of the purine nucleoside inosine that potentially inhibits the replication of the human immunodeficiency virus. Analogue to other nucleoside inhibits, this compound also requires intracellular metabolism to the active triphosphate, 2', 3’-
dideoxyinosine-5-triphosphate (ddATP), which act as a competitive inhibitors of HIV reverse transcriptase or as a DNA chain transmitter. (13-14) Validation is the process of providing documented evidence what it is intended to do. In other word the process of method validation ensures that the proposed analytical methodology is accurate, specific, reproducible and rugged for its intended use. Analytical
techniques have different degrees of sophistication, sensitivity and selectivity, as well as, different cost and time requirements.
MATERIALS AND METHODS
Chemicals and ReagentsWater, Methanol, Acetonitrile of Analytical and HPLC grade purchased from Arti pharmaceuticals (Mumbai). Ammonium acetate buffer of AR grade purchased from Raj Chemicals (Latur).
Instrument
made of Shimatzu Corporation, Hot air oven made of Nisco Company, Sonicator made of the Ultrasonic’s PCi Analytics sonicator.
METHODS:- Selection of Wavelength suitable wavelength
for the HPLC analysis was determined by recording UV spectrum in the range of 200-400 nm for didanosine. Suitable wavelength selected was 246 nm (Figure 2).
Figure 1 Chemical structure of Didanosine
Figure 2 UV spectrum of Didanosine
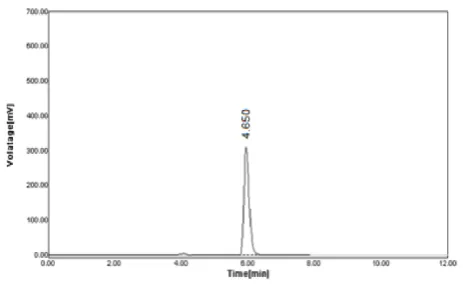
Figure 3 Typical Chromatogram of Blank solution
Figure 4 Typical chromatogram of the standard solution
Figure5 Typical chromatogram for the tablet formulation
Figure 6 Calibration Curve
CHROMATOGRAPHIC CONDITIONS:
The developed method uses a reverse phase C18 column, Phenomena Gemini (C18 4.6×250×5µm), mobile phase consisting of a mixture of methanol: water in the ratio (30:70). The mobile phase was set at a flow rate of 1 ml/min and the volume injected was 20 µl for every injection. The detection wavelength was set at 246 nm.
Preparation Mobile Phase
A mixture of 30 volumes of Methanol, and 70 volumes of water was prepared (30:70). The mobile phase was sonicate for 10 min to remove gases.
Preparation of standard stock solution
Weigh accurately 10 mg of Didanosine drug in 100 ml volumetric flask and dissolve in 100 ml water.
Preparation of sample solution
20 Tablets (each tablet contains 10 mg of Didanosine) were weighed and taken into a mortar uniformly mixed. Test stock solutions of Didanosine (10µg/ml) and was prepared by dissolving weight equivalent to 10 mg of Didanosine and dissolved in sufficient mobile phase. After that filtered the solution using 0.45-micron syringe filter .after the filtration zsolicited for 5 min and dilute to 100 ml with mobile phase. Further dilutions are prepared in 5 replicates of 10µg/ml of Didanosine was made by adding 1 ml of stock solution to 10 ml of mobile phase.
Calibration Curve
Appropriate aliquots of standard stock solution (1000µg/ml) was diluted to 100 mg/ml in 10ml volumetric flask and resultant solution was diluted up to the mark with mobile phase to obtain a final concentration of 2,4,6,8,10, and 12µg/ml. These solutions were injected into
y = 636.26x + 385.06
R² = 0.9977
0
2000
4000
6000
8000
10000
0
5
10
15
Series1
chromatographic system. The chromatograms were obtained and peak area ratio was determined for each concentration of drug solution. Calibration curve of Didanosine were constructed by plotting peak area ratio vs applied concentration of Didanosine and regression equation was computed. The sample solution was chromatographic and concentration of didanosine in tablet samples was calculated using regression equation.
RESULTS AND DISCUSSION
METHOD DEVELOPMENTA Reverse phase HPLC method was developed considering the system suitability parameters i.e. tailing factor (T), the number of theoretical plates (N), run time and the cost effectiveness. The optimized method developed resulted in the elution of Didanosine at 4.560 min. Figures 3&4 represent chromatograms of blank and standard solution (10µg/ml) respectively. The total run time is 10 minutes. System suitability tests are an integral part of method development and validation. System suitability tests are
used to ensure adequate performance of the
chromatographic system. System suitability parameters were evaluated for six replicate injections of the standard at working concentration. The results are given in Table 1.
Table 1 System suitability studies results
Parameters Didanosine
Retention time (min) 4.650
Number Of Theoretical
plates(N) 6245
Tailing factor (T) 1.6
Table 2 Calibration data for Didanosine
Sr. No Concentration (µg/ml) Area (µAU)
1 2 169062
2 4 298014
3 6 419805
4 8 537160
5 10 660275
6 12 818992
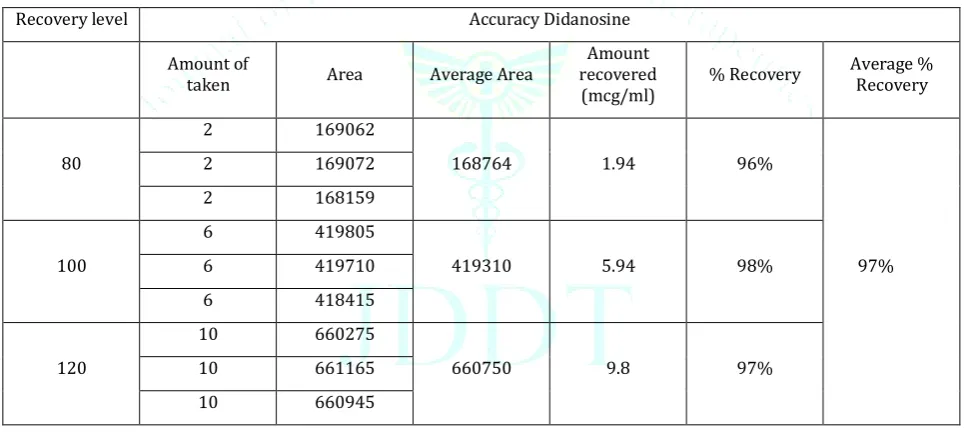
Table 3 Results of Accuracy studies for Didanosine
Recovery level Accuracy Didanosine
Amount of
taken Area Average Area
Amount recovered
(mcg/ml) % Recovery
Average % Recovery
80
2 169062
168764 1.94 96%
97%
2 169072
2 168159
100
6 419805
419310 5.94 98%
6 419710
6 418415
120
10 660275
660750 9.8 97%
10 661165
10 660945
Table 4 System precision results Didanosine
Injection No. Rt Area
1 4.631 670254
2 4.650 675148
3 4.550 670254
4 4.642 674545
5 4.551 676458
6 4.650 673654
AVG 4.612333 673385.5
SD 0.0484011 2591.362
%RSD 1.04938 0.4848
Table 5 Intraday precision results
Injection No. Rt Area
1 5 664257
2 5.01 664747
3 4.99 664346
4 4.99 664421
5 5.1 664237
6 5 664647
AVG 5.015 664452
SD 0.0423 210.216
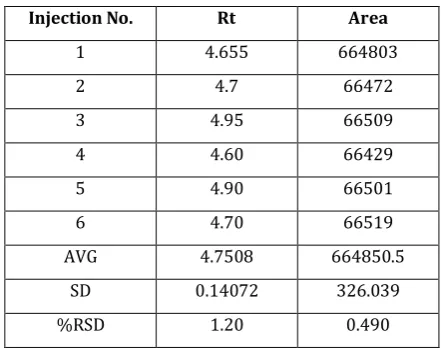
Table 6 Inter day precision results
Injection No. Rt Area
1 4.655 664803
2 4.7 66472
3 4.95 66509
4 4.60 66429
5 4.90 66501
6 4.70 66519
AVG 4.7508 664850.5
SD 0.14072 326.039
%RSD 1.20 0.490
Table 7 Robustness results of Didanosine Parameters
Flow
0.8mn/min 4.7283 672957
1.2ml/min 4.885 67296
Wavelength
244 4.7866 67338.5
248 4.6866 674228.3
METHOD VALIDATION (15-16)
Authentification of the investigative method is the process that starts by laboratory studies in which the requirements of the performance properties of method are met for the intended analytical application. To the validation of analytical procedures RP-HPLC method developed was validated according to International Conference on Harmonization (ICH) and USP guidelines. Various parameters or criteria are used for the method of validification, such as linearity, accuracy, precision, system suitability, ruggedness, limit of Quantification (LOQ) and limit of Detection (LOD).
System suitability parameters
The system suitability parameters were determined by preparing standard solutions of Didanosine. The solutions were injected six times and the parameters are calculated which are % RSD, peak tailing, resolution and USP plate count. The results are mentioned in Table 1. The standard chromatogram is shown in Fig. 4.
Specificity
Figures 3-5 are for the blank determination, the standard drug solution and sample chromatograph mixture discloses that the peaks acquired in the standard solution and sample solution at working concentrations are acquired only because of the drugs, this is the reason that blank determinations show no peak at the retention time of didanosine. Accordingly it can be concluded that, the method developed is said to be accurate and specific.
Linearity
Linearity the method was tested from 80-120 % of the targeted level of the assay concentration for analyte. Standard solutions contained 2-12 µg/mL of didanosine.
Linearity solutions were injected in triplicate. The equations of the calibration curves for Montelukast sodium obtained were y = 02E+06X in the didanosine determination, the calibration graphs were found to be linear in the aforementioned concentrations with correlation coefficients 0.9978. The results are mentioned in the Table 2 & calibration curve Fig 6.
Accuracy
The precision was determined with the help of recovery experiments, by the verification with percentage mean recovery of sample at three different levels (80-120%). 20 blank tablets were powdered and mixed. This powder was then spiked with a quantity of didanosine corresponding to 80%, 100% and 120% of the labeled claim. Each of these powder mixtures was analyzed in triplicate and the quantity of Didanosine was determined using calibration equation. Accuracy was reported as 98 % of didanosine recovered. The results are mentioned in Table 3.
Precision System precision
The value for %RSD (Relative Standard Deviation) was obtained less than 2 by six replicate injections of the standard solution at working concentrations, concerning the peak area for the drug. It designates the adequate reproducibility and hence the accuracy of the system. System precision results are tabulated in Table 4.
Method precision
The accuracy of procedure was determined by conducting assay of sample with the tests of (I) Repeatability (Intraday precision) and (II) Intermediate precision or ruggedness (Interday precision) completed within 3 successive daysbythree different analysts, at working concentration. Repeatability (Intraday precision)
The value for %RSD (Relative Standard Deviation) less than 2 for six successive injections of the sample solution from the same homogenous mixture at working concentrations, concerning % assay for the drug which indicate that the method developed is method precise by the test of repeatability and hence can be understood that the method gives consistently reproducible results (Table 5).
Intermediate Precision (Ruggedness / Inter day precision)
The value for %RSD (Relative Standard Deviation) less than 2 for six successive injections of the sample solution from the same homogenous mixture at working concentrations on three successive days by three unidentical analysts for % assay for the drug within and between days, which indicate the method developed is inter day precise / rugged (Table 6).
Robustness
Limit of Detection (LOD)
The limit of detection (LOD) of methodological (analytical) process is defined as the concentration that produce instrument signal that is notably distinct from the blank determination. The IUPAC approach utilize the standard deviation of the intercept (Sa) for the spectroscopic techniques or other methods that depend upon a calibration curve for quantitative measurements, which may be related to LOD and the slope of the calibration curve, b. The limit of detection was found to be 5ng/ml
Limit of Quantification (LOQ)
The LOQ is the concentration that can be quantitate reliably with a specified level of accuracy and precision. The LOQ represent the concentration of analyte that would yield a signal-to-noise ratio of 10.The limit of quantification was found to be 15 mg/ml.
CONCLUSION
Method development and validation of model drug Didanosine was carried out under the circumstances of using mobile Water which give sharp peak and UV spectra also. A very few analytical method found in literature survey for the determination of Didanosine including FTIR, spectrophotometer. The develop UV and HPLC method was found to be simple, rapid, selective accurate, precise for the concurrent estimation of drug in dosage form. The method was evaluated in best condition, linear relation including coefficient of correlation, linearity, robustness, and accuracy, precision. The percent RSD for all parameter was found to be less than two which indicate the validity of method and assay result obtained by this method are in fair agreement. The force degradation studies performing in acidic, basic, neutral, Photo stability also performed.
All result obtained with proposed method confirm the suitability of these method for the analysis of pharmaceutical dosage form. The proposed method has been successfully applied for routine in process quality control.
ACKNOWLEDGMENT:
The authors take this opportunity thanks to Aarati Pharmaceuticals, Mumbai for providing gift sample. The authors would like to acknowledge Principal Dr. Vijayendra Swamy S. M., Principal, Channabasweshwar Pharmacy College, Latur for providing facilities for conducting research.
REFERENCES:
1. Shanta Kumar, K. Prakash, K.E.V. Nagoji And M.E.B. Rao, Determination of Didanosine in pharmaceutical dosage forms by RP-HPLC, Asian Journal of Chemistry, 2007; 19(4): 2633-2636.
2. J. N. Sangshetti, P. A. Kulkarni, and D. B. Shinde, Spectrophotometric determination Didanosine in bulk and tablet formulation, trend in applied science research, 2007; 2(1): 71-75.
3. N. Jaiprakash, Sangshetti, A. Parag Kulkarni and B. Devanand Shinde. Spectrophotometric Determination of Didanosine in Bulk and Tablet Formulation. Trends in Applied Sciences Research, 2007; 2: 71-75.
4. K. L. Senthil Kumar, S. Ashokkumar, R. P. Ezhilmuthu, Formulation and Evaluation of Didanosine Enteric Coated Sustained Release Tablet J Biomed Sci and Res., 2010; 2(3): 126-131.
5. R. N. Kane, P. S. Bhokare, C. C. Nalawade, M. S. Sayyed and R. D. Paliwal, Spectrophotometric Estimation of Didanosine in Bulk Drug and its Formulation, International Journal Of Pharmaceutical And Chemical Sciences, 2012; 1(4): 2277-5005.
6. A. Manikanta kumar, B. N. Sandhya, M. Nasare, VVLN Prasad and P. V. Diwan, Development and Validation of UV Spectrophotometric Method for Simultaneous Estimation of Lamivudine, Didanosine and Efavirenz in the Pharmaceutical Dosage form, American Journal of PharmTech Research, 2012; 2(6): 2249-3387.
7. F. Alatas, S. N. Soewandhi, L. Sasongko and Ismunandar, Simultaneous determination of Didanosine And Nicotinamide in binary mixture by first derivative UV spectrophotometry, International Journal of Pharmaceutical Sciences Review and Research, 2012; 17(1): 7-10.
8. Patricia Severinoa b, H. Silvac, E. B. Souto, Maria Helena A. Santanaa and Teresa Cristina T. Dalla Costab, Analysis of in vivo absorption of didanosine tablets in male adult dogs by HPLC, Journal of Pharmaceutical Analysis, 2012; 2(1): 29-34. 9. R. Revathi , S.P. Naga, R.M. Koteswara , T. Ethiraj and S.
Rajarajan, Development and validation of RP-HPLC method for content analysis of Didanosine in dosage form, Asian Journal of Pharmaceutical Analysis, 2012; 2(4): 118-121. 10. S. B. Naga, A. Manikanta, M. K. Nasare, Vijay Kumar P., S. Jetta
And P. V. Diwan, RPHPLC method for simultaneous estimation of Lamivudine, Didanosine And Efavirenz in pharmaceutical dosage forms, Der Pharmacia Lettre, 2013; 2(3): 148-155. 11. Gauri Santosh Kulkarni, Chandrashekhar Ashok Kale, Vitthal
V.Chopade, and Pravin. D. Chaudhari, development and validation of a stability indicating uv-vis spectrophotometric assay method of didanosine by using different stress degradation conditions, world journal of pharmacy and pharmaceutical sciences, 2014; 3(8): 600-611.
12. G. Ramesh, M. Subba Rao, development and validation of new Uv-spectrophotometric assay mehod ofr didanosine in pure and in formulations, Bulletin of Pharmaceutical and Medical Sciences, 2015; 3(1): 3034-3039
13. E.J De Clercq , Clin. Virol.30(2004) 115-133
14. E.De Clercq ,int. J.Biochem.cell Biol.36 (2004)1800-1822. 15. International Conference on Harmonization of Technical
Requirements for Registration of Pharmaceuticals for Human use. Validation of Analytical Procedures: Text and Methodology ICH Q2 (R1). 2005.