Improved Heart Disease Diagnostic IoT Model
Using Machine Learning Techniques
Deva Priya Isravel, Vidya Priya Darcini S, Salaja Silas
Abstract: Recent years, there has been a huge focus on providing quality healthcare due to the exponential rise in the life threatening health condition of the patients. There are multiple factors that affect the health conditions of every individual and some diseases are detrimental and cause loss of life. Heart disease is one such critical disease that affects people of different age groups. In this paper, a pre-processing technique is proposed to improve the accuracy of the classification of ECG signals. The raw data gathered contains noise which lowers the accuracy of the classification. The removal of distorted ECG signals is performed by applying a novel pre-processing technique. The performance of the classification is tested using the classifier algorithms such as KNN, Naïve Bayes and Decision tree to detect normal and abnormal heartbeat rhythms. From the experimental results, it can be proved that pre-processing improves the performance of classification algorithms. The analysis proved that the decision tree outperforms KNN and Naïve Bayes in terms of accuracy, sensitivity and precision. The pre-processing proves to be effective in improving the accurate diagnosis of heart-related diseases.
Index Terms: Classification, ECG Signals, Internet of Things, Machine Learning Techniques, Pre-processing.
—————————— ◆ ——————————
1
INTRODUCTION
Internet of Things (IoT) has become an essential part of human beings and it is used in all domains such as education, business, finance, social networking and healthcare etc. The health care industry has been adopting new technologies for providing better and smart healthcare facilities [1]. With the IoT, remote and real-time monitoring of patients is made possible and this unleashes the potential to continuously monitor the health and helps the physicians to give suggestions or treatment in a timely manner. As a larger community of people are suffering from heart disease, it is vital to carry out diagnosis at the early stage to save lives and help to support a healthy lifestyle of people. The health care monitoring has improved tremendously due to the development of different IoT capabilities and instruments to track patient’s health conditions regularly [2]. The patients can also interact with the doctor more easily which gives the satisfaction of treatment and it also reduces the hospital stay and healthcare expenses. The main focus of employing IoT in healthcare system is to set up a fully automated environment for patient monitoring and providing assistance and care to patients in real-time. There is a rise in the need for a portable system that can be used at home by the patient for measuring their ECG profiles and diagnose their disorder in real-time. So in this paper, an extensive review is carried out to find the existing technologies that are available for monitoring heart related diseases. It is understood from the analysis, that the collected raw data contains noise and irrelevant contents. These are irrelevant and incorrect data that are not useful for diagnosis. This noise and huge variation in data leads to reduction in the classification accuracy, sensitivity and precision. Therefore, in this paper a novel pre-processing approach is used to remove noise and unrelated data from ECG signals.
Relevant attributes are identified using correlation technique to enhance data efficiency. The machine learning classifier algorithm such as KNN, naïve Bayes and Decision tree are used for classifying the ECG signals based on waveforms. The classifier that obtains better performance metrics can be used for diagnosing the variation in the ECG waveform and identify the type of abnormality and disorders. The rest of the paper proceeds as follows. Section 2 presents the related works in view of understanding the technologies employed under different circumstances for processing ECG signals. Section 3 explains the proposed ECG sensing network with the integration of pre-processing technique. The experimental results are presented in section 4. The conclusion is presented in section 5.
2
EXISTING
METHODOLOGIES
Improving and upgrading the traditional healthcare system is very much unavoidable, as a larger percentage of middle aged and elderly patients are affected by chronic and heart related diseases. Most of the time people go to the hospital only when after they suffer from cardiac disease. In the traditional ECG setup, the medical instruments are housed in the hospital, patients need to visit the hospital to check their heart disorders and study their physiology of heart. During this process, the patient’s activities are limited. Frequent visit to hospital increases the medical expenses and puts a burden on hospital authorities. Early intervention is essential for the survival of patients, there has been a lot of focus and attention on building an automated system for the detection of abnormalities of heart signals. In [3] an IoT based wearable architecture was proposed to measure the ECG signals. This system provides a portable platform where a non-intrusive wearable sensor is used to collect the patient's ECG signals and send them to IoT cloud via the smart phone enabled Bluetooth or ZigBee technologies. The data stored in the cloud can be retrieved by the specialist for further processing using data analytics to find the disease. The data analytics procedure of data cleaning, storage, analysis and generation of warning alerts to the concerned specialist in a real-time manner can be performed by having access to the remote server. To facilitate the early diagnosis of heart disease, machine learning techniques are employed. From the health dataset, the investigation were performed to study the abnormal functions of the heart. To classify the signals, the amplitude and interval periods of the cardiac waves were analyzed using ————————————————
• Deva Priya Isravel, Assistant Professor, Karunya Institute of Technology and Sciences, Coimbatore, India.
• Vidya Priya Darcini S, M.Tech Student, Karunya Institute of Technology and Sciences, Coimbatore, India.
machine learning classification algorithms such as SVM, Adaboost, ANN and Naïve Bayes [4]. Identifying accurate classifiers will assist the physician in making quality decisions on diagnosis and timely treatment. There are different types of arrhythmia diseases that are related to cardiac rhythm disorders. To ensure proper diagnosis, statistical and dynamic features extraction of ECG signals is necessary [5]. So in this paper, heart rate variability is computed to generate alerts when the patient is affected by arrhythmia disease. In [6], to reduce the time consuming process of manually checking the ECG data, a new classifier was proposed to distinguish normal and abnormal heartbeat rhythm. This classifier removes noise and extracts ECG features. This classifier provided better performance when compared with other machine learning classification algorithms. The time computation is comparatively reduced and helps in identifying arrhythmia disease. Early detection of abnormal pulse rates is also crucial for the survival of the patient. So, to improve survival, a mechanism for the automatic detection of cardiac arrest was proposed. The ECG based pulse detection system uses the random forest classifier (RF) [7]. The ECG data were processed to remove noise and extract the features. The features were fed to random forest classifier and compared with other existing classifiers. The RF classifier resulted in improved performance helps the practitioners in making quick decisions for providing appropriate treatment. The pre-processing are widely used in various fields for data cleaning, data transformation, data integration and data reduction [8]. The identification of missing values, noisy data and detecting outliers are performed on the data to perform data cleaning. This data cleaning process provide significant improvement in the performance of the classifier. Different pre-processing techniques are available that can be applied to the dataset for improving the performance metrics. From [9], it can also be understood that the preprocessing helps in better performance of the classifier. In [10], a data driven approach used the outlier based alert system for identifying the anomaly data of patients to reduce the measurement errors. When trained dataset was tested in real-time system, the system proved to be effective. In the following section, the novel pre-processing is proposed for classifying ECG data.
3 PROPOSED
METHODOLOGY
3.1DESIGN OF IOTMODEL
The portable IoT system is designed to work with sensors and microcontroller. The components that are used for setting up the portable system are:
1. LM35 Temperature Sensor 2. Pulse Sensor
3. AD8232 ECG Sensor 4. Arduino Uno
These 3 sensors are connected to the Arduino Uno microcontroller to collect the body temperature, heartbeat rate and ECG signals. The different reading of the patient’s vital signs are gathered and send for testing by the classifier model which are using the dataset for detecting the abnormalities. The prototype is shown in fig.1.
Fig1. Prototype of Working IoT model
The fundamental concept behind the proposed methodology is to enhance the pre-processing of ECG data. The proposed model has two main steps: Pre-processing and classification of heart disease data. The block diagram of the proposed system is shown in figure 2.
Fig. 2. Block Diagram of Proposed System.
3.2 DATASET
The historical health data of the patient was taken from the heart disease health dataset for training the classifier. The dataset used for training the classifier for testing the accuracy, sensitivity and precision of classification is the heart disease dataset which was created by V.A. Medical Center, Long Beach and Cleveland Clinic Foundation. This dataset is available as an open source from the UCI machine learning repository [11]. In this dataset, 75 sets of attributes are available but 14 of these attributes are considered for the prediction of heart disease. The dataset comprises records of 303 patients.
3.3 CORRELATION
𝒓𝒑𝒒=
∑(𝒑𝒊− 𝒑′)(𝒒𝒊− 𝒒′)
√∑(𝒑𝒊− 𝒑′)𝟐∑(𝒒𝒊− 𝒒′)𝟐
𝑟𝑝𝑞represents the correlation coefficient between attributes 𝑝
and 𝑞.
𝑝𝑖 represents the values of 𝑝 attribute in the data sample. 𝑝′ represents the mean of the 𝑝 attribute values.
𝑞𝑖 represents the values of 𝑞 attribute in the data sample.
𝑞′ represents the mean of the 𝑞 attribute values.
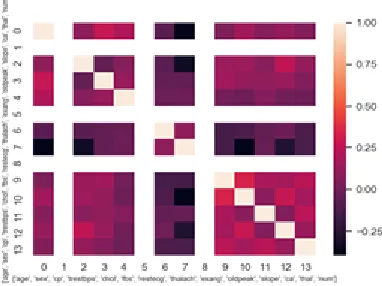
This improves the performance of the classifier algorithm by removing weakly correlated attributes. To better understand the correlation between the attributes, the correlation graph is plotted.
Fig. 3. Correlation of the attributes.
3.2PRE-PROCESSING
This helps to identify the association between the attributes. Correlation values range from -0.25 to +1. Positive correlation represents that the column attributes either increases or decrease together. A negative correlation indicates that one attribute will increase and other one decreases or vice versa. The correlation graph obtained is shown in fig. 3 and is depicted in different colors. The dark maroon states that the attributes are weakly correlated with another and orange color represents a strong correlated with one another.
3.4PRE-PROCESSING
In the pre-processing phase, missing values in the dataset are identified before using them for classification. The collected data in the dataset might contain erroneous entries with noise, missing values, null values and incorrect values. The handling of missing values is very important in machine learning algorithm implementation as it would cause errors. The dataset with missing values degrades the performance of classification. Therefore, in the pre-processing phase, the missing values are replaced by NaN. Then the NaN values are replaced with mean values. Sometimes the values may deviate drastically because of measurement errors. So to identify the wide variation in the attribute values, outlier detection method is used. Outliers are used to find the mistakes during data collection and variance in the data. Those values or observations that go beyond the interquartile ranges (IQR) has great impact on the processing of data. The Interquartile range is given as
IQR=Q3-Q1
where Q3 represents the third quartile and Q1 represents the first quartile. Therefore, it is essential to eliminate them so that
errors of classification algorithm outcome is reduced.
3.5 CLASSIFICATION
The classification algorithm used are performing the pre-processing and classification of dataset values are Naïve Bayes, K nearest neighbor (KNN) and Decision tree [13], [14]. The KNN uses the Euclidean distance for computing the nearest neighbor attribute.
D (P, Q) = √∑(𝒑𝒊− 𝒒𝒋)𝟐
𝑝𝑖represents the training set of attributes with a given class 𝑞𝑖 attributes. To determine the class from nearest neighbor list,
the majority vote of class labels among the K nearest neighbors are computed using the formula
𝒚 = 𝒂𝒓𝒈𝒎𝒂𝒙 ∑ 𝑾𝒊∗ 𝑰(𝒗 = 𝒚𝒊)
(𝒑𝒊,𝒒𝒊∈𝑫𝒛)
where the distance of 𝑧 is the set of 𝑘 closest training examples to 𝑧 and 𝑣 represents the class labels.
Naive Bayes performs classification by using the formula
𝒑 (𝑯 𝑬) =𝒑 (
𝑬
𝑯) 𝒑(𝑯)
𝒑(𝑬) ⁄
H represents the hypothesis and E represents the evidence.
𝑝 (𝐻
𝐸) is the posterior probability of class (target) given predictor
(attribute).
𝑝(𝐸
𝐻) is the likelihood which is the probability of the predictor
given the class.
𝑝(𝐻) is the prior probability of the class.
𝑝(𝐸) is the prior probability of predictor.
The attributes and predictors are independent. One particular attribute doesn’t affect other attributes. The variable has two outcomes (yes or no) i.e., whether they are affected by heart disease or not. The maximum probability of predictor variable
𝑞 is obtained using the formula
𝒒 = 𝒂𝒓𝒈𝒎𝒂𝒙𝑷(𝒒) ∏ 𝑷(𝒑𝒊|𝒒)
𝒏
𝒊=𝟏
where 𝑝𝑖 represents the different attributes.
The decision tree algorithm follows a top down approach to classify the attributes in the dataset. The decision tree works by constructing a tree like graph. There are two ways of finding the root attribute for the tree. The Gini chooses the attribute randomly and entropy uses the logarithmic approach for finding the root attribute. The formula for Gini and Entropy is as follows.
𝑬𝒏𝒕𝒓𝒐𝒑𝒚 = ∑ −𝒑𝒊𝐥𝐨𝐠𝟐𝒑𝒊
𝒊
data. The accuracy is computed by comparing the test value and predicted values. The performance of models is evaluated in terms of accuracy with different test sizes. The decision tree accuracy is high when compared with the Naïve Bayes algorithm.
4 EXPERIMENTAL
RESULTS
The real-time ECG signals of patients were collected from the sensors are fed for testing via the microcontroller. The retrieval of ECG data from the experimental setup is shown in fig 4. The classifier model is tested using Python.
Fig. 4. Retrieval of ECG Data
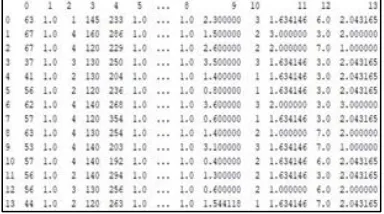
The classifiers used are Naïve Bayes, KNN and decision trees. The classifier is trained and validated using the dataset from UCI database. In the pre-processing phase, the missing values are identified are replaced with NaN values and shown in fig. 5. The mean computation of each column is performed and replacement of NaN values with mean values is shown in fig. 6. This pre-processing procedure improves the performance of the classifier algorithm.
Fig. 5. Replacement of missing values with NaN.
Fig. 6. Replacement of NaN with Mean values.
The fig. 7 shows the Outliers computed using the IQR score. Those values that have large variations are identified and removed.
Fig. 7. Boxplot of Outlier detection.
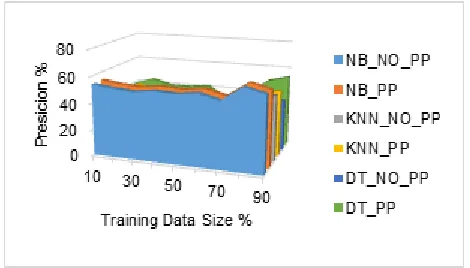
The fig 8, 9 and 10 depicts the classifier algorithms performance in terms of Accuracy, sensitivity and Precision. The results of the three classifiers compared are KNN, Naïve Bayes and Decision tree.
Fig. 8. Comparison of Accuracy with and without pre-processing.
Fig. 9.Comparison of Sensitivity with and without pre-processing.
found that pre-processing improves classification performance and this can be used for testing of ECG signals for abnormality and disorders.
Fig. 10. Comparison of Precision with and without pre-processing.
5 CONCLUSION
This paper discusses the major breakthrough that can be brought about in the healthcare industry by the IoT platform. The benefits and challenges faced by the healthcare system are presented. In this paper, a novel pre-processing technique was proposed to improve the classification of ECG data using machine learning algorithms. The classification algorithm used for training the system are KNN, Naïve Bayes and decision trees. With the introduction of pre-processing technique, the performance of decision tree outperformed other classification algorithms in terms of accuracy, sensitivity and precision. The accuracy of the predicted is evaluated. This method can be used for identification of normality and abnormality of ECG signals and assist in making early and accurate diagnosis.
6
REFERENCES
[1] Y. E. Gelogo, H. J. Hwang, and H.-K. Kim, “Internet of Things (IoT) Framework for u-healthcare System,” International Journal of Smart Home, vol. 9, no. 11, pp. 323–330, 2015. [2] H. Mora, D. Gil, R. M. Terol, J. Azorín, and J. Szymanski, “An
IoT-based computational framework for healthcare monitoring in mobile environments,” Sensors (Switzerland), vol. 17, no. 10, 2017.
[3] Z. Yang, Q. Zhou, L. Lei, and K. Zheng, “An IoT-cloud Based Wearable ECG Monitoring System for Smart Healthcare,” Journal of Medical Systems, 2016.
[4] S. Celin and K. Vasanth, “ECG Signal Classification Using Various Machine Learning Techniques,” pp. 1–11, 2018. [5] R. L. D. V Kalaivani, “Machine learning and IoT ‑ based
cardiac arrhythmia diagnosis using statistical and dynamic features of ECG,” The Journal of Supercomputing, no. 0123456789, 2019.
[6] M. Hammad, A. Maher, K. Wang, F. Jiang, and M. Amrani, “Detection of abnormal heart conditions based on characteristics of ECG signals,” Measurement, vol. 125, no. December 2017, pp. 634–644, 2018.
[7] Elola, E. Aramendi, U. Irusta, J. Del, E. Alonso, and M. Daya, “ECG-based pulse detection during cardiac arrest using random forest classifier,” 2018.
[8] W. S. Bhaya, “Review of Data Preprocessing Techniques in Data Mining,” no. September, 2017.
[9] C. Zhu, “Influence of Data Preprocessing,” vol. 10, no. 2, pp. 51–57, 2016.
[10] M. Hauskrecht, I. Batal, M. Valko, S. Visweswaran, G. F. Cooper, and G. Clermont, “Outlier detection for patient monitoring and alerting,” Journal of Biomedical Informatics, vol. 46, no. 1, pp. 47–55, 2013.
[11] https://archive.ics.uci.edu/ml/datasets/Heart+Disease [12] M. Rawashdeh, M. G. AL Zamil, M. S. Hossain, S. Samarah,
S. U. Amin, and G. Muhammad, “Reliable service delivery in Tele-health care systems,” Journal of Network and Computer Applications, vol. 115, no. December 2017, pp. 86–93, 2018.
[13] M. A. Alsheikh, S. Lin, D. Niyato, and H. Tan, “Machine Learning in Wireless Sensor Networks : Algorithms, Strategies, and Applications,” pp. 1–23, 2015.