www.astrophys-space-sci-trans.net/7/257/2011/ doi:10.5194/astra-7-257-2011
© Author(s) 2011. CC Attribution 3.0 License. Astrophysics and Space Sciences
Transactions
Results from the Telescope Array Experiment
D. Ikeda1for the Telescope Array collaboration∗
1Institute for Cosmic Ray Research, University of Tokyo, Kashiwanoha 5-1-5, Kashiwa, Chiba 277-8582, Japan ∗http://www.telescopearray.org
Received: 29 October 2010 – Revised: 27 February 2011 – Accepted: 28 February 2011 – Published: 4 July 2011
Abstract. The Telescope Array experiment is the largest
hybrid detector to observe ultra-high energy cosmic rays in the northern hemisphere. The observation started in Novem-ber 2007 for Fluorescence Detector (FD) and in March 2008 for Surface Detectors (SD). Here we present the preliminary results of energy spectra measured by three different meth-ods, mass composition, photon search and AGN correlation search from the Telescope Array. The energy spectra mea-sured by the Middle-Drum FD station, which is the refur-bished detector of the High Resolution Fly’s Eye (HiRes) experiment, and hybrid technique with two new FDs and SD were consistent with the result of HiRes. The system-atic error of the energies in hybrid measurement is 19%. The SD spectrum showed the suppression above 1019.75eV with 3.5σ away from the continuous spectrum. The mea-sured mass composition with stereo technique of new FDs was consistent with pure proton model between 1018.6eV to 1019.3eV. Photon search resulted in an improved flux limit above 1019eV. The result of AGN correlation from TA was consistent with background.
1 Introduction
The origin of ultra-high energy cosmic rays (UHECRs) is one of the most interesting questions in particle astrophysics. The important issues for understanding the origin of UHE-CRs are to measure the energy spectrum, mass composition and arrival direction.
Up to now, several experiments have observed and pre-sented the following important results. The AGASA ex-periment (Takeda et al., 1998) published the energy spec-trum without predicted flux suppression called GZK cutoff (Greisen , 1966)(Zatsepin and Kuzmin, 1966). On the other hand, the High Resolution Fly’s Eye (HiRes) observed the
Correspondence to: D. Ikeda
GZK cutoff (Abbasi et al., 2008a), and the Pierre Auger ex-periment confirmed the flux suppression (Abraham et al., 2008). The mass composition has been studied with the maximum depth of the shower development (Xmax). The
Xmax measured by HiRes was in agreement with pure pro-ton model (Abbasi et al., 2010). However, the result of Auger indicated the transition to heavy component above 1018.24±0.05eV (Abraham et al., 2010). Moreover, the corre-lation with AGN was reported by Auger (Pierre Auger Col-laboration, 2007), but not confirmed in HiRes (Abbasi et al., 2008b).
The Telescope Array (TA) experiment is located in the west Utah desert (Matthews et al., 2009). It is operated with three stations of Fluorescence Detectors (FDs) and 507 Sur-face Detectors (SDs) as the largest hybrid detector in north-ern hemisphere to observe UHECRs. The SDs are deployed on a grid of 1.2 km spacing, and the whole array covers a ground area of approximately 700 km2. The details of the SD performance are described in the proceeding (Nonaka et al., 2009) and of trigger system are also described in the pro-ceeding (Taketa et al., 2009). Three FD stations are located in Middle Drum (MD), Black Rock Mesa (BR), and Long Ridge (LR) and surround the SD array. The MD station con-sists of the 14 refurbished HiRes-I telescopes. The BR and LR stations are constructed newly for the TA experiment. The details of the FD performance are described in the pro-ceeding (Tokuno et al., 2009) and of trigger system are also described (Tameda et al., 2009).
The observation started in November 2007 for FD and in March 2008 for SD. Here, the preliminary results of the en-ergy spectra using three different methods, mass composition study, photon search and AGN correlation from TA 1.5-year observation are discussed.
2 Energy spectra
ψ
Shower axis
αi t = ti
t = t*
Shower core Shower Detector Plane
(SDP)
r
Shower plane
SD T’SD
r’SD
S
(r - r’SD)cosψ
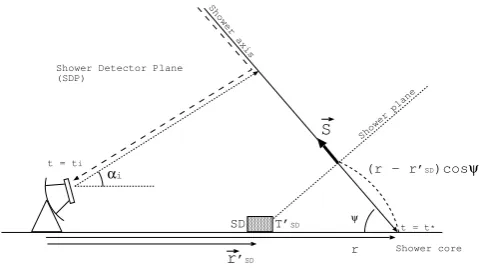
Fig. 1. Shower detector plane and the time fit.
with new FDs and SD.
2.1 FD monocular spectrum on MD station
The FD monocular measurement from the MD station is im-portant because it enables a direct comparison between the FD energy scales and spectra between TA and HiRes. The preliminary spectrum by this technique was presented for the data set from December 2007 to December 2008 in 31st ICRC (Jui et al., 2009). The result is shown in Figs. 4 and 5. This spectrum is in good agreement with the result of HiRes.
2.2 Hybrid spectrum
The hybrid events which are detected both by FD and SD are useful to compare the reconstructed result from FD and that from SD. In addition, hybrid events are reconstructed more precisely using information both of FD and SD than FD monocular analysis alone.
The hybrid event candidates were searched for by the con-dition that the trigger time difference between FD and SD is less than 200µs in the good weather days from May 2008 to September 2009. We found 1978 events: 967 hybrid events measured by BR FD and 831 hybrid events measured by LR FD, and 180 stereo hybrid events measured by BR FD, LR FD, and SD.
In this section, we discuss the energy spectrum and sys-tematic uncertainty measured by using the hybrid events. The details of the hybrid analysis are described in the the-sis (Ikeda, 2010).
2.2.1 Analysis method
In this analysis, the geometry of the air shower is determined by the information of the FD and SD timing, and the longi-tudinal development is determined by FD.
In the hybrid reconstruction, there are two steps to de-termine the shower geometry (Fig. 1). Firstly, the Shower-Detector Plane (SDP), which is the plane that includes both of shower axis and FD station, is determined by the shower
image on the camera since an air shower event is seen as a track. The normal unit vectorn=(nx,ny,nz)of SDP could be found by solvingn·ki=0, wherekiis the direction vector
of thei-th PMT.
Secondly the shower axis on the SDP is determined by timing and direction of the FD PMTs which detect the signals and a SD near SDP:
ti =t∗+
1
c
sinψ−sinαi
sin(ψ+αi) r, (1)
t∗=TSD0 +1
c(r−rSD)cosψ, (2)
TSD0 =TSD−1 c
r0SD−rSD·S , (3)
whereti andαi are the expected timing and the elevation an-gle on the SDP for thei-th PMT,t∗is the time when the air shower reaches the ground, r is the distance of the shower core on the ground from the FD station,ψ is the elevation angle of the shower axis on the SDP,rSDis the position
vec-tor of the SD from the FD station, r0SD is the SD position projected onto the SDP andSis the direction vector of the shower axis from the shower core. Using the hybrid method, we improve FD monocular reconstruction by adding SD tim-ing information. The angular resolution is 1.1◦.
After the reconstruction of shower axis, the shower devel-opment is determined. The basic idea of the energy mea-surement by the FD is that the number of the emitted fluo-rescence photons along the shower axis is proportional to the energy deposit. The sum of the energy deposit in the atmo-sphere is not equal to the energy of the primary cosmic ray because there are two types of missing energy: the energy deposit under the ground and the energy of neutral particles which do not emit fluorescence light. To estimate the for-mer, the observed longitudinal development is extrapolated underground by the fit using the Gaisser-Hillas (GH) func-tion. The latter is estimated by air shower Monte Carlo (MC) simulation, COSMOS (Kasahara et al., 2007) and CORSIKA (Heck et al., 1998). The difference between primary energy and energy measured by the integration of fitted GH function is about 8%. We define it as a missing energy. The differ-ence in GH energy over primary energy between COSMOS and CORSIKA is less than 1%.
apply-ing these effects to MC simulation. The calibration factors are also applied to MC. The fluorescence yield used in this analysis is differential spectrum from FLASH model (Abbasi et al., 2008c) normalized to the total yield from Kakimoto model (Kakimoto et al., 1996). The primary energy is mea-sured by the integration of the fitted GH function with the correction of missing energy. After the reconstruction, two main quality cuts are applied: Xmaxinside the field of view and zenith angle less than 45◦. By this technique, the energy resolution is 8%.
2.2.2 Energy spectrum from Hybrid events
The effective aperture with quality cuts are obtained from the MC simulation code COSMOS with QGSJET-II model for pure proton including calibration factors for all the peri-ods. The exposure of the hybrid analysis is∼4×10¹⁵m2sr s above 1019eV.
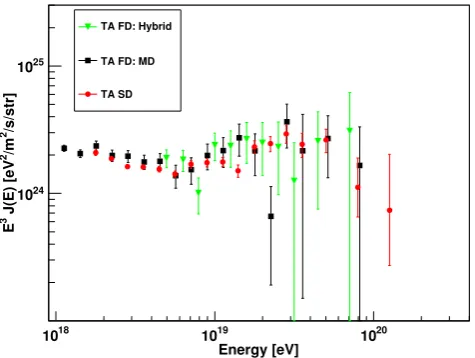
After the reconstruction procedure, 124 events remain above 1018.65eV. This sample consists of 87 events which are reconstructed by BR, 79 events by LR, and 42 events by both of them. The obtained preliminary energy spectrum from hybrid analysis is shown in Figs. 4 and 5. The system-atic uncertainty of energy determination is 19% as described in Sect. 2.2.3. The systematic uncertainty is obtained to be 12% in flux from cloud monitoring. Figure 5 shows that the spectrum by hybrid analysis from the TA is consistent with the HiRes result. It indicates that the energy scale of TA is consistent with that of HiRes.
2.2.3 Systematic uncertainty
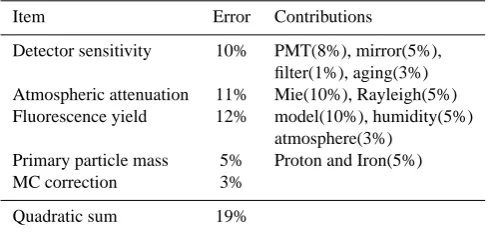
The systematic uncertainties in energy determination are summarized in Table. 1. Systematic uncertainties are dom-inated by the uncertainties in the fluorescence yield (12%), atmosphere attenuation (11%) (Tomida et al., 2009) and the absolute detector calibration (10%) (Tokuno, et al., 2009).
2.3 SD spectrum
The energy spectrum is measured by using the SD data from May 2008 to February 2010. The exposure is
∼1500 km2sr yr which is equivalent to AGASA observation. In this section, the analysis method, energy scale and mea-sured energy spectrum are discussed.
2.3.1 Analysis method
The basic idea of the energy reconstruction is to use the charge density at a distance of 800 m from shower core (S800) as an energy estimator. From the table ofS800and zenith an-gle with primary energy using MC simulation, the energies of the observed cosmic rays are estimated.
Air shower MC simulation events were generated by CORSIKA with QGSJET-II model. The detector simulation with front-end electronics and trigger were constructed with
Table 1. The systematic uncertainties of the energy measurement
by FD.
Item Error Contributions
Detector sensitivity 10% PMT(8%), mirror(5%), filter(1%), aging(3%) Atmospheric attenuation 11% Mie(10%), Rayleigh(5%)
Fluorescence yield 12% model(10%), humidity(5%)
atmosphere(3%) Primary particle mass 5% Proton and Iron(5%)
MC correction 3%
Quadratic sum 19%
Geant4 (Agostinelli et al., 2003). The generated MC data were analyzed by the same procedure used for the data.
There are two types of fits in SD event reconstruction: the fit to determine the geometry and the fit for lateral density distribution. First a fit for the geometry of the shower is performed using the “modified Linsley” formula (Linsley, 1986);
χ2= nSD X
i=1
(ti−T0−TPlane−TD)2 T2
s
+(R−RCOG)
2
(180m)2 , (4)
whereti is the leading edge time ofi-th SD,T0is the time when the shower core hits the ground,TPlane is the time of the shower front plane,TD andTS are the time delay and its
position,Ris the core position andRCOGis the core position obtained from the center of gravity of observed charge. The lateral density distribution is obtained by the fit of Lateral Distribution Function (LDF) used by AGASA (Yoshida et al., 1993);
ρ(r)∝
r
RM −1.2
r+ r RM
−(η−1.2)
×
1+ r
1000
2−0.6
, (5)
η=3.97−1.79×(secθ−1), (6)
wherer is the distance from the shower core, ρ(r)is the charge density at r (VEM/m2), RM is the Moli`ere length,
andθ is zenith angle. These fitting procedures and formulas are tuned with the residuals of the fit to the data. The fit result of the MC data is also good in the same way as the data. It means that CORSIKA MC simulation with QGSJET-II model and the data have the same lateral distribution. The following quality cuts are applied;
– Reducedχ2of geometry fit<4.0
– Reducedχ2of LDF fit<4.0
– Distance of the core from the array edge>1.2 km
)
θ
sec(
1 1.1 1.2 1.3 1.4 1.5
(S800)
10
log
0 0.5 1 1.5 2 2.5 3
18 18.5 19 19.5 20 20.5
eV
17.8
10 eV
20.5
10
Fig. 2. The zenith angle andS800for each energy obtained from
MC. The horizontal axis is zenith angle, the vertical axis is theS800.
Different colors represent different primary energies.
Fig. 3. The comparison of the energies between FD and SD. The
red line corresponds to ESD= EFD. The blue line corresponds to
ESD= 1.27×EFD.
– Pointing direction uncertainty<5◦
– FractionalS800error<0.25
Figure 2 shows the correlation ofS800and zenith angle with primary energy. The first estimation of the energy is done by interpolating betweenS800and sec(θ) line.
The geometrical resolutions of this analysis obtained from MC study are 1.1◦as zenith angle and 1.2◦as azimuthal angle above 1018.8eV. The energy resolutions are also obtained to be about 35% (1018.0eV< E <1018.5eV), 30% (1018.5eV
< E <1019.0eV), and 20% (E >1019.0eV). 2.3.2 Energy scale
We compare the energy scales of FD and SD using hybrid events. The scatter plot of the energies of well-reconstructed 331 events is shown in Fig. 3. This result shows that the ergy of SD is 27% larger than that of FD. We choose the en-ergy scale of FD, and the SD enen-ergy is rescaled by 27%. The
Energy [eV] 18
10 1019 1020
/s/str]
2
/m
2
J(E) [eV
3
E
24 10
25 10
TA FD: Hybrid
TA FD: MD
TA SD
Fig. 4. The preliminary spectra measured using the MD FD station,
Hybrid analysis (new FDs with SD), and SD in TA.
Energy [eV] 18
10 1019 1020
/s/str]
2
/m
2
J(E) [eV
3
E
24 10
25 10
AGASA
HiRes-1
HiRes-2
Auger (ICRC31)
TA FD: Hybrid
TA FD: MD
TA SD
Fig. 5. The preliminary spectra from TA together with other
exper-iments.
systematic error of the obtained energy scale is 19% from the uncertainty in hybrid reconstruction.
2.3.3 Energy spectrum from SD events
0 5 10 15 20
500 600 700 800 900 1000
Entry
Xmax [g/cm2]
data P QGSJET-II Fe QGSJET-II
Fig. 6. The comparison of the reconstructedXmaxbetween data
and MC with QGSJET-II model. The black points are data, the red histogram is the MC data with pure proton and the blue histogram is the MC data with pure iron.
3 Composition
The basic idea to determine the composition of UHECR is to use the dependence of the depth of shower maximum on the primary energy and mass composition. In order to determine the mass composition, we measured the atmospheric depth of shower maximum (Xmax) by FD stereo technique. On the other hand, since the air showers induced by photon would penetrate deeper into the atmosphere than those by proton clearly, and shower fronts of deeper showers curve more, we search for UHE photons by analyzing the shower front cur-vature of events observed by SD. Here, the results of photon search and mass composition measurement are discussed.
3.1 Mass composition by FD stereo technique
The mass composition is measured by using the events ob-served simultaneously with two new FDs analyzed by stereo technique. As discussed in Sect. 2.2.1, SDP can be deter-mined precisely since an air shower event is seen as a track on the camera. However, the reconstruction of theψ angle mentioned in Fig. 1 is difficult, and the measuredXmax de-pends onψangle strongly. For the stereo events, the shower geometry is determined without the bias ofψangle because we use an intersection of two SDPs. Therefore, as the first step, theXmax was measured by stereo technique. The de-tails of the mass composition study are described in the thesis (Tameda, 2010).
The data set from November 2007 to October 2009 is used in this analysis with two new FDs. The events observed si-multaneously with two FDs are analyzed for the shower ge-ometry by stereo technique which was mentioned above and for the longitudinal development by the same way of hybrid events. The main quality cuts are the reconstructedXmaxin
500 550 600 650 700 750 800 850 900
18 18.5 19 19.5 20 20.5
<Reconstructed X
max
> [g/cm
2 ]
log(Reconstructed E[eV]) P QGSJET-II P QGSJET-01 P SIBYLL Fe QGSJET-II Fe QGSJET-01 Fe SIBYLL
Fig. 7. The preliminary result of the comparison of the average
re-constructedXmaxfor each energy between data and MC. The black
points are data. The lines are the predictions of the pure proton and pure iron compositions with the interaction models of QGSJET-II, QGSJET-01 and SIBYLL.
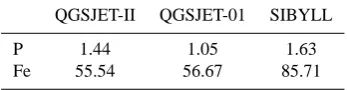
Table 2. The reducedχ2obtained by the comparison of theXmax
distribution between data and MC.
QGSJET-II QGSJET-01 SIBYLL
P 1.44 1.05 1.63
Fe 55.54 56.67 85.71
the field of view, zenith angle less than 56◦, and shower core position within 9.6 km from the middle point of two FD sta-tions. The resolution of energy is 6% and that ofXmaxis 16 g/cm2. After the reconstruction procedure, 54 events re-main above 1018.6eV.
The reconstructed Xmax distribution was compared with the predictions of three interaction models. The Xmax de-pends not only on the composition but also on the interaction model. For the comparison, the MC data are generated by the CORSIKA with the particle types of proton and iron, and the interaction models of QGSJET-01, QGSJET-II and SIBYLL. The MC data are analyzed in the same way as the data. We notice that the measuredXmax has a bias from the limit of the field of view. Since this bias also depends on the model, the reconstructedXmaxfrom data and MC should be com-pared by applying the same analysis procedure. The result of the comparison with QGSJET-II is shown in Fig. 6 and the obtained reducedχ2for each model is in Table. 2. The dis-tribution ofXmaxof observed data is in good agreement with that of MC data generated by pure proton.
18 18.5 19 19.5 20 Log EmineV
35.5 36 36.5 37 37.5 38
Log
H
E
2 F
Γ
H
eV
2 km
-2 yr
-1 sr
-1 LL
A
A
PA PA
PA
Y Y
Y
TA
TA ICRC
PRELIMINARY
Fig. 8. The preliminary result of the photon flux limit. The lines are
the results of photon search. The red line is the result of this anal-ysis, the gray line is the previous result from TA shown in the 31st ICRC. Other abbreviations mean as follows: A:AGASA (Shinozaki et al., 2002), PA:Auger-SD(Abraham et al., 2009), Y:Yakutsuku (Glushkov et al., 2010).
3.2 Photon search
To search for UHE photons, we use the modified event-by-event method proposed earlier (Gorbunov et al., 2007) with Linsley curvature parameter. The details of the anal-ysis method and previous result were presented for the data set with zenith angle below 45◦from May 2008 to Novem-ber 2008 in the 31st ICRC (Rubtsov et al., 2009). Now the upper limit is improved to 3.3×10⁻²km−2sr−1yr−1above 1019eV with a confidence level of 95% by increasing the data set from May 2008 to October 2009 and by using larger zenith angle between 45 and 60◦which are more sensitive to UHE photon search (Fig. 8).
4 AGN correlation
The Auger reported the correlations with AGN (Pierre Auger Collaboration, 2007). This study is quite important to un-derstand the origin of the UHECRs. Therefore, we also checked the correlation of the events observed from TA SD with AGN. The search condition is the same as that by Auger; 57 EeV of threshold energy, 3.1◦of correlation angle, V-C catalog (Veron-Cetty and Veron, 2006) with 0.018 of max-imum redshift. We observed 13 events above 57 EeV, and there are 3 events correlated with AGN (Fig. 9). On the other hand, the prediction from the random distribution is 3.0 events. The results of AGN correlation from TA is consistent with background.
0 2 4 6 8 10 12
0 2 4 6 8 10 12 14
N_corr
N_tot
Fig. 9. The preliminary result of the correlation with AGN. The
hor-izontal axis is the number of observed events and the vertical axis is the number of correlated events with AGN. The red points are data, the light blue area shows 1σregion, the green area shows 2σregion, the black dotted line is the prediction from random distribution and the blue dotted line is the prediction from the result of Auger.
5 Conclusions
Here, we presented the preliminary results from the Tele-scope Array: energy spectra measured by three different methods , mass composition study withXmax, photon search and the study of AGN correlations. The spectra measured by the MD station as the HiRes refurbished detector and new two FDs and SD with hybrid technique were consistent with the result of HiRes. As an important result, the SD spec-trum showed evidence for the suppression above 1019.75eV with 3.5σ away from the continued spectrum. The system-atic error of the energy determination was estimated as 19%. The mass composition measured by the FD stereo observa-tion was consistent with pure proton model for energies from 1018.6eV to 1019.3eV. Photon search resulted in an improved flux limit above 1019eV. The result of AGN correlation from TA is consistent with background.
Acknowledgements. The Telescope Array experiment is
the Office of the Vice President for Research. The experimental site became available through the cooperation of the Utah School and Institutional Trust Lands Administration (SITLA), U.S. Bureau of Land Management and the U.S. Air Force. We also wish to thank the people and the officials of Millard County, Utah, for their steadfast and warm supports. We gratefully acknowledge the contributions from the technical staffs of our home institutions and the University of Utah Center for High Performance Computing (CHPC).
Edited by: T. Suomijarvi
Reviewed by: two anonymous referees
References
Abbasi, R. U. et al.(HiRes Coll.): First Observation of the Greisen-Zatsepin-Kuzmin Suppression, Phys. Rev. Lett., 100, 101101, doi:10.1103/PhysRevLett.100.101101, 2008a.
Abbasi, R. U. et al.(HiRes Coll.): Search for correlations between HiRes stereo events and active galactic nuclei, Astropart. Phys., 30, 175–179, doi:10.1016/j.astropartphys.2008.08.004, 2008b. Abbasi, R. U. et al.(FLASH Coll.): Air fluorescence
mea-surements in the spectral range 300-420 nm using a 28.5 GeV electron beam, Astropart. Phys., 29, 77–86, doi:10.1016/j.astropartphys.2007.11.010, 2008c.
Abbasi, R. U. et al.(HiRes Coll.): Indications of Proton-Dominated Cosmic-Ray Composition above 1.6 EeV, Phys. Rev. Lett., 104, 161101, doi:10.1103/PhysRevLett.104.161101, 2010.
Abraham, J. et al.(Pierre Auger Coll.): Observation of the Suppres-sion of the Flux of Cosmic Rays above 4×10¹⁹eV, Phys. Rev. Lett.,101, 061101, doi:10.1103/PhysRevLett.101.061101, 2008. Abraham, J. et al.(Pierre Auger Coll.): Upper limit on the cosmic-ray photon flux above 1019 eV using the surface detector of the Pierre Auger Observatory, Astropart. Phys., 29, 399–406, doi:10.1103/PhysRevD.79.102001, 2009.
Abraham, J. et al.(Pierre Auger Coll.): Measurement of the Depth of Maximum of Extensive Air Showers above 1018eV, Phys. Rev. Lett., 104, 091101, doi:10.1103/PhysRevLett.104.091101, 2010. Agostinelli, S. et al.(GEANT4 Coll.): Geant4: A Simulation Toolkit, Nucl. Instr. Meth. A, 506, 250–303, doi:10.1016/S0168-9002(03)01368-8, 2003.
Glushkov A. V. et al.(Yakutsk EAS Array Coll.): Constraints on the flux of primary cosmic-ray photons at energies E > 1018 eV from Yakutsk muon data, Phys. Rev. D, 82, 041101, doi:10.1103/PhysRevD.82.041101, 2010.
Gorbunov D. S., Rubtsov G. I. and Troitsky S. V.: To-wards event-by-event studies of the ultrahigh-energy cosmic-ray composition, Astropart. Phys., 28, 28–40, doi:10.1016/j.astropartphys.2007.04.003, 2007.
Greisen, K.: End to the Cosmic-Ray Spectrum?, Phys. Rev. Lett., 16, 748–750, doi:10.1103/PhysRevLett.16.748, 1966.
Heck, D., Knapp, J., Capdevielle, J.N., et al.: CORSIKA: A Monte Carlo Code to Simulate Extensive Air Showers, Report FZKA, 6019, 1998
Ikeda, D.: Hybrid analysis of ultra-high energy cosmic rays ob-served with the Telescope Array, Ph.D. thesis, University of Tokyo, Japan, 2010.
Jui, C. C. H. et al.(Telescope Array Coll.): Toward a comparison of fluorescence energy scale and spectra between Telescope Array
and the High Resolution Fly’s Eye, 31st ICRC, Lodz, Poland, 7–15 July, 2009.
Kakimoto, F., Loh, E.C., Nagano, M., et al.: A measurement of the air fluorescence yield, Nucl. Instr. Meth. A, 372, 527–533, doi:10.1016/0168-9002(95)01423-3, 1996.
Kasahara, K. and Cohen, F.: A New Parallel Processing Scheme Enabling Full Monte Carlo EAS Simulation in the GZK Energy Region, 30th ICRC, Merida, Mexico, 3–11 July, 2007.
Linsley, J.: Thickness of the particle swarm in cosmic-ray air showers, J. Phys. G: Nucl. Phys., 12, 51-57, doi:10.1088/0305-4616/12/1/013, 1986.
Matthews, J. N. et al.(Telescope Array Coll.): Overview of the Tele-scope Array Experiment, 31st ICRC, Lodz, Poland, 7–15 July, 2009.
Nonaka, T. et al.(Telescope Array Coll.): Performance of TA Sur-face Array, 31st ICRC, Lodz, Poland, 7–15 July, 2009.
Pierre Auger Collaboration: Correlation of the Highest-Energy Cosmic Rays with Nearby Extragalactic Objects, Science, 318, 938–943, doi:10.1126/science.1151124, 2007.
Rubtsov, G. I. et al.(Telescope Array Coll.): Search for ultra-high energy photons in the Telescope Array surface detector first-year data, 31st ICRC, Lodz, Poland, 7–15 July, 2009.
Shinozaki, K., Chikawa, M., Fukushima, M. et al.: Upper limit on gamma-ray flux above 1019eV estimated by the Akeno Gi-ant Air Shower Array experiment, Astrophys. J., 571, 117–120, doi:10.1086/341288, 2002.
Takeda, M. et al.(AGASA Coll.): Extension of the Cosmic-Ray Energy Spectrum beyond the Predicted Greisen-Zatsepin-Kuzmin Cutoff, Phys. Rev. Lett., 81, 1163-1166, doi:10.1103/PhysRevLett.81.1163, 1998.
Taketa, A. et al.(Telescope Array Coll.): The trigger and DAQ sys-tem of the surface detector array of the Telescope Array experi-ment, 31st ICRC, Lodz, Poland, 7–15 July, 2009.
Tameda, Y., Taketa, A., Smith, J. D., et al.: Trigger elec-tronics of the new Fluorescence Detectors of the Telescope Array Experiment, Nucl. Instr. Meth. A, 609, 227–234, doi:10.1016/j.nima.2009.07.093, 2009.
Tameda, Y.: The Mass Composition of Ultra-High Energy Cosmic Rays Observed by Telescope Array Observatory, Ph.D. thesis, Tokyo Institute of Technology, Japan, 2010.
Tokuno, H. et al.(Telescope Array Coll.): Performance of the Flu-orescence Detector of the Telescope Array experiment, 31st ICRC, Lodz, Poland, 7–15 July, 2009.
Tokuno, H., Murano, Y., Kawana, S., et al.: On Site Cal-ibration for New Fluorescence Detectors of the Telescope Array Experiment, Nucl. Instr. Meth. A, 601, 364–371, doi:10.1016/j.nima.2008.12.210, 2009.
Tomida, T. et al.(Telescope Array Coll.): Measurement of atmo-spheric transparencies with LIDAR for Telescope Array, 31st ICRC, Lodz, Poland, 7–15 July, 2009.
Veron-Cetty M. P. and Veron P.: A catalogue of quasars and ac-tive nuclei: 12th edition, Astron. Astrophys., 455, 773–777, doi:10.1051/0004-6361:20065177, 2006.
Yoshida, S., Hayashida, N., Honda, K. et al.: Lateral distri-bution of charged particles in giant air showers above 1EeV observed by AGASA, J. Phys. G: Nucl. Phys., 20, 651–664, doi:10.1088/0954-3899/20/4/011, 1994.