Abstract
An assault on a network that floods it with numerous requests that regular network traffic is either slowed or completely interrupted. Unlike a virus or worm which can cause severe damage to ETL process, Database and Reporting System as well. The reliability and availability of network services are being threatened by the growing number of Denial-of-Service (DoS) attacks on web server. Effective mechanism for DoS attack detection is demanded. Such detection system needs to implement which will capable to provide analytical data using statistical analysis. Different systems were proposed for detection DoS attacks using machine learning, statistical analysis, data mining, etc. The proposed system is enhancement of earlier one in which k- means clustering technique is applied over a training data samples so that it can categorize the samples into different clusters and then it applies statistical analysis methods to find the correlation between features to reap statistical mathematical information like standard deviation, mean and covariance matrix. While applying multivariate correlation analytics on each cluster based on threshold value of clustered data set will help to get profile parameters according to related cluster and will get to know sharp boundary of characterizing a sample packet. Ultimately, this will reduce false positive rate and will beef up the accuracy.
Keywords: ETL, Database, Reporting System, DDoS, Analytics
________________________________________________________________________________________________________
I. INTRODUCTION
Recently, networks have experienced remarkable expansion that has speed up a change in computing stacks from centralized computer systems to network information systems. An enormous volume of fruitful information such as personal profiles and credit card information is scattered and transferred through networks. Hence, network security has become more cardinal than ever. However, given open and complex interconnected network systems, it is difficult to set up a secure networking environment. Intruders endanger system security by crashing services, changing critical data, and stealing important information.
Intrusion detection systems (IDSs) are designed to discover malicious activities that attempt to compromise the confidentiality, integrity and assurance of computer systems. Unlike a firewall that filters “bad” traffic, an IDS analyzes packets to detect malicious attack attempts. Based on the report of the CSI/FBI computer crime and security survey in 2006, the IDS has become the fifth most widely used security technology. Undoubtedly, intrusion detection systems have become critical components in network security. Therefore, two factors need to be considered to ensure IDS effectively. First, the IDS should deliver reliable detection results. The detection method should be effective in discovering intrusions since poor detection performance ruins the trustworthiness of the IDS. Second, the IDS should be able to survive in hostile environments or even under attack.
II. HADOOP FRAMEWORK
Hadoop is an open-source software framework that supports data-intensive distributed applications. It enables applications to work with thousands of computationally independent computers and with petabytes of data [3], [4]. Hadoop increases the storage space
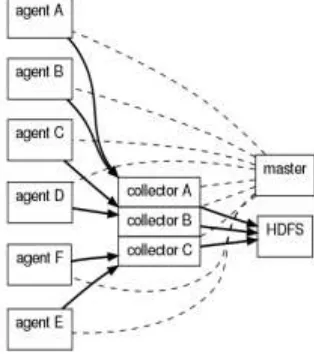
Fig. 1: Hadoop Framework
A small Hadoop cluster will include a single master and multiple worker nodes (slaves) as in Figure 1. The master node consists of a Job Tracker, Task Tracker, Name Node and Data Node. A slave or worker node acts as both a Data Node and Task Tracker. In a large cluster, HDFS is managed through a dedicated Name Node server to host the file system index and a secondary Name Node that can generate snapshots of the Name Node’s memory structures, thus preventing file system corruption and reducing loss of data [5].
Hadoop Distributed File System and Map Reduce
Hadoop Distributed File System (HDFS) is a distributed, scalable, and portable file system written in Java for the Hadoop framework on top of Yahoo YARN platform.
Map Reduce is a Hortonworks software framework using for easily writing applications which process vast amounts of data (multi-terabyte data-sets) in-parallel on large clusters (thousands of nodes) of commodity hardware in a reliable, fault-tolerant manner.[4]
III. DOS ATTACK DETECTION WITH HADOOP
Data Generation
ETL (Extract, Transform and Load) architecture is simple, robust, and flexible. In our system we are using flume tool for data generation or we can say log file generation.
We have implemented normalization to eliminate redundancy by having a data element reprensented in only one place.We used a dependent relationship between two elements in a input data set. This will surely enhance the performance and accuracy of system and result set respectively.
K means Clustering Based on Threshold Value:
We can distinguish number of data set using their identical behavior on the basis of their virtues and features.While clustering we have taken help of thershold value for needed to cause a cluster to differ from one another and to perform statistical mathematical analysis.[1]
The Clustering aggregates data set values per threshold. In fact, when total requests for a specific server exceeds the threshold, the Map Reduce job emits records whose response ratio against requests is greater than unbalance ratio, marking them as attacks. While this clustering algorithm has the low computational complexity and could be easily converted to the Map Reduce implementation, it needs a prerequisite to know the threshold value from historical monitoring data in advance.
We have used Java for implementation of clustering of data set and their threshold value for which developed different user-defined functions (UDFs). Estimated microseconds dealings the approximate amount of time spend in a UDF and approximate invocations measures the approximate number of times the UDF was invoked.[5]
Statistical Data Set Analytics
Statistical Analytics addresses opportunities in Big Data Analytics while at the bottom of the following objectives for effective with Big Data Analytics:
1) Optimizing business production process and reducing operational cost
2) Reducing the jeopardy by anticipating and justifying problems before they occur 3) Reduce data moment and replication along with optimize computational speed.
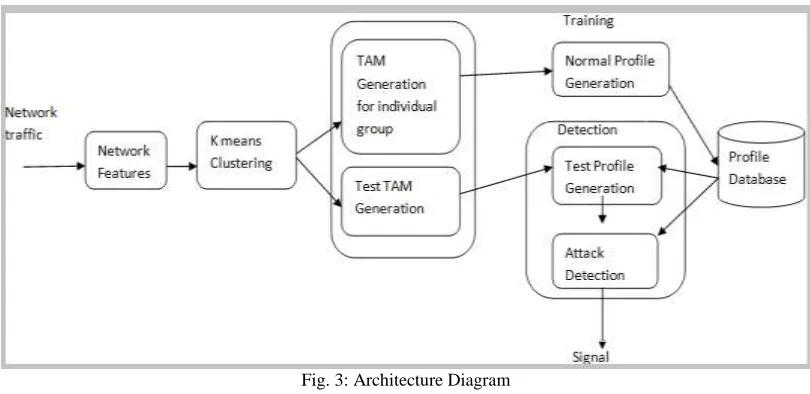
Traditional IT infrastructure is simply not able to meet the demands of new “Big Analytics” landscape. For these reasons, many enterprises are turning to the statistical programming technique and Hadoop as a potential solution to this solve the commercial need. For each one cluster we apply multivariate correlation analysis so as to find out mean, standard deviation, covariance matrix and TAM, therefore we reap sharpen boundary values for training data samples. In this experiment, we used multiple variables in a forecasting model. We consider that the data points are generated independently from k different multivariate distributions in Rd. Assume any one such distribution. Let X : x1;x2;...;xd† denote a random vector from this distribution. Let µ belong to Rd
denote the mean point of this distribution and let ∑ denote the d × d covariance matrix for the distribution E: ∑ = E((X- µ) (X- µ)T)
Monitor that the diagonal elements of Summation are the variances of the random variables that are associated, respectively, with the individual coordinates. Let tr(∑ ) denote the trace of ∑, that is, the sum of its diagonal elements. We will measure the dispersion (aka frequency deviation) of the distribution by the variable σ = tr(∑ )1/2 . This is a natural generalization of the notion
of standard deviation for a univariate distribution. [2]
Fig. 3: Architecture Diagram
IV. DASHBOARD
Dashboards give signs about a business letting you know something is wrong or something is right. The corporate world has tried for years to come up with a solution that would tell them if their business needed maintenance or if the temperature of their business was running above normal [6]. Dashboards give you an overview of how your properties are performing by displaying summaries
of different reports as widgets on a single or multiple pages through hyper link. It is difficult to collect, review, or analyze massive amounts of data can be overwhelming for anyone. We are here proposing a modern dashboard over more conventional data collection and visualizing methods such as manual recording or non-real-time manual input software. We are going to enactment the output of server which is in the format of log file using the modern dashboards technique. It provides excellent feature over the traditional software such as it brings your data to life with interactive graphs, charts and maps that will engage your readers. With a few clicks you can embed your interactive graphs, dashboards, maps and tables anywhere and share with everyone. It provides tremendous graphical statistic information in fraction of second which will helpful to dish out genuine user and attacker.
V. EXPERIMENTAL RESULTS
The praposed system is using clustering technique to detect DdoS attack by computing single threshold value of every cluster. Hence, the accuracy of praposed system is 100%. However this is dependent on training of data set. Intoduction of new attack bahaviour will not maintain accuracy of praposed system, we need to make sure to analyze the new attack features in timely manner and capture it for training purpose.
Table – 1
Average Detection Performance of the Proposed System on Normalized Data against Average Thresholds Type Of Record Performance For Average Threshold
Normal 97.97%
Teardrop 100%
Smurf 100%
Pod 100%
Neptune 100%
Land 100%
Back 98.96%
Table – 2
Detection Rate and False Positive Rate Achieving by the Proposed System on Normalized Data AVERAGE THRESHOLD
FPR 2.03%
DR 99.99%