International Journal of Emerging Technology and Advanced Engineering
Website: www.ijetae.com (ISSN 2250-2459,ISO 9001:2008 Certified Journal, Volume 4, Issue 10, October 2014)
546
Efficient 3-class Fuzzy C-Means Clustering algorithm with
Thresholding for Effective Medical Image Segmentation
Sunil Kumar
1,
Prof. R. R. Ahirwar2,
Prof. Y. K Jain31,2,3Department of Computer Science & Engineering, SATI, Vidisha, India
Abstract— Medical image segmentation is a method of
extracting the desired parts and features from the input medical image data. The conventional FCM algorithm is an efficient clustering algorithm that is used in medical image segmentation. But FCM is extremely susceptible to noise since it uses intensity values for clustering the image. This paper aims to develop 3-class FCM algorithm with thresholding which is noise efficient. The proposed 3-Class FCM method improves efficiency of image by modifying the initialization of fuzzy petition matrix this method uses normally distributed pseudorandom numbers generator with Gaussian distribution for initial estimates of petition matrix. The thresholding with FCM is used to generate the logical segmented images. As another improvement in this paper, colour segments are generated by utilizing the results of FCM. And the results of the proposed FCM method are tested upon the variety of medical images and compared with the widely used Global thresholding and Otsu’s method. The performance is also evaluated for comparison of FCM with different distance masers.
Keywords—Color segment’s, Medical Image segmentation,
Fuzzy C-mean Clustering, Thresholding, Entropy.
I. INTRODUCTION
In the last two decades with the development of various scanning technologies it has become possible to capture a large variety of images of human or animal anatomy. Image segmentation is widely used in a variety of applications such as robot vision, object recognition, geographical imaging and medical imaging. The medical imaging methodology broadly includes Ultrasound images, Computed Tomography (or CT scan), X-ray images, Optical sonographic images and Magnetic Resonance Imaging (MRI). Segmentation permits us to efficiently analysis and comprehensively manipulate the medical images especially for radiological evaluation, computer aided diagnosis, 3D visualization of objects, disease identification and surgical planning.
The goal of image segmentation is to partition an image into a set of disjoint regions with uniform and homogeneous attributes such as intensity, color, tone or texture, etc. Many different segmentation techniques have been developed and detailed.
[image:1.612.338.550.336.398.2]Surveys can be found in references [1–3]. According to reference [1], the image segmentation approaches can be divided into four categories thresholding, clustering, edge detection and region extraction. Basically segmentation is considered as the first stage of pattern and feature recognition process [21] used for object isolation as shown in Figure.1. Therefore efficiency of the feature extraction and image classification depends open the efficiency of the segmentation.
Figure 1 Basic process of segmentation [21]
Segmentation algorithms are basically based on two basic properties of intensity images namely discontinuities and similarity. In the first category partition an image based on abrupt change in intensity such as [14] edges in an image. The approaches in the second category are based on partitioning an image into regions that are similar according to the set of pre-defined criteria. Region growing [10], region splitting and merging [9], and Thresholding [7, 18, 21] are the examples of methods in this category
International Journal of Emerging Technology and Advanced Engineering
Website: www.ijetae.com (ISSN 2250-2459,ISO 9001:2008 Certified Journal, Volume 4, Issue 10, October 2014)
547 Fuzzy C Means (FCM) algorithm is the most popular method used in image segmentation because it has robust characteristics for ambiguity and can retain much more information than the conventional FCM algorithm works well on most noise-free images, it has a serious limitation it does not incorporate any information about spatial context, which cause it to be sensitive to noise and imaging artifacts
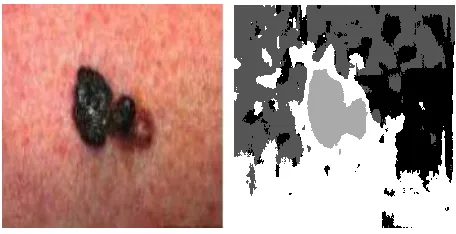
In this paper, a clustering based method for image segmentation is proposed to be considered. An efficient method of medical image segmentation is proposed which uses the improved 3-Class FCM with thresholding for image segmentation. Figure 2 gives an example of 3-class FCM. Each class represents a color group.
[image:2.612.54.282.288.405.2]
Figure 2 Example of clustering with 4 clusters a) original Skin-3 image b) clustered image.
It is clear that the desired object belongs to the particular class as shown in red colour oval in Figure 2. Actually clustering method finds the regions of close boundaries based on similarity measures.
The prim aims of this paper are;
1. To speed up the FCM method by modifying the
initialization of fuzzy partition matrix Method uses normally distributed pseudorandom numbers generator and normal distribution for initial estimates of membership function.
2. Adjust the exponent of the fuzzy membership function for better segmentation.
3. The conventional method of thresholding with FCM
generates the logical segmented images. Therefore as another improvement in this paper, Colour segments are generated by utilizing the results of FCM. And the results of the proposed Clustering method are tested upon the variety of medical images and performance is evaluated for comparison of FCM with different distance masers.
The rest of this paper is organized as follows. Section II briefly describes the theory of FCM and thresholding algorithms. The proposed 3-Class FCM algorithm is presented in Section III.
Experimental results and comparisons are given in Section IV. Finally Conclusions is drawn in Section V.
II. REVIEW OF RELATED THEORY
The clustering based medical image segmentations have been widely used by researchers in the past [1, 4, 7, 9, and 17]. Jun Zhang et al. [4] used Otsu’s adaptive thresholding based segmentation for histogram based analysis. But this method is not consistent and needs additional pre processing to improve the image quality in many cases. D. Patil et al. [9] have presented a brief review of the various medical image segmentation methods based on region growing, clustering and histogram based thresholding. The clustering based method works efficiently for medical images. G. Padmavathi [17] implemented a fuzzy c means clustering method with thresholding for segmenting the medical images. Paper compares the standard fuzzy c means clustering algorithms with their proposed method for medical images. The quantitative statistical measures have been used for evaluating the nonlinear image region segmentation. Qualitative measures used are, the gray level energy, discrete entropy, relative entropy, mutual information and information redundancy. But clustering is less effective for large number of diagnosis images with non uniform brightness conditions such as in medical images. Therefore, thresholding is widely used to improve the efficiency of the standard FCM. Radhika et al. [18] have proposed a method of the segmentation of dark areas in SAR images to detect the oil spill. They have used FCM with 3 class thresholding [21], which perform efficiently.
A.Fuzzy C –Means Clustering
In fuzzy clustering, the membership function of extracted features for each pixel at each cluster change proportional to zonal mean of membership values and gradient mean of adjacent pixels. The direction of membership variations are specified using human interaction. Their segmentation approach was applied for segmentation of texture and documentation images and the results have shown that the human interaction eventuates to clarification of texture and reduction of noise in segmented images.
International Journal of Emerging Technology and Advanced Engineering
Website: www.ijetae.com (ISSN 2250-2459,ISO 9001:2008 Certified Journal, Volume 4, Issue 10, October 2014)
548 Clearly, summation of membership of each data point should be equal to one. After each iterations membership and cluster centers are updated according to the formula
(2 1)1
1
m c k ik ij ijd
d
(1.a)
.
,
j
1,2,...
.c
1 1
n i n ij i n i n ij jx
v
(1.b)Where, is the number of data points. represents the cluster canter.
is the fuzziness index
represents the number of cluster canter.
is membership of data and cluster canter.
- Euclidean distance within data and center.
The Jafar et al.[19] have explained the Chi square distance measure between vector x and canters v is give as;
n i i v i x i v i x i v i x d 1 2 ) ,( (2)
B.Thresholding
Thresholding is the simplest and widely used method for segmenting the medical images. It is useful for discriminating foreground objects from the background [7, 21]. By selecting an adequate threshold , the gray scale image can be converted to a binary image. The binary image should contain all of the essential information about the position and shape of the objects of interest (foreground). During the thresholding process assume an object to be brighter than the background, and then individual pixel in an image is marked as ―object‖ pixels if their value is greater than threshold T else as ―background‖ pixels. This is known as above threshold. Typically, an object pixel is given a value of ―1‖ while a background pixel is given a value of ―0.‖ Finally, a binary image is created by converting image to black and white image. Various methods of thresholding are used by the researchers out of these methods Global thresholding [5] and Otsu’s [4] thresholding have gained popularity.
C.Global Thresholding
The common way to convert gray level image to a binary image is to select a single global threshold value from image histogram, than all the gray level values below this will be classified as black (0), and those above will be white (1). The segmentation problem becomes one of selecting the proper values for the global threshold .This technique can be expressed as:
(3)
Where: T is the threshold value, are the coordinates
of the threshold value point. Where are
gray levels of the image. Threshold image can be
defined as:
T
f(x,y)
if
T
f(x,y)
if
y
x
g
0
1
)
,
(
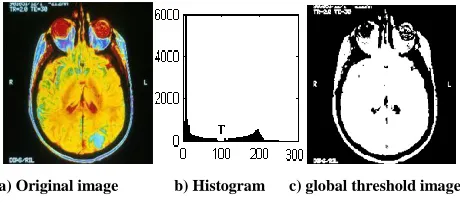
(4)An example of the global threshold selection and segmentation is given in the Figure 3. It can be seen that in this case the threshold can be selected easily as point of separating the background and object.
[image:3.612.329.559.404.507.2]a) Original image b) Histogram c) global threshold image
Figure 3 Example of global thresholding for weather cancer MRI brain image
The efficiency of the global thresholding depends on the efficiency of the threshold selection. But when the object and the background are not clearly separable and histogram is flat such as in CT scan images. Then global thresholding selection becomes difficult task. As shown in Figure 4 (b) below. The Figure 4 also gives the two different segmented images for three different thresholds. Thus adaptive threshold selection is required.
D.Otsu’sThresholding
The Otsu method [2, 4, and 18] is widely used thresholding based segmentation method which defines
within class variance he variance between class and
the total class variance . Then finding the optimal
International Journal of Emerging Technology and Advanced Engineering
Website: www.ijetae.com (ISSN 2250-2459,ISO 9001:2008 Certified Journal, Volume 4, Issue 10, October 2014)
549
Where
1 0 . 2 1 01 2 L
i iPi T
i P L
i T
T
(5)
0 1 1 , 0 0 , 2 1 0 1 0 2 W W t i Pi WW W
B
(6)
t
i iPi T W T T 0 . , 0 0 , 0 1 0 1
(7)
But this method needs initial pre processing for improving image quality and does not performs well for noisy images
a ) Original CT scan image b) Histogram of the image
c) Global threshold with T=50, d) threshold with T=100 Figure 4 Failure case of the global thresholding
III. PROPOSED METHODOLOGY
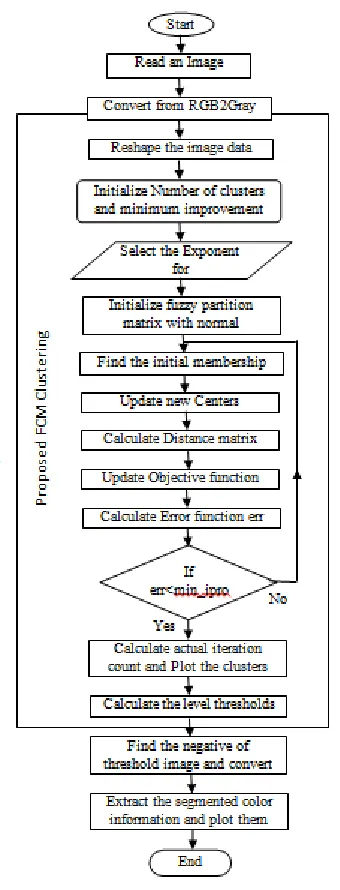
[image:4.612.59.274.275.479.2]In this paper the proposed 3-class FCM algorithm with thresholding. Clustering algorithm is used to segment the dark areas. The block diagram of the proposed segmentation method is shown in Figure 5.
Figure 5 Block diagram of proposed method
The clustering used because it gives a high level of understanding with the present number of data sets that do not have a common behavior between each other. The performance of FCM method is improved by modifying the initialization process of partitioning function. Proposed method also has flexibility of selecting the exponent of the fuzzy membership function. Usually the method of FCM with thresholding [21] generates logical (black and white) images. In the proposed method an improved FCM based logical output is used to extract the colour segment from the original image by negative masking. Flow chart of proposed segmentation method is given in the method is given in the Figure 6
Start
Read an Image
Convert from RGB2Gray
Reshape the image data
Initialize fuzzy partition matrix with normal
distribution Select the Exponent
for
Fuzzy partition matrix
Find the initial membership function
Calculate Distance matrix Update new Centers
Update Objective function Initialize Number of clusters
and minimum improvement min_ipro
If err<min_ipro Calculate Error function err
No
Yes
Calculate actual iteration count and Plot the clusters
Calculate the level thresholds
Find the negative of threshold image and convert
to gray matrix Extract the segmented color
information and plot them
End
Input Image
Pre-processing 3-Class FCM
Thresholding
Negative masking Colour Extraction using
matching
Output Image
International Journal of Emerging Technology and Advanced Engineering
Website: www.ijetae.com (ISSN 2250-2459,ISO 9001:2008 Certified Journal, Volume 4, Issue 10, October 2014)
[image:5.612.73.243.137.582.2]550
Figure 6 Flow chart of the proposed segmentation method
A.Proposed 3-Class FCM Clustering Algorithm
The ideal FCM method divides the image into clusters with every cluster having different centre. Each data point in the particular dataset belongs to each cluster up to a certain degree of extant. For example, consider a certain data point that lies closer to the centre of the cluster, it will have a high degree of belonging or membership to that cluster and the data point which lies far away from the cluster centre it will have a lower degree of belonging or membership to that cluster.
The proposed 3-Class FCM clustering algorithm is sequentially given as follows:-
1. Define the number of clusters , the total number of
data points given by and the minimum desired
improvement Randomly initialize the
initial fuzzy partition matrix Ui , and also define its
exponent Exp.
2. The initial estimate of fuzzy membership function is defined as product of initial fuzzy partition matrix and exponent as;
mf
U
i*
Exp
(8)3. Where, is the measured distance value between
object and cluster canters. In this paper it is defined as squared Euclidean distance given as;
d
ik(
d
k,
C
i)
d
k
C
i 2 (9)Compute the new membership function as;
1 2
1
E ik n ik
d
M
(10)4. The fuzzy objective function represents the distance from cluster centre to any data point weighted with the membership grades of that data point's. Calculate the objective cost function for FCM as;
2
1
)
,
,
(
ikQ
i N
j E ik n
n n
m
U
C
D
M
d
F
(11)Where, defines the new updated set of fuzzy
partition matrix, is the updated set
of clusters canters. And is
define as the image data set of the p dimensional vector
space. Where, is given as the degree of membership
corresponding to the data in the cluster, Exp is the exponent of membership function. Method calculates the distance matrix using the Euclidean distance between each row in centre and each row in data, and returns a distance matrix out of size M by N, where M and N are row dimensions of centre and data, respectively, and gives the output as distance between centre and data. Therefore equation (11) may be re written as;
2
1
i k cn
i N
j E ik
x
V
M
International Journal of Emerging Technology and Advanced Engineering
Website: www.ijetae.com (ISSN 2250-2459,ISO 9001:2008 Certified Journal, Volume 4, Issue 10, October 2014)
551 5. Calculate the cluster canter corresponding to the current
membership function as;
Nk ik i
u
D
mf
V
1
*
(13)
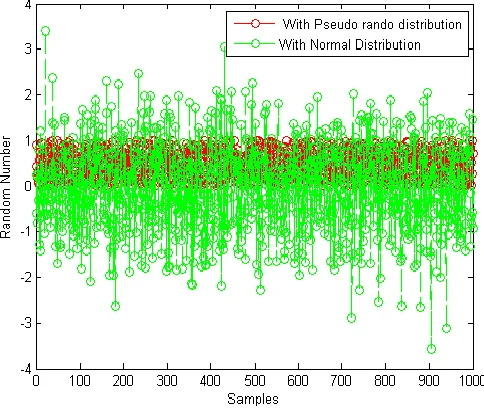
[image:6.612.343.543.248.457.2]FCM clustering method begins with an initial assumption for the cluster centers, which are usually to select the mean location of each cluster. For initial estimate of fuzzy partition matrix U, the uniform pseudo random generator is commonly used. But in our proposed method in order to speed up the iterations it is proposed to use the pseudo random generator with normal distribution. In terms of threshold selection Normal integer generator performs similar to the pseudo random generator but since it has a Gaussian distribution it generates the higher initial estimates for the fuzzy partition matrix as described briefly in the Figure 7.
Figure 7.Comparison of the Random number generators
B. Fuzzy Threshold Selection
In this paper fuzzy c means clustering is used based on thresholding. It works better than the standard Otsu method [3]. Fuzzy c means clustering the segmented part cannot be seen clearly. For that reasons, thresholding is applied to extract the segmented image portion. The threshold is calculated by taking the mean of maximum in the class with the smallest centre and the minimum in the class with the middle centre [1]. This can be thought as a trade-off between the local and the global features. The for the input choice fuzzy threshold are given as;
If
If
Thus proposed FCM method generates the two output
images correspond to each threshold level , and their
Performance is compared with the standard Otsu threshold method [3].
a) Original image b) FCM Cluster 1 c) FCM Cluster 2
[image:6.612.52.294.367.572.2]
d) FCM Cluster 3 e) Threshold with class 1-2 f) with class 2-3
Figure 8 Complete process of thresholding with 3 classes FCM for MRI Brain image
An example of 3 classes of FCM partitioned clusters and the respective threshold images are given in the Figure 8. It can be observed that each class represent the different features of the image. But since clustering based methods are sensitive to noise thus thresholding is used to improve the efficiency.
C.Colour Segment Extraction
As another improvement in this paper the segmented output of FCM method are used to generate the colour segmented results. Now in order to segment the colour segment first the logical output image of the FCM stage is inverted and the process is named as negative masking. The procedure of negative masking is as follows;
1. Find the maximum of the segmented output image.
(17)
International Journal of Emerging Technology and Advanced Engineering
Website: www.ijetae.com (ISSN 2250-2459,ISO 9001:2008 Certified Journal, Volume 4, Issue 10, October 2014)
552
(18)
3. Convert B from logical matrix to gray matrix. 4. Now extract the colour segment by using B as convolving mask. The colour segments are extracted individually in RGB colour spaces and then merged together. (19)
(20)
(21)
(22)
Where, represents the input true colour image and *
represents the convolution sign. S is the segmented image. Therefore, proposed method gives 8 fuzzy segmented images of the same object. Out of which four are logical images and rest are colour segments. Thus it helps doctors to identify the diseases better
IV. SIMULATION RESULTS
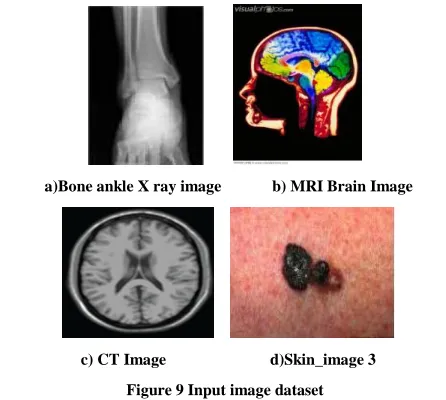
In this section some of simulation results for the 3 class FCM with thresholding are presented. The MATLAB used as platform for the implementation. Figure 9 shows the data base of input original medical images used for the performance evaluation in this paper.
.
All four images are acquired from different scanning techniques in variant environments. Therefore each input image is containing some unique features.
The MRI Brain scan image and Skin image 3 are the colour images with distinct features thus are used for representing the visual segmented results. For statistical evaluation all four images are considered.
a) b)
c) d)
[image:7.612.345.546.187.450.2]
e) f)
Figure 10 Results of proposed segmentation method for the Skin image 3 a) Original RGB image (b) Otsu level=0.650960 (c) FCM0,level=0.421569 (d) FCM1,level = 0.735294, e) Proposed colour
segmented image at the FCM0, f) Colour segmented image at the FCM1,
a) b)
c) d)
a)Bone ankle X ray image b) MRI Brain Image
[image:7.612.59.282.454.654.2]
c) CT Image d)Skin_image 3
International Journal of Emerging Technology and Advanced Engineering
Website: www.ijetae.com (ISSN 2250-2459,ISO 9001:2008 Certified Journal, Volume 4, Issue 10, October 2014)
553
[image:8.612.48.544.70.471.2]
e) f)
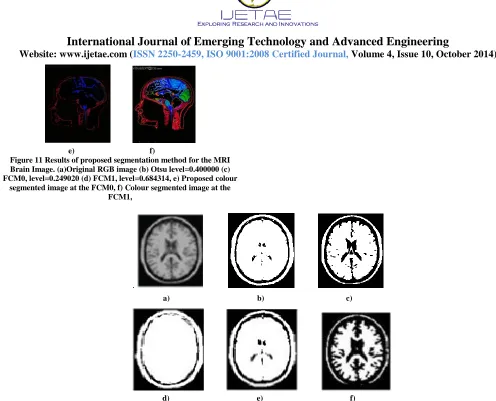
Figure 11 Results of proposed segmentation method for the MRI Brain Image. (a)Original RGB image (b) Otsu level=0.400000 (c) FCM0, level=0.249020 (d) FCM1, level=0.684314, e) Proposed colour
segmented image at the FCM0, f) Colour segmented image at the FCM1,
.
a) b) c)
[image:8.612.178.439.281.471.2]
d) e) f)
Figure 12 Comparison of the different thresholding based segmentation results for CT scan image a) Original gray level image b) Global threshold with T=50, c) threshold with T=100, d) Otsu level=0.313725 e) segmented with proposed method at the FCM0, level=0.225100 f) FCM1,
level=0.0507968
Segmentation results of the proposed colour segments with 3-class FCM are presented for each level of thresholding in Figure 10 for Skin image 3. The input RGB image is first converted to gray image and then the gray image is segmented using the 3-class FCM based thresholding. It can be seen that each threshold image contains different features. The object may sometimes belong to FCM level 0 or may belong to FCM level 1.
Since the threshold image is a logical image thus colour segmented images are generated from threshold images by using it as a matching mask on original image. Mostly the object is dark compared to background thus before matching a negative masking is used in such cases to convert the 0’s to 1’ in the threshold images. Figures 11 present the segmentation results for the MRI Brain image. The proposed colour segments with 3-class FCM are presented with respect to each level of thresholding.
In this case since the object is brighter than the background thus negative masking is not required and the color segments can be directly generated from the threshold results.
Figure 12 have compared the results of proposed 3-class FCM clustering with thresholding to the results of existing Otsu thresholding [4] method and Global thresholding [5] for the CT scan image.. It can be seen, that proposed method improves the threshold level significantly, thus contains the more information. And method also performs well where
International Journal of Emerging Technology and Advanced Engineering
Website: www.ijetae.com (ISSN 2250-2459,ISO 9001:2008 Certified Journal, Volume 4, Issue 10, October 2014)
554
TABLE 1
COMPARISON OF 3-CLASS FCM WITH THRESHOLDING
Image 3-Class FCM with Thresholding
Ostu FCM0 FCM1
Skin_3 0.650960 0.421569 0.735294
CT_Image 0.313725 0.225100 0.507968
MRI_Brain Image 0.400000 0.249020 0.684314
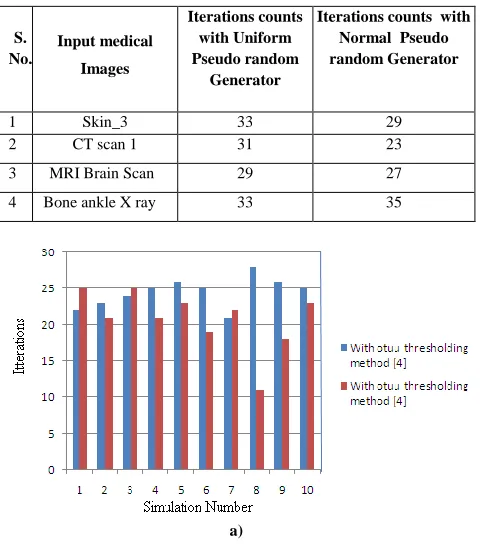
[image:9.612.322.561.115.438.2]The Table 2 shows that the use of normal pseudo random generation minimizes the number of iterations required to achieve optimized objective function without changing the threshold levels. This is because the normal distribution is a Gaussian distribution and is defined for entire range. Since the initial value of objective function is randomly generated thus the number of iterations is different every time the simulation is run.
TABLE 2
COMPARISON OF THE NUMBER OF ITERATIONS FOR TWO RANDOM INTEGER GENERATIONS
S. No.
Input medical Images
Iterations counts with Uniform Pseudo random
Generator
Iterations counts with Normal Pseudo random Generator
1 Skin_3 33 29
2 CT scan 1 31 23
3 MRI Brain Scan 29 27
4 Bone ankle X ray 33 35
a)
b)
[image:9.612.44.292.157.252.2]c)
Figure 13 Comparison of the number of iteration count for the FCM with Uniform and Normal random number generator
Therefore Figure 13 shows the comparison of iteration count for 10 individual simulations. It is observed from the both Figures that FCM with normal random generator reduces the iteration count.
The Table 3 shows the comparison of the segmentation with Euclidean distance and Chi square distances [19]. It is observed from Table 3, that FCM with Euclidean distance performs better in number of iterations except for Bone ankle X-ray image.
TABLE 3
COMPARISON OF THE ITERATION COUNT FOR FCM WITH DIFFRENT DISTANCE MEASURES
Particulars Skin_3 CT scan 1 MRI Brain
Scan Bone ankle X ray
With Chi Square Distance
33 32 68 30
With Euclidean
distance
[image:9.612.50.290.384.656.2]International Journal of Emerging Technology and Advanced Engineering
Website: www.ijetae.com (ISSN 2250-2459,ISO 9001:2008 Certified Journal, Volume 4, Issue 10, October 2014)
555 V. CONCLUSION
Efficient method of medical image segmentation is proposed which uses the 3-Class FCM with thresholding for image segmentation. As a modification the normal pseudorandom generator is used, which improves threshold for most of the cases except for Born Ankle X ray image with less numbers of gray levels. The colour segments are generated from the binary segments.
The performance of the proposed method is also compared with the FCM using Chi Square distance measure. It is observed that Chi square method is slower than the proposed Euclidean distance measure except for Born Ankle X-ray image. The proposed method improves the threshold level at the lesser computation cost. The colours of the segmented results are slightly shifted with respect to original image segment. In future the performance of the method can be improved for images with less colour variations such as X-ray images and optimization methods can be used for setting the exponent of partition adaptively.
Acknowledgment
I express my indebtedness and gratefulness to my guide Asst. Prof. R.R. Ahirwar and Dr. Yogendra Kumar Jain, Head – Department of Computer Science and Engineering for his continuous encouragement and guidance His intelligible conversations, patient listening and friendly behavior encouraged me to work with enthusiasm and honesty.
REFERENCES
[1] Fu, S.K.—Mui, J.K.: A Survey on Image Segmentation. Pattern Recognition, Vol. 13, 1981, pp. 3–16.
[2] Haralick, R.M.—Shapiro, L.G.: Image Segmentation Techniques. Comput. Vision Graphics Image Process. Vol. 29, 1985, pp. 100– 132.
[3] Pal, N.—Pal, S.: A Review on Image Segmentation Techniques. Pattern Recognition, Vol. 26, 1993, pp. 1277–1294.
[4] Jun Zhang , Jinglu Hu, ―Image Segmentation Based on 2D Otsu Method with Histogram Analysis―, Proc. of Int. conf. on computer science and software engineering, pp. 105-108 2008.
[5] Sos S. Agaian, Blair Silver, Karen Panetta,, “Transform Coefficient Histogram Based Image Enhancement Algorithms Using Contrast Entropy , IEEE Transaction on image processing, Vol. 16, NO. 3 2007.
[6] A. Daskalakis, D. Cavouras, P. Bougioukos, S Kostopoulos, and George Nikiforidis, ―An efficient CLAHE based, spot adaptive, image segmentation technique for improving microarray genes quantification‖, Proceeding. Of International conference on experiments process system modeling/simulation & optimization pp. 4-7, July, 2007
[7] Santiago A. Fernandez, G. Vegas, Miguel, ―Soft thresholding for medical image segmentation. 32nd Annual International Conference of the IEEE EMBS Buenos Aires, Argentina, September, 2010 [8] B. Silver, S. S. Agaian, and K. A. Panetta, ―Contrast entropy based
image enhancement and logarithmic transform coefficient histogram shifting, presented‖, IEEE ICASSP, Mar. 2005.
[9] D. D. Patil1, S. G. DeoreI., ―Medical image segmentation a review‖, International Journal of Computer Science and Mobile Computing, Vol. 2, Issue 1, pp.22 – 27 January 2013.
[10] Wahba Marian, ―An Automated Modified Region Growing Technique for Prostate Segmentation in Trans-Rectal Ultrasound Images‖, Master’s Thesis, Department. of Electrical and Computer Engineering, University of Waterloo, Waterloo, Ontario, Canada, 2008.
[11] Omid Jamshidi and Abdol Hamid Pilevar, ―Automatic Segmentation of Medical Images Using Fuzzy c-Means and the Genetic Algorithm‖,Journal of Computational Medicine, Volume 2013 pp 1-7 (2013).
[12] G. Gajanayake, R. D. Yapal, B. Hewawithana' ―Comparison of standard image segmentation methods for segmentation of brain tumors from 2D MR images‖, IEEE fourth International Conference, ICIIS,pp. 301-305 2009
[13] Krishna Mohanta, V.Khanaa, ―An efficient contrast enhancement of medical X-Ray images adaptive region growing approach‖, International Journal of engineering and computer science Vol. 2 Issue 2, pp. 386-390 2013
[14] H. G. Kaganami, Z. Beij,―Region Based Detection versus Edge Detection‖, IEEE Transactions on Intelligent information hiding and multimedia signal processing, pp. 1217-1221, 2009
[15] H. P. Ng, S.H. Ong K.W.C. Foongi, ―Medical image segmentation using k-means clustering and improved watershed algorithm‖ Proc. of IEEE Southwest Symposium on Image Analysis and Interpretation pp. 61-65 2006.
[16] M.C. J. Christ, R.M.S. Parvathi., ―Segmentation of medical image using clustering and watershed algorithms‖, American Journal of Applied Sciences 8 (12) pp. 1349-1352, 2011
[17] Dr.G.Padmavathi, Mr.M.Muthukumar and Mr. Suresh Kumar Thakur, ―Non linear Image segmentation using fuzzy c means clustering method with thresholding for underwater images‖, IJCSI International Journal of Computer Science Issues, Vol. 7, Issue 3, No 9, May 2010.
[18] V.Radhika, G. Padmavathy , ― Segmentation of oil spills in sar image using fusion technique‖, International journal of advanced engineering sciences and technologies Vol. 10, Issue 1, pp, 154 – 159, 2011
[19] O. A. Mohamed Jafar, R. Sivakumar ―A Comparative Study of Hard and Fuzzy Data Clustering Algorithms with Cluster Validity Indices‖, Proc. of International Conference, ERCICA pp. 775-782, 2013
[20] Guanglei Xiong, Xiaobo Zhou, Liang Ji, ―Automated Segmentation of Drosophila RNAi Fluorescence Cellular Images Using Deformable Models‖, IEEE Transactions on Circuits and Systems— I: regular papers, Vol. 53, No. 11, pp. 2415-2424. 2006
International Journal of Emerging Technology and Advanced Engineering
Website: www.ijetae.com (ISSN 2250-2459,ISO 9001:2008 Certified Journal, Volume 4, Issue 10, October 2014)
556 AUTHORS
Sunil Kumar has done Diploma (First) in Computer Science & Engineering from SATI Vidisha (M.P) India in 2005. After received diploma I received my Bachelor Degree (First) in computer science & Engineering from JNCT Bhopal University RGPV Bhopal in 2009 and currently I am pursuing M. Tech from SATI Vidisha (M.P), India in Computer Science & Engineering.
Mr. Ram Ratan Ahirwal has received his B.E.(First) degree in Computer Science & Engineering from GEC Bhopal University RGPV Bhopal in 2002. During 2003, August he joined Samrat Ashok Technological Institute Vidisha (M. P.) as a lecturer in computer Science & engg. Dept. and complete his M.Tech Degree (with hons.) as sponsored candidate in CSE from SATI (Engg. College), Vidisha University RGPV Bhopal, (M.P) India in 2009.Currently he is working as assistant professor in CSE dept., SATI Vidisha. He has more than 12 publications in various referred international journal and in international conferences to his credit. His areas of interests are data mining, image processing, computer network, network security and natural language processing.
![Figure 1 Basic process of segmentation [21]](https://thumb-us.123doks.com/thumbv2/123dok_us/8708265.881265/1.612.338.550.336.398/figure-basic-process-of-segmentation.webp)