© 2016, IRJET ISO 9001:2008 Certified Journal Page 2624
OF RC STRUCTURE SITUATED IN DIFFERENT SEISMIC ZONES OF INDIA
Md Rizwan
1, Dr. M. D. Vijayanand
21Post Graduate Student in Structural Engineering, BIET College, Davanagere-577004, India 2Professor and PG Co-Ordinator, PG program M.Tech Structural Engineering, BIET College, Davanagere
---***---Abstract -
The G+14 multi story irregular building is takenfor present study. This building is modelled and analysed by using ETABS V9.7.4. Assuming the material property as linear and non linear. This building is analysed by considering all Indian seismic zones. For each zone three types of soil is taken and analysed (i.e. hard soil, medium soil and soft soil). The analysis is done by equivalent static analysis and pushover analysis. The performance of the building is studied by comparing the base shear, displacement, story drift in both analyses.
Key words: Asymmetric building, Equivalent Static Analysis,
Pushover Analysis ETABS.
1. INTRODUCTION
The main objectives of structural designer under the seismic loads are the safety of the building under severe earthquake. To design the structure under seismic loads it is required to know the performance of buildings under inelastic deformation. Now a day in metro cities many tall residential buildings are constructed asymmetric in plan and asymmetric in elevation. So these buildings are more vulnerable under the action of earthquake. For the investigation of earthquake these buildings becomes complex for analysis. We can get the accurate performance MDOF structures by using non linear time history analysis. But in day to day or everyday design of building in this method is not practical because it consume more time. In such situation performance of structure under seismic can be estimated by using the pushover analysis. Many of the designer use linear static method for earthquake analysis. This method couldn’t give proper results. Hence it is necessary to know the error of performance of building in both the methods of analysis and is carried out with different zones and soil properties.
1.1 OBJECTIVES
The target of the current study is as follows
1. To look at the base shear of the structure which is situated in various Indian seismic zones with various soil types.
2. To compare the displacements of the structure which is located in different Indian earthquake zones with different soil types.
3. To compare the story drift of the structure which is located in different Indian seismic zones with different soil types.
2. BUILDING DESCRIPTION
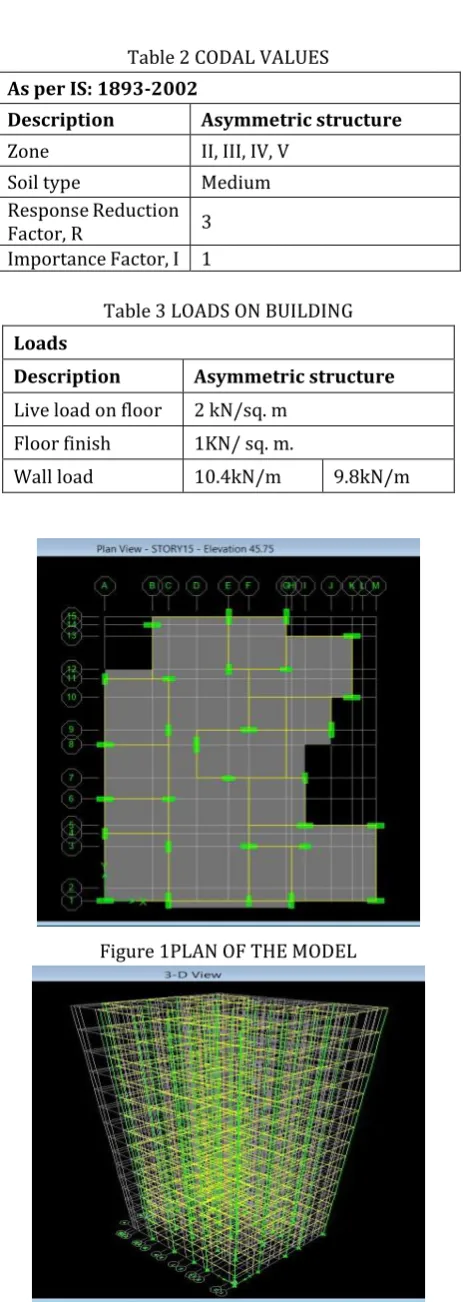
[image:1.595.314.557.584.775.2]The scope of the present thesis is to study the behaviour of asymmetric RC structure located in different Indian seismic zones and different soil types. The performance of building is concentrated by base shear, lateral displacement and story drift by using Equivalent static analysis (ESA) and Pushover analysis (PA). These analysis were carried out according to IS 1893:2002, ATC-40. The model of present study is created and analysed in ETABS version 9.7.4 software.
Table 1 GENERAL DESCRIPTION OF BUILDING
Description Asymmetric structure
Type of structure Residential Building
No. of stories 15(G+14)
Height of building 45.75m
Column size (300X700)mm (300X1000)mm
Beam size (230X450)mm (230X600)mm
Slab thickness 125mm
Height of the floor 3.05m
Concrete grade for
Columns M45
Concrete grade for Beams
and Slab M25
© 2016, IRJET ISO 9001:2008 Certified Journal Page 2625 Table 2 CODAL VALUES
As per IS: 1893-2002
Description Asymmetric structure
Zone II, III, IV, V
Soil type Medium
Response Reduction
Factor, R 3
Importance Factor, I 1
Table 3 LOADS ON BUILDING Loads
Description Asymmetric structure
Live load on floor 2 kN/sq. m
Floor finish 1KN/ sq. m.
Wall load 10.4kN/m 9.8kN/m
Figure 1PLAN OF THE MODEL
Figure 2 Elevation of the Model
2.1 MODEL LABELS:
Z2S2 = zone–II and soil type-II
Z3S2= zone–III and soil type-II
Z4S2= zone–IV and soil type-II
Z5S2= zone–V and soil type-II
2.2 PROCEDURE OF MODELLING AND ANALYSIS.
2.2.1 CREATING MODEL FOR NON LINEAR STATIC ANALYSIS
In ETABS v9.7.4 the model is developed. Columns, beams and slab are modeled as 3D frame element. After the modeling a non linear load combinations are defined in software. The next work is to assign the hinges. In current study hinges are assign for beams and columns only. Hinges may be assign as many numbers as we can in software. These hinges are along the frame element. In current study, hinges for beams are assign at start, middle and end of the beam elements. For column start and end of element assign. The hinges in software will take automatically at their relative distance of structure elements. Default plastic is available in software. These default hinges are as per ATC-40.
2.2.2 PUSHOVER ANALYSIS PROCEDURE
The procedure for pushover analysis used for the present study is as follows.
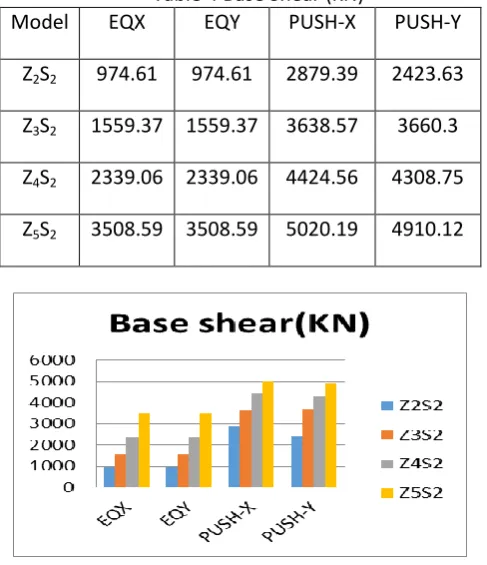
© 2016, IRJET ISO 9001:2008 Certified Journal Page 2626 pushover analysis is carried out. Pushover analysis
[image:3.595.311.557.100.365.2]gives capacitive curve, performance point. Table 4 Base Shear (KN)
Model EQX EQY PUSH-X PUSH-Y
Z2S2 974.61 974.61 2879.39 2423.63
Z3S2 1559.37 1559.37 3638.57 3660.3
Z4S2 2339.06 2339.06 4424.56 4308.75
Z5S2 3508.59 3508.59 5020.19 4910.12
[image:3.595.41.285.148.431.2]Fig 3: Base Shear
Tabel 5 Displacement in x direction by ESA
Story Z2S2 Z3S2 Z4S2 Z5S2
15 0.0745 0.1142 0.167 0.2462
14 0.0715 0.1097 0.1607 0.2371
13 0.068 0.1044 0.1531 0.226
12 0.0638 0.0981 0.144 0.2127
11 0.059 0.0909 0.1335 0.1974
10 0.0537 0.0829 0.1219 0.1803
9 0.0481 0.0743 0.1093 0.1618
8 0.0421 0.0652 0.0959 0.1421
7 0.036 0.0558 0.0821 0.1216
6 0.0298 0.0461 0.068 0.1007
5 0.0235 0.0365 0.0538 0.0797
4 0.0174 0.027 0.0398 0.0591
3 0.0115 0.0179 0.0264 0.0392
2 0.0062 0.0096 0.0142 0.0211
1 0.0019 0.003 0.0045 0.0067
Table 6 Displacement in Y direction by ESA
15 0.0622 0.0981 0.146 0.2178
14 0.0603 0.0952 0.1416 0.2112
13 0.0577 0.0911 0.1356 0.2023
12 0.0545 0.0861 0.1281 0.1912
11 0.0508 0.0802 0.1193 0.1781
10 0.0466 0.0735 0.1094 0.1633
9 0.0419 0.0662 0.0986 0.1472
8 0.037 0.0585 0.0871 0.1299
7 0.0319 0.0504 0.075 0.1119
6 0.0266 0.0421 0.0626 0.0935
5 0.0213 0.0337 0.0501 0.0748
4 0.016 0.0253 0.0377 0.0562
3 0.0109 0.0172 0.0255 0.0381
2 0.006 0.0095 0.0142 0.0212
1 0.002 0.0032 0.0047 0.007
Table 7 Displacement in X direction by NSA
Story Z2S2 Z3S2 Z4S2 Z5S2
15 0.2906 0.2908 0.3297 0.3613
14 0.2789 0.2836 0.3201 0.3501
13 0.2655 0.2745 0.3082 0.3367
12 0.2498 0.2624 0.2935 0.3206
11 0.2317 0.2468 0.2758 0.302
10 0.2113 0.2275 0.2551 0.2809
9 0.1888 0.2048 0.2318 0.2574
8 0.1647 0.1793 0.2061 0.2311
7 0.1395 0.1517 0.1786 0.2019
6 0.1139 0.123 0.1497 0.1704
5 0.0887 0.0943 0.1201 0.1374
4 0.0645 0.0669 0.0903 0.1037
3 0.0423 0.042 0.0614 0.0706
2 0.023 0.0213 0.0347 0.0397
[image:3.595.310.553.394.665.2]1 0.0081 0.0064 0.0124 0.0139
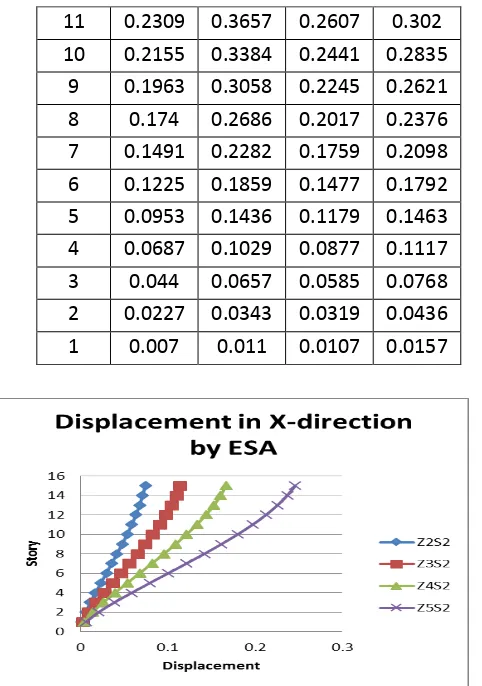
Table 8 Displacement in Y direction by NSA
Story Z2S2 Z3S2 Z4S2 Z5S2
15 0.2612 0.4206 0.3004 0.3493
14 0.2572 0.4137 0.2943 0.3415
13 0.2512 0.4029 0.2857 0.3309
[image:3.595.40.554.414.783.2]© 2016, IRJET ISO 9001:2008 Certified Journal Page 2627
11 0.2309 0.3657 0.2607 0.302
10 0.2155 0.3384 0.2441 0.2835
9 0.1963 0.3058 0.2245 0.2621
8 0.174 0.2686 0.2017 0.2376
7 0.1491 0.2282 0.1759 0.2098
6 0.1225 0.1859 0.1477 0.1792
5 0.0953 0.1436 0.1179 0.1463
4 0.0687 0.1029 0.0877 0.1117
3 0.044 0.0657 0.0585 0.0768
2 0.0227 0.0343 0.0319 0.0436
1 0.007 0.011 0.0107 0.0157
[image:4.595.40.556.55.759.2]Fig 4 Displacement in X direction by ESA
[image:4.595.37.278.96.439.2]Fig 5 Displacement in Y direction by ESA
Fig 6 Displacement in X direction by NSA
[image:4.595.306.559.289.416.2]Fig 7 Displacement in Y direction by NSA
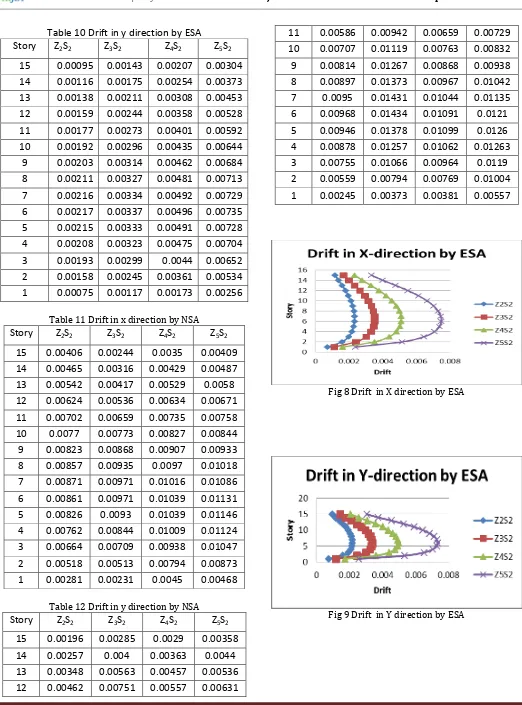
Table 9 Drift in X direction by ESA
Story Z2S2 Z3S2 Z4S2 Z5S2
15 0.00116 0.00166 0.00232 0.00332
14 0.00137 0.00197 0.00278 0.00399
13 0.00159 0.00232 0.00329 0.00476
12 0.00179 0.00264 0.00378 0.00548
11 0.00196 0.00292 0.0042 0.00611
10 0.0021 0.00315 0.00454 0.00663
9 0.00221 0.00332 0.0048 0.00702
8 0.00228 0.00343 0.00498 0.00729
7 0.00231 0.0035 0.00508 0.00745
6 0.00231 0.0035 0.0051 0.00748
5 0.00227 0.00345 0.00502 0.00737
4 0.00217 0.0033 0.00481 0.00708
3 0.00197 0.00301 0.00438 0.00645
2 0.00157 0.0024 0.0035 0.00515
[image:4.595.303.558.493.775.2]© 2016, IRJET ISO 9001:2008 Certified Journal Page 2628
Story Z2S2 Z3S2 Z4S2 Z5S2
15 0.00095 0.00143 0.00207 0.00304
14 0.00116 0.00175 0.00254 0.00373
13 0.00138 0.00211 0.00308 0.00453
12 0.00159 0.00244 0.00358 0.00528
11 0.00177 0.00273 0.00401 0.00592
10 0.00192 0.00296 0.00435 0.00644
9 0.00203 0.00314 0.00462 0.00684
8 0.00211 0.00327 0.00481 0.00713
7 0.00216 0.00334 0.00492 0.00729
6 0.00217 0.00337 0.00496 0.00735
5 0.00215 0.00333 0.00491 0.00728
4 0.00208 0.00323 0.00475 0.00704
3 0.00193 0.00299 0.0044 0.00652
2 0.00158 0.00245 0.00361 0.00534
1 0.00075 0.00117 0.00173 0.00256
Table 11 Drift in x direction by NSA
Story Z2S2 Z3S2 Z4S2 Z5S2
15 0.00406 0.00244 0.0035 0.00409
14 0.00465 0.00316 0.00429 0.00487
13 0.00542 0.00417 0.00529 0.0058
12 0.00624 0.00536 0.00634 0.00671
11 0.00702 0.00659 0.00735 0.00758
10 0.0077 0.00773 0.00827 0.00844
9 0.00823 0.00868 0.00907 0.00933
8 0.00857 0.00935 0.0097 0.01018
7 0.00871 0.00971 0.01016 0.01086
6 0.00861 0.00971 0.01039 0.01131
5 0.00826 0.0093 0.01039 0.01146
4 0.00762 0.00844 0.01009 0.01124
3 0.00664 0.00709 0.00938 0.01047
2 0.00518 0.00513 0.00794 0.00873
1 0.00281 0.00231 0.0045 0.00468
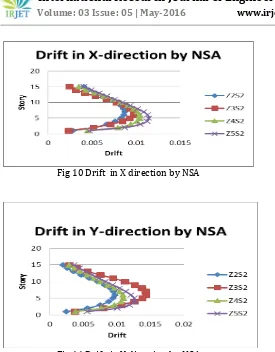
Table 12 Drift in y direction by NSA
Story Z2S2 Z3S2 Z4S2 Z5S2
15 0.00196 0.00285 0.0029 0.00358
14 0.00257 0.004 0.00363 0.0044
13 0.00348 0.00563 0.00457 0.00536
12 0.00462 0.00751 0.00557 0.00631
10 0.00707 0.01119 0.00763 0.00832
9 0.00814 0.01267 0.00868 0.00938
8 0.00897 0.01373 0.00967 0.01042
7 0.0095 0.01431 0.01044 0.01135
6 0.00968 0.01434 0.01091 0.0121
5 0.00946 0.01378 0.01099 0.0126
4 0.00878 0.01257 0.01062 0.01263
3 0.00755 0.01066 0.00964 0.0119
2 0.00559 0.00794 0.00769 0.01004
[image:5.595.37.559.74.779.2]1 0.00245 0.00373 0.00381 0.00557
Fig 8 Drift in X direction by ESA
[image:5.595.306.559.97.480.2]© 2016, IRJET ISO 9001:2008 Certified Journal Page 2629 Fig 10 Drift in X direction by NSA
Fig 11 Drift in Y direction by NSA
3. CONCLUSIONS
On the basis of present study following conclusions are drawn
1. It is found, the total lateral load carrying capacity of the structures are higher in the both the directions, when non linear strength of the materials is considered. The asymmetry of the structure has very less influence in this. 2. The lateral deformation capacity of the each
storey is gradually decreasing from top to bottom in the type of analysis but it is found to be higher in case of non linear static analysis. 3. The lateral deformation capacity of the
symmetric structure is found to be higher than that of asymmetric structure. As the asymmetry of the structure is increasing, the lateral deformation capacity is decreasing. 4. Storey drift is gradually increasing from
bottom to middle storey and from middle storey it gradually decreasing to top storey. 5. The building shows less performance point in
loose soil.
REFERENCES
1. Bahadar Bagheri (2012), “Comparative Study of Static and Dynamic Analysis of Multi-storey Irregular Building”. World Academy of Science, Engineering and Technology Vol:6 (2012-11-27).
2. Gursale Mrunmayi and Patil P. S, (2015) “ Comparative Parametric Study Of Linear And Nonlinear Behavior Of Multistory Structures”, International Journal of Research in Engineering and Technology, Volume: 04 Issue.
3. Arvindreddy, R.J.Fernandes,(2015), “Seismic Analysis Of RC Regular And Irregular Frame Structures”. International Research Journal of Engineering and Technology (IRJET), Aug-2015.
4. Rajesh B et al (2015), “Comparision Of Both Linear Static And Dynamic Analysis Of Multistoryed Buildings With Plan Irregularities”. International Journal of Scientific Engineering and Applied Science-October-2015.
5. Monish S and Karuna S(2015), “ A Study On Seismic Performance Of High Rise Irregular Rc Framed Buildings”. IJRET.
6. Mohammed Irfan, Dr. Sunandan Reddy, K.Mythili(2014), Evaluation of Seismic Response of symmetric and Asymmetric Multistoried Buildings. International Journal of Science Engineering and Advance Technology.
7. Umesh.R.Biradar and Shivaraj Mangalgi(2014), “ Seismic Response Of Reinforced Concrete Structure By Using Different Bracing Systems”. International Journal of Research in Engineering and Technology.
8. Imane Djafar Henni et al(2014), “Nonlinear Analysis Of The Seismic Response Of A Reinforced Concrete Structure Built In High Seismic Region In Algeria”. Journal of Geological Resource and Engineering.
© 2016, IRJET ISO 9001:2008 Certified Journal Page 2630 of Civil Engineering and Technology.
10.yousuf Mohammed and shimpale P.M(Sep-2013), “ Dynamic Analysis Of Reinforced Concrete Building With Plan Irregularities”. International Journal of Emerging Technology and Advanced Engineering.
BIOGRAPHIES
Md Rizwan
Post Graduate Student Dept. of Civil Engineering BIET College, Davanagere.
Dr. M D Vijayananda