IJPSR (2017), Vol. 8, Issue 2 (Research Article)
Received on 30 July, 2016; received in revised form, 04 October, 2016; accepted, 19 October, 2016; published 01 February, 201 7
DEVELOPMENT AND VALIDATION OF STABILITY INDICATING RP-HPLC METHOD FOR TENOFOVIR SOLID LIPID NANOPARTICLES
Vasanti M. Suvarna 1, 2 and Preeti C. Sangave *1
Department of Pharmaceutical Chemistry 1, Shobhaben Pratapbhai Patel School of Pharmacy and
Technology Management, SVKM’s NMIMS, V.L. Mehta Road, Vile Parle (West) Mumbai 400 056, Maharashtra, India.
Department of Pharmaceutical Chemistry and Quality Assurance 2, SVKM’s Dr. Bhanuben Nanavati
College of Pharmacy, V.L. Mehta Road, Vile Parle (West) Mumbai 400 056, Maharashtra, India.
ABSTRACT: Tenofovirdisoproxilfumarate (TDF) is an essential component of highly active antiretroviral therapy (HAART) for HIV infection used in the treatment of human immunodeficiency virus (HIV) Type-1 patients. A stability-indicating HPLC method for the determination of TDF in solid-lipid nanoparticles was developed and validated. Chromatographic analysis was performed in a Agilent 1260 Infinity series, equipped with Waters Reliant™ C18 column, (USA) (250mm long, 4.6mm internal diameter, particle size 5µm), using a mobile phase composed of an aqueous phase (20mM KH2PO4) pH 2.4 and acetonitrile in the (50:50) ratio, at 1.0ml/min flow rate and injection volume of 20μl. Under the conditions established, the method demonstrated to be specific, without interference from formulation excipients, stability- indicating, linear (r2 = 0.9977) in the concentration range of 10.0 to 60.0μg/ml, precise (RSD=0.462), accurate (99.12%-100.76% of mean recovery) and robust. The TDF sample showed degradation under acid, base, oxidative, photolytic and dry heat stress conditions. The drug content of the solid lipid nanoparticle formulation when analyzed by the proposed method was found to be 98.92%.
INTRODUCTION: Tenofovirdisoproxilfumarate (TDF), is a bis-ester prodrug of the acyclic nucleoside phosphonate tenofovir (TFV). TDF is
an essential component of highly active
antiretroviral therapy (HAART) for HIV infection.
1
TDF is first hydrolyzed by carboxylesterase in the intestinal walls and subsequently hydrolyzed by phosphodiesterase during its first passage through
the liver to diphosphate. 2
QUICK RESPONSE CODE
DOI:
10.13040/IJPSR.0975-8232.8(2).658-66
Article can be accessed online on: www.ijpsr.com
DOI link: http://dx.doi.org/10.13040/IJPSR.0975-8232.8 (2).658-66
This diphosphate inhibits the DNA synthesis of HIV through competitive inhibition of reverse transcriptase and incorporation into viral DNA.
TDF structure is shown in Fig. 1.
FIG. 1: CHEMICAL STRUCTURE OF TENOFOVIR DISOPROXIL FUMARATE
Keywords:
Antiretroviral, HPLC, Indicating, tenofovirdisoproxilfumarate,
Solid-lipid Nanoparticles Correspondence to Author: Dr. Preeti C. Sangave
Associate Professor,
Department of Pharmaceutical Chemistry, Shobhaben Pratapbhai Patel School of Pharmacy and Technology Management, SVKM’s NMIMS, V.L. Mehta Road, Vile Parle (West) Mumbai 400 056, Maharashtra, India.
[image:1.612.312.565.575.706.2]Literature review reveals that several methods have been reported for the estimation of TDF in tablets,
using HPLC methods, 3-15 spectroscopic methods,
16
LC-MS. 17 HPLC is a preferred versatile
technique because of its wide suitability and availability. So far, to our present knowledge, no method is reported for TDF determination in
nanoparticulate systems like solid- lipid
nanoparticles.
As newer drug delivery systems like Tenofovir nanoparticle formulations are evolving there is a need to develop a simple method with high selectivity which can be applied to solid lipid nanoparticle formulation. The aim of the present work was to develop a stability indicating HPLC method for determination of TDF in bulk drug and in solid-lipid nanoparticles and separate the drug from the degradation products.
MATERIALS AND METHODS: Chemicals and reagents:
Tenofovirdisoproxilfumarate was received as a kind gift sample from Cipla Ltd. (Mumbai, India). HPLC grade acetonitrile and potassium dihydrogen
phosphate (KH2PO4), orthophosphoric acid,
hydrochloric acid, sodium hydroxide and hydrogen peroxide ofanalytical grade were procured from S. D. Fine chemicals Ltd.(Mumbai, India). Milli-Q water purification system from Millipore®(MA, USA) was used to obtain high quality HPLC grade water for entire study.Millipore ® filter membrane (0.45µm) was used to filter the buffer of the mobile phase.
Year of Experiment: 2015
Instrumentation and conditions:
Chromatographic study: The HPLC system consisted of Agilent 1260 Infinity series (Agilent, USA), fitted with a Waters Reliant™
HPLC-C18column, (USA) (250mm long, 4.6mm internal
diameter, particle size 5µm). It consisted of DEAB 711251 quaternary solvent pump, DEAB711251 on-line degasser, DEAAC28514 auto-injector and DEA- AX 06308 Photo Diode Array (PDA) detector. Open Lab software was used for mathematical computations and data acquisition. Ambient temperature was used for performing the analysis. The isocratic mobile phase consisted of an
aqueous phase (20mM KH2PO4) pH 2.4 and
acetonitrile in the (50:50) ratio. Detections of TDF were done at 260nm wavelength with flow rate of 1ml/min of mobile phase. The proposed method was optimized for an injection volume of 20µl.
For Stress Study: High-precision heating mantel (Remi, India) was used for generating hydrolytic degradation products. The thermal degradation study was performed using a high precision hot-air
oven (Metalab Scientific, India).Photolytic
degradation was carried out using UV cabinet. Oscar ultrasonic cleaner sonicator was used for sonication.
Preparation of standard solutions: Amount equivalent to 10mg of TDF was accurately weighed and dissolved in 5ml of (70:30) methanol: water mixture in 10ml volumetric flask (1mg/ml) with sonication for 10min. It was diluted to 10 ml with methanol: water mixture. Subsequent dilutions were done by using mobile phase as diluent to
obtain concentrations of 10g/ml, 20g/ml,
30g/ml, 40g/ml, 50g/ml and 60g/ml. Mobile
phase was used as blank solution.
Forced degradation studies: To provide an indication of the stability-indicating ability and specificity of the proposed method forced degradation studies were performed. Acidic, alkaline, neutral, oxidative, thermal and photolytic degradation studies were conducted on TDF.
Acidic degradation: Accurately weighed 10mg of TDF sample was mixed with 10ml of 0.1N HCl in a 100ml round bottom flask and refluxed for 30min. The solution was neutralized with 0.1NNaOH. Then this solution was quantitatively transferred to 50ml volumetric flask and diluted with methanol. From this solution 0.5ml was pipetted and transferred to 10ml volumetric flask and diluted with mobile phase.
Oxidative degradation: Accurately weighed 10mg of TDF sample was mixed with 10ml of 10%v/v
H2O2 in a 100ml round bottom flask and kept at
room temperature for 10min. Then this solution was quantitatively transferred to 50ml volumetric flask and diluted with methanol. From this solution 0.5ml was pipetted and transferred to 10ml volumetric flask and diluted to 10ml with mobile phase.
Neutral degradation: To study the degradation behaviour of drug in neutral conditions, accurately weighed 10mg of TDF sample was mixed with 10ml of distilled water in a 100ml round bottom flask and refluxed for 24 h. Then this solution was quantitatively transferred to 50ml volumetric flask and diluted with methanol. From this solution 0.5ml was pipetted and transferred to 10ml volumetric flask and diluted to 10ml with mobile phase.
Dry heat degradation: To study dry-heat degradation 10mg standard drug as powder was
placed in an oven at 60C for 24h. Then this
powder was quantitatively transferred to 50ml volumetric flask and diluted with methanol. From this solution 0.5ml was pipetted and transferred to 10ml volumetric flask and diluted to 10ml with mobile phase.
Photolytic degradation: To study photo degradation 10mg standard drug as powder was placed in an UV cabinet for8h. Then this powder was quantitatively transferred to 50ml volumetric flask and diluted with methanol. From this solution 0.5ml was pipetted and transferred to 10ml volumetric flask and diluted to 10ml with mobile phase.
Analytical Method validation:
Specificity: Mobile phase along with placebo (excipients present in nanoparticle formulation other than the drug) were injected to check the interference at the retention time of TDF in the above mentioned chromatographic condition.
System suitability: System-suitability tests are an integral part of method development and are used
to ensure adequate performance of the
chromatographic system. Retention time (RT), number of theoretical plates (N), tailing factor (T)
were evaluated for six replicate injections of the drug at a concentration of 30μg/ml.
Test solution stability: The test solution stability of TDF for the assay method was conducted by keeping the drug solution in tightly capped volumetric flasks at room temperature for 24h. The same sample solutions were assayed at 6h intervals up to the study period. The percentage recovery of assay of TDF was calculated for the study period during solution stability experiments.
Precision: The intraday precision of the assay method was evaluated by conducting six replicate
injections of TDF standard solution. The
percentage of relative standard deviation (RSD) was calculated for the concentration of the TDF obtained from six replicate injections. For interday precision under the same experimental conditions the TDF samples were prepared and injected on different days and percent RSD was calculated.
Linearity: The linearity of an analytical procedure is its ability (within a given range) to obtain test results that are directly proportional to the concentration of the analyte in the sample. Linearity test solutions for the assay method were prepared from a stock solution at six concentrations in the range from 10μg/ml to 60μg/ml. Regression analysis was performed by least-squares using the peak area versus concentration data.
Accuracy and recovery: Accuracy was determined by recovery studies of TDF known amount of standard was added to the preanalyzed sample and subjected to the proposed HPLC analysis. The study was done at three different concentration levels.
Analysis of solid lipid nanoparticle formulation:
An amount of solid lipid nanoparticle formulation equivalent to 30mg of TDF was taken in a 100ml volumetric flask. organic solvent comprising of 1:1 ratio of acetonitrile and methanol of volume 6ml of was added to dissolve lipid of formulation, sonicated in sonicator for 15min. 15ml of mobile phase was added and the mixture was vortexed for 5 min, then volume was made up to 100ml with mobile phase. The sample was filtered using
0.45m syringe filter and 1ml of solution was
diluted to 10ml in volumetric flask with mobile phase and injected into the HPLC system. The percentage content of TDF was calculated by using the regression equation. Three determinations were performed.
RESULTS AND DISCUSSION:
Method development and optimization: The primary criteria for the development of HPLC method for the assay of TDF was that the method should be able to separate degradants of forced degradation study within a shorter run time and
should be accurate, reproducible, robust and
stability-indicating. Accordingly the primary
objective of the chromatographic method was to achieve a better peak shape with mobile phases containing water and buffers like phosphate and using organic modifiers like acetonitrile in the mobile phase. Phosphate buffers with different concentrations were tried out and 20mM buffer strength was selected. Lower pH 2.4 resulted in better peak shape and symmetry. The best chromatographic output was achieved on a Waters
Reliant C18 column (USA) (250mm long, 4.6mm
internal diameter, particle size 5µm).
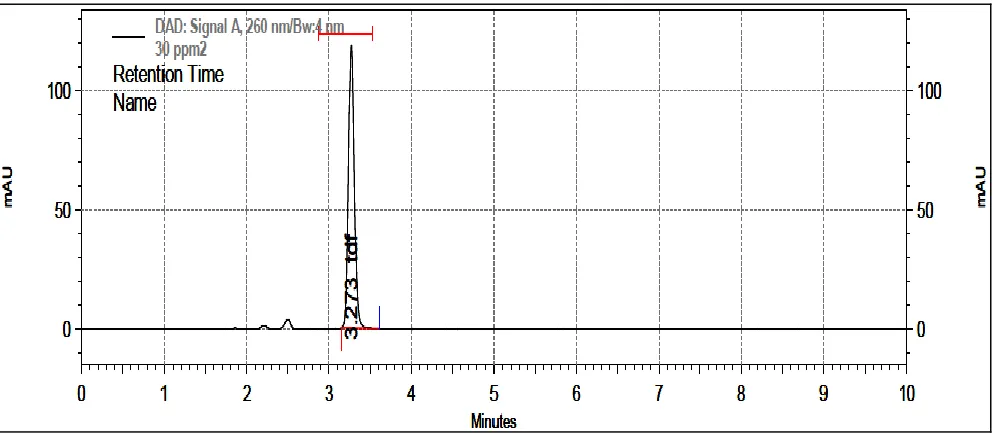
The monitored system suitability parameters were USP tailing factor and system precision. Various compositions were tried out and the retention time of around3.2min was found to be ideal with no interference at 50:50ratios. The USP tailing factor for the TDF peak was not more than 2.0 and the RSD for the peak area of six replicate injections of standard solution of TDF was not more than 1.0 as
[image:4.612.59.557.504.721.2]mentioned in Table 1.
TABLE 1: SYSTEM SUITABILITY PARAMETERS
Parameters Acceptance Criteria 18
Tailing factor 1.10 < 2.0
Theoretical plates 9623 > 2000
% RSD of 6 injections (peak areas) 0.623 < 2.0 % RSD of 6 injections (retention times) 0.66 < 1.0
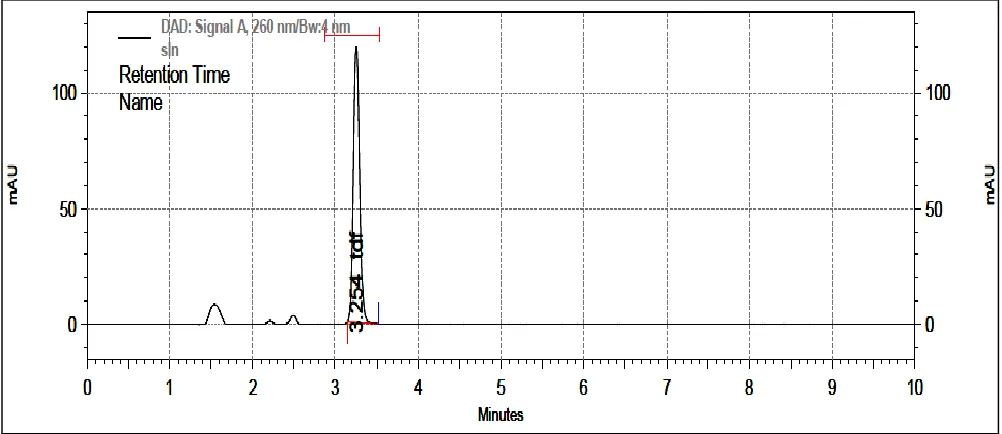
Typical chromatograms of TDF and SLN formulation chromatogram are as shown in Fig. 2 and 3
respectively.
FIG. 3: A TYPICAL HPLC CHROMATOGRAM OF TDF SOLID-LIPID NANOPARTICLE FORMULATION
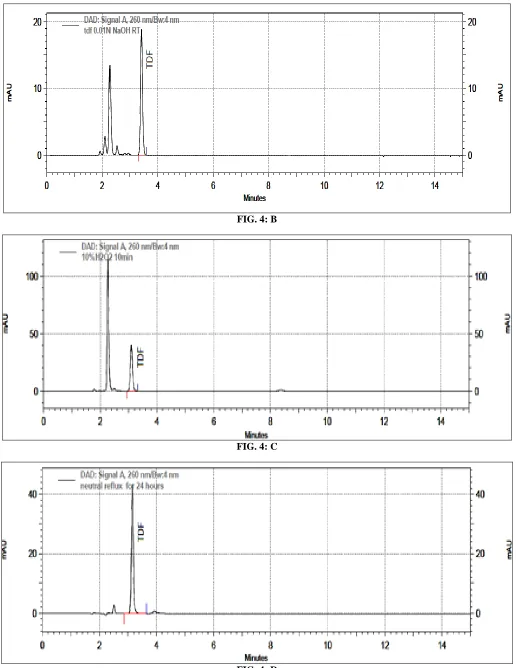
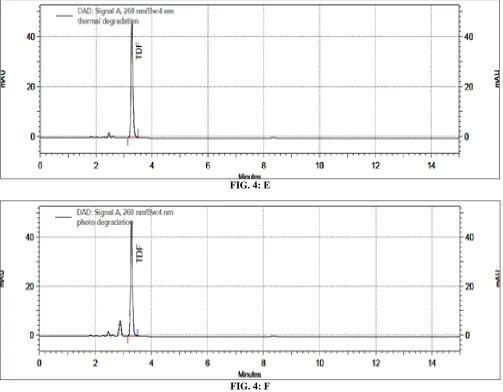
Forced degradation studies: The TDF sample showed degradation under acid, base, oxidative and
photolytic stress conditions as shown in Table 2.
TABLE 2: FORCED DEGRADATION STUDIES OF TENOFOVIR DISOPROXIL FUMARATE
Conditions % degradation observed
Acidic degradation 0.1NHCl, reflux 30min 11 %
Alkaline degradation 0.01N NaOH, 25C 56%
Oxidative degradation 10%v/v H2O2,10min 9%
Neutral hydrolysis Reflux for 24h Nil
Thermal degradation 60C,24h Nil
Photolytic degradation UV light,8h 13%
Peak purity test results derived from the PDA detector confirmed that the TDF peak is homogeneous and
[image:5.612.55.561.472.710.2]pure in all analyzed stress samples. The chromatograms of forced degradation studies are shown in Fig. 4.
FIG. 4: B
FIG. 4: C
FIG. 4: E
FIG. 4: F
FIG. 4: HPLC CHROMATOGRAMS OF TENOFOVIR DISOPROXIL FUMARATE DEGRADATION: acidic degradation (0.1N HCl, reflux 30min) (A); alkaline degradation (0.01N NaOH, 25C.) (B); neutral degradation (H2O, Reflux, 24h) (C); oxidative degradation (10%v/v H2O2, 10min) (D); thermal degradation (60C, 24h (E); photolytic degradation (UV light, 8h) (F).
Validation study:
Specificity: When placebo (excipients present in nanoparticle formulation other than the drug) was injected there was no interference observed at the
retention time of TDF in the developed
chromatographic condition as indicated by
[image:7.612.55.557.568.733.2]chromatogram of placeboin Fig. 5.
Test solution stability: The RSD of the assay of
Tenofovirdisoproxilfumarate during solution
stability experiments was within 2.0%. No significant changes were observed in the content of the assay of Tenofovirdisoproxilfumarate during
solution stability experiments. The solution stability experiment data confirm that the sample solutions and the mobile phase are stable up to 24h.
Precision: The percent RSD for intraday precision and interday precision studies for the assay of Tenofovirdisoproxilfumarate was found to be 0.968 and 0.461 respectively which is within 2.0, thus confirming the precision of the method.
Linearity: The plot of peak area of TDF versus
concentration ranging from 10 to 60 g/ml was
linear, and the data were subjected to statistical analysis using a linear regression analysis with least-squares. The linear regression equation and correlation coefficient were y = 46170x - 10357 and 0.9977 respectively. The RSD values for the peak areas of TDF at each level are within 2.0. These results showed that good correlation existed between the peak area and concentration of the analyte.
FIG. 6: CALIBRATION OF CURVE OF TENOFOVIR DISOPROXIL FUMARATE
Accuracy: The accuracy of the assay method was evaluated in triplicate at three concentration levels
at 24, 30 and 36g/ml, with respect to specification
level, which is 30 g/ml. The same procedure was
adopted for SLN formulation. The percentage recovery of TDF in bulk drug samples and SLN formulation was found in the range of 99.12– 100.76% and 92.57–103.56%, respectively.
Robustness: No significant change in the assay value was observed for any of the deliberately varied chromatographic conditions. The system suitability parameters like tailing factor (1.06 to 1.16) and RSD values are well within the limits, which confirm the robustness of the developed method.
LOD and LOQ: Limit of detection and limit of quantification were calculated by using slope method (3.3 × SD/S and 10 × SD/S respectively) and found to be 0.228μg/ml and 0.691μg/ml respectively.
Application of the assay method for the analysis of the formulation: The drug content of the solid-lipid nanoparticle formulation when analyzed by the proposed method was found to be 97.94%.
CONCLUSION: A simple, specific and reliable isocratic HPLC-DAD method was developed for the estimation of developed RP-HPLC isocratic method for the determination of TDF assay in bulk active pharmaceutical ingredient and solid-lipid nanoformulation was found to be specific, precise, accurate and robust. The stability-indicating nature of the proposed method was established by performing forced degradation studies, which provided the degradation behaviour of TDF under various conditions. The method validation data showed satisfactory results for all tested method parameters. Hence, the developed HPLC method can be used for assay of solid-lipid nano-formulation and for stability of bulk samples of Tenofovirdisoproxilfumarate.
ACKNOWLEDGMENTS: We are thankful to SVKM’s management for providing the facilities required for the research work.
CONFLICT OF INTEREST: All authors have none to declare.
REFERENCES:
1. Bartlett A, Fath J, Demasi R, Hermes A, Quinn J, Mondou E and Rousseau F: An updated systematic overview of triple combination therapy in antiretroviral-naive HIV-infected adults. AIDS, 2006; 20:16, 2051-2064.
2. James A, Ofotokun I, Sheth A, Acosta E and King J: Tenofovir: Once-daily Dosage in the Management of HIV Infection. Clinical Medicine Insights Therapeutics, 2012; 4: 201–216.
[image:8.612.48.301.450.617.2]tenofovirdisoproxil fumarate tablet. International Journal of Pharmaceutical Sciences and Research, 2016; 7:4, 1662. 4. Bhavsar D, Patel N. RP-HPLC method for simultaneous estimation of tenofovirdisoproxilfumarate, lamivudine, and efavirenz in combined tablet dosage form. Pharmaceutical Methods, 2012; 3:2, 73-8.
5. Hussen SS, Shenoy P and Krishna M: Development and validation of stability indicating RP-HPLC method for tenofovir nanoparticle formulation. International Journal of Pharmacy Pharmaceutical Sciences, 2013; 5:2, 245-8. 6. Rama Prasad LA, JVLNS R, Srinivasu P, Vara Prasad J,
and Hemalatha J. New stability indicating hplc method for simultaneous estimation of lamivudine, tenofovir DF and nevirapine in extended release tablets. International Journal of Pharmaceutics, 2013; 3:1, 136-44.
7. Kavitha KY, Geetha G,Hariprasad R, Venkatnarayana R and Subramanian G. Development and validation of RP-HPLC analytical method for simultaneous estimation of emtricitabine, rilpivirine, tenofovirdisoproxil fumarate and its pharmaceutical dosage forms. Pharmacie Globale, 2013; 1:4, 1.
8. Venkatesan S, Kannappan N and Mannemala SS. Stability-Indicating HPLC Method for the Simultaneous Determination of HIV Tablet Containing Emtricitabine, Tenofovir Disoproxil Fumarate, and Rilpivirine Hydrochloride in Pharmaceutical Dosage Forms. International Scholarly Research Notices, 2014; 29, 2014. 9. Hussen SS, Dengale SJ, Udupa N and Krishna M.
Development and validation of HPLC method for tenofovir in small volumes of rat plasma using SPE and application to pharmacokinetic studies. Journal of Pharmacy and Phytotherapeutics, 2013; 1(5):14-20. 10. Anandakumar K, Abirami G, Murugan S and Ashok B.
RP-HPLC method for simultaneous estimation of lamivudine, tenofovirdisoproxilfumarate and efavirenz in tablet formulation. Journal of Analytical Chemistry, 2013; 68:9, 815-21.
11. Rao NM, Sankar DG, Development and validation of stability-indicating HPLC method for simultaneous determination of Lamivudine, Tenofovir, and Dolutegravir
in bulk and their tablet dosage form. Future Journal of Pharmaceutical Sciences, 2015; 1: 2, 73-7.
12. Krishna LM, Konijeti SR, Reddy BP and Kumar KA. A validated RP HPLC method for simultaneous estimation of lamivudine and tenofovirdisoproxilfumarate. Indian Journal of Research in Pharmacy and Biotechnology, 2016; 4: 2, 75.
13. Sonawane PH, Panzade PS and Kale MA. Simultaneous estimation of lamivudine and tenofovirdisoproxilfumarate in bulk and combined pharmaceutical dosage form by HPLC method. Asian Journal of Biomedical and Pharmaceutical Sciences, 2013; 3:16, 27.
14. Reddy AP, Teja UC, Sultana SA, Vijayalakshmi M and Nalluri BN. Development and validation of RP-HPLC-PDA method for the simultaneous estimation of emtricitabine, tenofovirdisoproxilfumarate and rilpivirine hydrochloride in bulk, pharmaceutical dosage forms and in dissolution samples. Indo American Journal of Pharmaceutical Research. 2014; 4:11, 5226-34.
15. Zhang Z, Wang L, Xu X, Dong Y and Zhang L. Development of a validated HPLC method for the determination of tenofovirdisoproxilfumarate using a green enrichment process. Analytical Methods, 2015; 7:15, 6290-8.
16. Srinath A, Sneha B, Alladi A, Ahmed R, and Kulkarni RG. Method development and validation for simultaneous estimation of lamivudine, tenofovir and efavirenz in combined tablet dosage form by RP-HPLC and UV-spectroscopic method. International Journal of Pharmaceutical Sciences and Research, 2014; 5:12, 5491. 17. Mulubwa M, Rheeders M, Du Plessis L, Grobler A and
Viljoen M. Development and Validation of High Performance Liquid Chromatography Tandem Mass Spectrometry (HPLC-MS/MS) Method for Determination of Tenofovir in Small Volumes of Human Plasma. Journal of Chromatography & Separation Techniques, 2015; 7, 2015.
18. ICH guideline, “Q2 R1 validation of analytical procedures: text and methodology,” in Proceedings of the International Conference on Harmonization, Food and Drug Administration, November 2005.
All © 2013 are reserved by International Journal of Pharmaceutical Sciences and Research. This Journal licensed under a Creative Commons Attribution-NonCommercial-ShareAlike 3.0 Unported License.
This article can be downloaded to ANDROID OS based mobile. Scan QR Code using Code/Bar Scanner from your mobile. (Scanners are available on Google Playstore)
How to cite this article: