VEHICULAR QUEUE LENGTH MEASUREMENT BASED ON
EDGE DETECTION AND VEHICLE FEATURE EXTRACTION
WAHBAN AL OKAISHI, ABDELMOGHIT ZAARANE, IBTISSAM SLIMANI, ISSAM ATOUF, MOHAMED BENRABH
LTI Lab. Faculty of sciences Ben M’sik, Hassan II University of Casablanca, Dress El Harti B.P 7955, Sidi Othmane, Casablanca, Morocco.
E-mail: [email protected], [email protected] , ibtissamslimani7@gmail. [email protected], [email protected]
ABSTRACT
The queue length is an important parameter used by several companies of traffic management for quantitative analysis of traffic scene. In this paper, we propose a system to measure the queue length. The proposed system contains two principal operations for measuring the queue length the first operation is the motion detection, and the second one is the vehicle detection. The traffic scene is divided into a number of blocks, which have variable sizes based on the camera parameters and the distance between the camera and the position of the block. To minimize the execution time to accord the real-time application, we continuously apply the detection motion operation on the first block of the scene and the queue tail. The vehicle detection algorithm is based on the edge detection and the vehicle features extraction to improve the detection of vehicle and minimize the error of detection of the other things’ edges (damaged of road, the mark of the road, the shadow of trees or building). The algorithm is applied to videos obtained by stationary camera. The obtained results demonstrate the robustness and accuracy of the proposed system.
Keywords:Vehicular Queue Length, Image Processing, Edge Detection, Vehicle Feature Extraction.
1. INTRODUCTION
The collection and analysis of traffic data has been investigated by several researchers, they used a lot of detectors such as loop, radar, infrared ultrasonic and microwave for collecting the traffic information. The major problems concerning these detectors are their installation requires pavements cuts and the detection zone of traffic is small, they are unable to evaluate the whole description of traffic scene. In recent years the vision-based system have been widely used in collection traffic data and traffic management. The traffic video system extracts useful data such as queue length, traffic density, type of vehicles, traffic movements at junctions...Etc. The queue length is an important parameter in many situations such as adjusting the time of traffic lights, accidents and traffic jam.
Several researchers have investigated methods to detect and measure the queue length. A lot of them is based on applying two operations, the motion detection and the edge detection. The weakness of these methods is inability to distinguish between the vehicles edges and the edges of other
things (etc., damaged of road, the mark of the road, the shadow of trees or building).
In [1] [2], they developed an algorithm to detect the vehicular queue. However, their algorithm have inability to measure the queue length. Fathi and al [3] proposed an algorithm to measure the queue length. They divided each lane into subprofiles, the subprofile size is determined by camera and geometry parameters. They applied motion detection and vehicle presence detection to the subprofiles and the output of vehicle presence detection gives the information about queue parameters. In [4], the output of vehicle presence is trained by neural network to estimate the queue length.
use the five levels directional Robinson convolution kernel to compute the horizontal edges. Some scholars use another feature to detect
the presence of vehicle like corner feature as in [7]; they proposed an approach to estimate the queue length at individual lanes based on the detection of corner of vehicles by using Harris corner detectors. In [8], they developed an algorithm based on tracking method to estimate the queue length. They determined a motion area in a location where the vehicles move and it should be close to the camera. The vehicle detection is applied on the motion area by using background subtraction, then the tracking and counting the vehicles in the queue operation is applied on the detected vehicles. The problem of this method is that the queue length is limited by the location of motion area and it is unable to measure the queue behind the motion detection area.
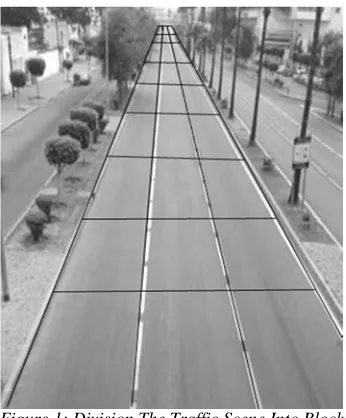
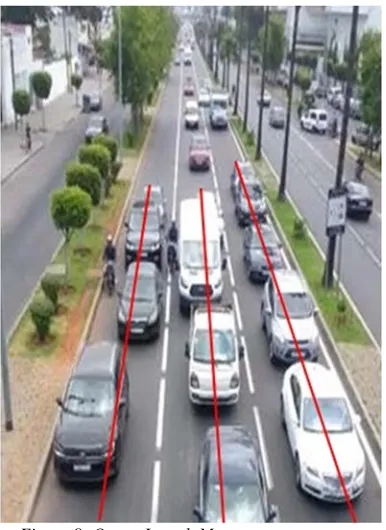
In this work, we propose an algorithm to measure the queue length. The proposed algorithm contains two principal operations for measuring the queue length the first one is the motion detection, and the other one is the vehicle detection. The traffic scene is divided into a number of blocks, which have variable sizes based on the camera parameters, and the distance between the camera and the position of the block, the width of the blocks equals the width of the lane. Fig.1. shows how the traffic scene is divided into the blocks. To minimize the execution time to accord the real-time application, we continuously apply the detection motion operation only on the first block of the scene and the queue tail. The vehicle detection algorithm is based on the edge detection and the extraction of vehicle features to improve the detection of vehicle and minimize the error of detection of the other thing’s edges (damaged of road, the mark of the road, the shadow of trees or building). The algorithm is applied to videos obtained by stationary camera.
The rest of paper is organized as follows: section 2 describes the motion detection algorithm. The vehicle detection method based on the edge detection and extraction object’s features is presented in section 3. The description of Queue length measurement algorithm is presented in section 4. Experimental result and conclusion are given in sections 5 and 6 respectively.
Figure 1: Division The Traffic Scene Into Blocks
2. MOTION DETECTION ALGORITHM
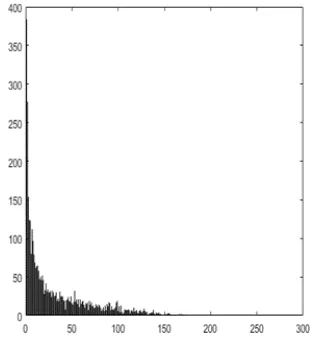
[image:2.612.331.504.125.334.2]produced by the movement of vehicles. Therefore, t is important to find a threshold to determine if there is a motion caused by vehicles. The pixel difference depends on the current ambiance conditions and the brightness of vehicle color. For example, when the color of vehicle is dark and there is motion the pixel difference, between the vehicle and the background (asphalt), is low. Fig.4. show the histogram of the motion of a black vehicle.
[image:3.612.116.268.217.423.2]
Figure 2: The Histogram Of The Difference When There Is Motion.
[image:3.612.328.502.274.497.2]
Figure 3: The Histogram Of The Difference When There Is No Motion
In our work, we compute the mean of the difference of block pixels M by the equation (2); we notice that the mean of the block difference is larger when there is motion than where there is no motion.
𝐷 | 𝐼 𝑥, 𝑦 𝐼 𝑥, 𝑦 | (1)
M ∑ , (2)
Where 𝐼 is the pixel value in the previous frame,
𝐼 is the pixel value in the current frame, N is the number of pixels in the block, and M is the mean of the difference pixels of the block.
Figure 4: The Histogram Of The Motion Of A Black Vehicle.
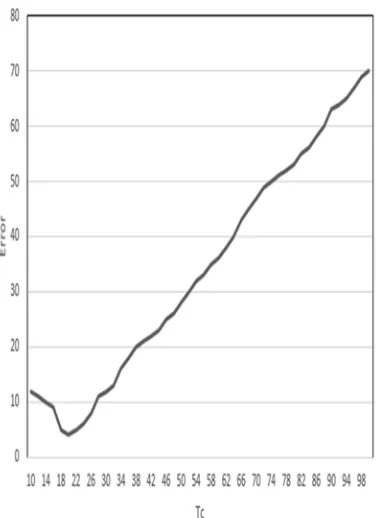
If the mean is greater than a specific threshold, then there is a motion. In order to find the proper threshold. We conducted many experiments in different weather conditions and various situations, in each measurement, we labeled each frame as motion and no motion, and then we choose threshold for several time from interval between [10,100], if the detection is false we compute the error in each frame by the following equation:
𝐸 𝑇 𝑇 (3)
Where 𝑇 is the chosen threshold from the interval,
[image:3.612.121.280.490.659.2]total error and the chosen threshold Tc.
[image:4.612.105.296.180.439.2]This error is the sum of the error of each frame divided by the number of the frames.
Figure 5: The Relation Between The Error And Tc
We observe that the error is minimal in the range [18-22] so we choose the threshold from this range.
3. VEHICLE DETECTION ALGORITHM
After the application of the motion detection algorithm on the first block, if there is no motion, we apply the vehicle detection algorithm on this block for starting to detect and measure the queue length. The vehicle detection algorithm is based on combination of edge detection and vehicle features extraction method. The vehicle detection can be achieved by several methods. There are many studies [10], [11] attempted to detect the vehicles by low-feature of vehicles like the corner feature. In [12], they detect the vehicle by the entropy method; they calculate the entropy of the interest region if the entropy is low there is no vehicle. However, this method is unable to distinguish the entropy caused by the vehicle from the entropy caused by the shadows of trees.
The most commonly used methods for detecting the vehicles are: background subtraction
and edge-based detection. The background subtraction technique is unsuitable for urban traffic, due to the slow movement of vehicles and stop-and-go traffic behind the traffic light, the update error is accumulated because some of foreground pixels will become part of the background and the background model will be corrupted [13]. Therefore, when the scene frame is subtracted from the corrupted background, the resulted frame will contain many errors. In addition, the background updating is sensitive to the ambient lighting condition [14].
Edge-based technique is more robust than background subtraction technique, as the edges are less sensitive to the variation of ambient light. The boundaries of the different parts and color of vehicles create significant edges. Even the vehicle color is similar to the color of road surface, reflect more light and can be detected in this way [15]. Many algorithms have been developed by various researchers for edge detection. Most of them can be grouped into two categories: first order derivative edge detection and second order derivative edge detection, the first category detects the edges by determining the maximum and minimum in the first derivative of the frame, while the second category finds the edges by searching for zero crossings in the second derivative of the frame [16].
The most widely used edge detector in various computer vision systems is canny edge detector [17]. It has some advantages over the other operators, which are represented by three important criteria: optimal detection with low error rate, the edge point detected should localize on a position is close as possible to the true edge position, and minimizing multiple responses to a single edge. The process of canny edge detection algorithm consists of four major steps:
• Remove the noise by applying the Gaussian filter. • Find the edge strength by taking the gradient of the image and using the Sobel operator.
• Apply the non-maximum suppression to insure that local maxima are marked as edges.
• Apply double threshold with hysteresis to connect edge points.
property to improve the vehicle detection in the blocks along the road. Then we use the connected components algorithm to find how many objects exist in the block, the objects that have a small area are removed, they are considered as a noise.
Figure (6) shows the detection of four objects, three of them are so small, so they will be removed.
Figure 6: Result Of Connected Components
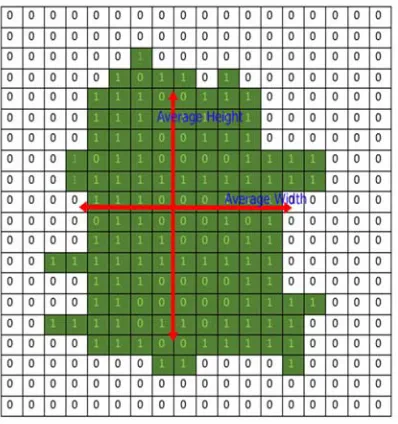
We measure the properties of each object exist in the block. These properties are the area of object, average width and average height. If the average width is larger than the half of the block width, this object is considered as a vehicle and its height is used to compute the queue length. The average width and height are measured by dividing the sum of the number of pixels in each row and column respectively, even if the pixel value is zero, by the number of rows and columns of object.
[image:5.612.321.520.97.309.2]Figure (7) depicts an example of object shape and its average width and height. Due to the height of camera is not enough to detect the vehicles separately; the connected object may contain more than one vehicle. Therefore, the object height determines the queue length. When the position of vehicles is in the rear blocks, the details of vehicle decrease but its width is not so small according to the width of the block. Because the block width is the same of the lane width. Therefore, the vehicle detection in the rear blocks is good enough.
Figure 7: An Example Of Measurement The Dimension
Of The Object.
4. QUEUE LENGTH MEASUREMENT
ALGORITHM
In order to detect and measure the queue length, the first step is to detect the motion in the first block on each lane of the road. The motion detection continuously operates on the first block, if there is no motion we apply the vehicle detection algorithm on this block, if a vehicle is detected, the measuring of the queue length is started. Then the motion detection algorithm is applied on the next block, if there is motion the algorithm is still applied until detecting no motion then the vehicle detection algorithm is applied on this block if there is vehicle the average height of vehicle is added to the queue length. Then we move to the next block and repeat the process. When the motion is detected in the first block then the queue will fall to zero immediately.
When we detect and measure the queue length and the motion is detected in the first block, the queue will be destroyed even if the vehicle moves slowly and then stops. This leads the algorithm to be unstable through the time. To cope with this problem, the time of transition between the no motion state and motion state Tnm must be sufficient to ensure the continuous movement of vehicles. If there is motion for time less than Tnm, it is ignored. To compute the queue length, we follow two steps:
[image:5.612.142.269.201.383.2]Considered as non-vehicle and it will be removed, and if it is not the case it will be considered as a vehicle. Therefore, we can perform the second step. • In the second step, the average height of each vehicle in each block are used to compute the queue length using the following equation:
L = L + D (4)
Where L is the queue length and D is the average height of vehicles in the current block. The initial value of L is zero when the operation of queue detection starts.
5. EXPERIMNTAL RESULT
In this work, we proposed vehicular queue length estimation method. We utilize database that is taken from one traffic camera of Casablanca city to evaluate the performance of the proposed algorithm, this data is collected on various situations and under different lighting and weather conditions. Because the traffic light causes vehicular queue when the red light is on, the database is taken from camera that is installed on top of the traffic light. The traffic signal cycle length is 60 second; the amount of red time is 24 second.
Figure (8) shows an example of queue length measurement; the queue is marked in red. As we can see, the stopped vehicles are detected well and the queue length is measured precisely. In the lane 2 at the block after the queue there is a vehicle but it is not detected because it is still moving and does not stop yet.
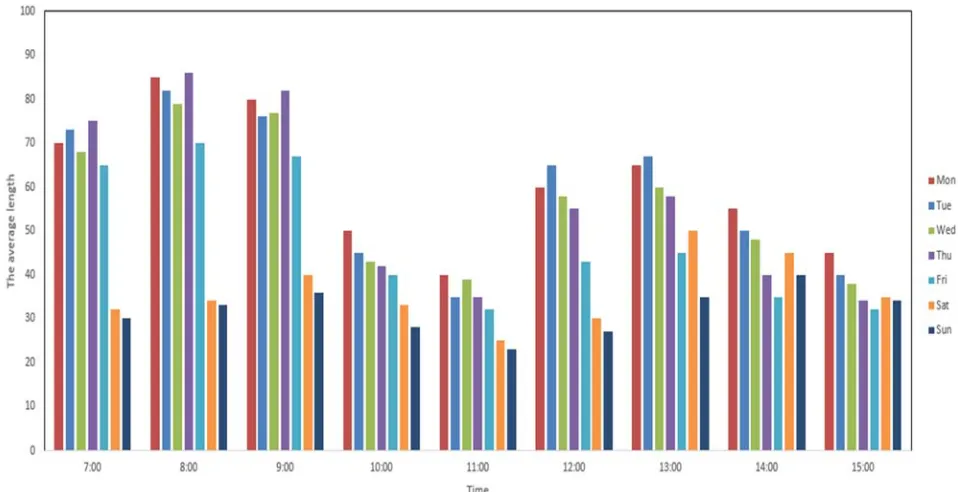
Figure (9) and figure (10) show the results of queue length of the three lanes by the proposed algorithm at 08:00 AM and 10:00 AM respectively during five traffic light cycles.
We notice that the proposed algorithm begin to detect the queue when there is no motion in the first block
and vehicles are detected as the traffic light is
[image:6.612.317.510.252.517.2]red. Then the queue length increased until the motion is detected in the first block when the traffic light turns green, the queue length falls to zero with a small delay to improve the stability of the algorithm. The average queue length at Figure (9) is greater than the average at Figure (10). Because 08:00 AM is at the period of the day when most people are traveling to work.
Figure 8: Queue Length Measurement
Figure 9: The Queue Length Of The Three Lanes At 08:00 AM
Figure 10: The Queue Length Of The Three Lanes At 10:00 AM
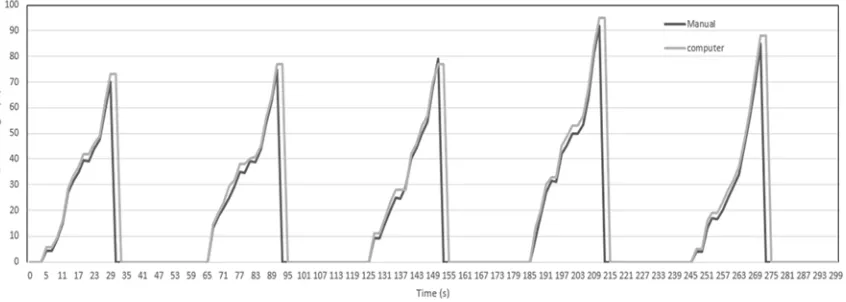
[image:7.612.93.572.466.712.2]Figure (12) and figure (13) show the results of queue length of lane 2 by the proposed algorithm and the manual measurement of the queue at 08:00 AM and 10:00 AM respectively during five traffic light cycles. The results confirm that the proposed algorithm follows the manual measurement of queue length with a so small error. This error due to the difference between the actual positon of object and the object position in the camera. In some rare cases, there is vehicle detection error when the vehicle exists between two lanes (two blocks), its width will be less than half the width of either block. Therefore, it will be considered as undesired object.
The experimental results of the proposed algorithm compared against the manual measurement of queue length approve that the proposed algorithm has the ability for detecting and measuring the queue length accurately and reliability in real time.
6. CONCLUSION
An algorithm for measuring the vehicular
queue length using image processing have been introduced in this paper. The algorithm is based on applying two operations motion detection and vehicle detection. We used the main of the frame differencing to detect the motion; this method is reliable and stable under different lighting condition, and it is not affected by the sudden change illumination, as the difference between the two consecutive frames will not be significant. The vehicle detection operation is based on applying the combination of edge detection and vehicle features extraction. We used the vehicles parameters like the area, the height and the width to ensure that the detected object is a vehicle. The algorithm has been applied to various traffic scenes under different weather and lighting conditions. The experimental results confirm that the proposed algorithm has the ability for detecting and measuring the vehicular queue length accurately and efficiently in real time. The edges of vehicles are not visible well at night time, so vehicle detection by the edges will not give good results. In the future work we will improve the vehicle detection at night time.
[image:8.612.97.536.572.704.2]Figure 12: The Queue Length Of Lane 2 By The Proposed Algorithm Versus The Manual Measurement At 08:00 AM
REFERENCES:
[1] A. Rourke and M. Bell, “Queue detection and congestion monitoring using image processing,” Traffic engineering & control, vol. 32, no. 9, 1991.
[2] N. Hoose, “Computer image processing in traffic engineering,” 1991.
[3] M. Fathy and M. Siyal, “Real-time image processing approach to measure traffic queue parameters,” IEE Proceedings-Vision, Image and Signal Processing, vol. 142, no. 5, pp. 297– 303, 1995.
[4] M. Y. Siyal and M. Fathy, “A neural-vision based approach to measure traffic queue parameters in real-time,” Pattern Recognition Letters, vol. 20, no. 8, pp. 761–770, 1999.
[5] Y. Iwasaki, “An image processing system to measure vehicular queues and an adaptive traffic signal control by using the information of the queues,” in Intelligent Transportation System, 1997. ITSC’97., IEEE Conference on. IEEE, 1997, pp. 195–200.
[6] M. Zanin, S. Messelodi, and C. M. Modena, “An efficient vehicle queue detection system based on image processing,” in null. IEEE, 2003, p. 232.
[7] A. Albiol, A. Albiol, and J. M. Mossi, “Video-based traffic queue length estimation,” in Computer Vision Workshops (ICCV Workshops), 2011 IEEE International Conference on. IEEE, 2011, pp. 1928–1932. [8] M. S. Shirazi and B. Morris, “Vision-based
vehicle queue analysis at junctions,” in Advanced Video and Signal Based Surveillance (AVSS), 2015 12th IEEE International Conference on. IEEE, 2015, pp. 1–6.
[9] I. Kajo, A. S. Malik, and N. Kamel, “Motion estimation of crowd flow using optical flow techniques: A review,” in Signal Processing and Communication Systems (ICSPCS), 2015 9th International Conference on. IEEE, 2015, pp. 1–9.
[10] N. Chintalacheruvu and V. Muthukumar, “Video based vehicle detection and its application in intelligent transportation systems,” Journal of Transportation Technologies, vol. 2, no. 04, p. 305, 2012. [11] A. Albiol, L. Sanchis, A. Albiol, and J. M.
Mossi, “Detection of parked vehicles using spatiotemporal maps,” IEEE Transactions on Intelligent Transportation Systems, vol. 12, no. 4, pp. 1277–1291, 2011.
[12] Y. Cai, W. Zhang, and H. Wang, “Measurement of vehicle queue length based on video processing in intelligent traffic signal control system,” in 2010 International Conference on Measuring Technology
and Mechatronics Automation. IEEE, 2010, pp. 615– 618.
[13] S. C. Sen-Ching and C. Kamath, “Robust techniques for background subtraction in urban traffic video,” in Visual Communications and Image Processing 2004, vol. 5308. International Society for Optics and Photonics, 2004, pp. 881–893.
[14] I. SLIMANI, A. ZAARANE, A. HAMDOUN, and I. ATOUF, “Traffic surveillance system for vehicle detection using discrete wavelet transform.” Journal of Theoretical & Applied
Information Technology, vol. 96, no. 17, 2018. [15] M. Fathy and M. Siyal, “A window-based image processing technique for quantitative and qualitative analysis of road traffic parameters,” IEEE Transactions on Vehicular Technology, vol47, no. 4, pp. 1342–1349, 1998.
[16] G. Shrivakshan and C. Chandrasekar, “A comparison of various edge detection techniques used in image processing,” International Journal
of Computer Science Issues (IJCSI), vol. 9, no. 5, p. 269, 2012.