Content based Image Retrieval using Clustering
Ashish Kumar Raikwar
M.Tech.Netaji Subhas Institute of Technology New Delhi, India
Satbir Jain
Department of Computer Engineering Netaji Subhas Institute of Technology
New Delhi, India
ABSTRACT
To retrieve appropriate information from large image datasets, Content Based image retrieval (CBIR) is a popular approach. In this paper we use binary clustering simultaneously on target and query images to retrieve color difference. One also measure geometric spreadness of each color, using coordinate information of clusters and used it with color difference with some weighted. Experimental results show that CBIRC gives better result as compare to other binning methods and ACE.
General Terms
CBIR, Clustering, Quantization error.
Keywords
CBIR; binary clustering; geometric spreadness.
1.
INTRODUCTION
In the world of technology, information management is become very crucial. As the people know about information technology the use of the computer and digital devices has been increases. People download picture or capture image from digital camera and then upload on the internet. That means we can say that image data are generated very rapidly that create very large image database. This data need to be stored in such a way, so that it can be access easily and quickly.
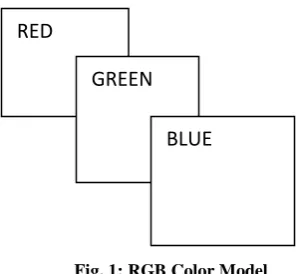
[image:1.595.81.232.574.711.2]An image is a group of pixel that represents the object or region in the image. Many color models are exist to represent the image like RGB, HSV, HSL etc. RGB color model are simple model that uses the primary color (red, green, blue) to represent the color intensity value of the pixel in an image. A color image may be described as three layered image of red, green and blue plane.
Fig. 1: RGB Color Model
In CBIR system images are searched by providing quarry image as a input. Mostly CBIR System consists of some basic steps that need to be followed. These are image pre-processing, feature extraction and similarity measure or
finding distance[1].In the pre-processing stage noise from the image are removed and image converted in some suitable format so that operation on the image can be performed easily and quickly. In the next step various image feature are extracted on the basis of image property like color, texture, shape, edge etc. The number of extracted feature and there type plays an important role on the result and performance of the system. All image features are stored in the feature database. At last query image feature compared to feature database and similar images are retrieved. In the last step distance measure between the target image and quarry image are computed using some distance measure e.g. Euclidian distance, Root-mean distance, City block etc. In our proposed method called Content Based image retrieval using Clustering (CBIRC) we use binary clustering to cluster the color data. In this method quarry image and target image are combined and then difference is calculated. In addition to the color feature in CBIRC, geometric distribution of colors is also taking in account to compare the images.
2. RELATED WORK
Image histogram has been used from many years to retrieve the image and video. Various systems used it for similarity measure e.g. QBIC [2], WebSeek [3] etc. Histograms are popular because they are simple and involve easy computation. Image features are represented by the histogram and each bin represents the number of pixel for a particular color. The distance between images is calculated as the distance between the histogram of image. However, some drawback is associated with the histogram, as they are not containing much information about color distribution and for two image that are completely different may have the same histogram.
Stricker and Orengo [4] suggest a method for color indexing in which three color moments i.e. average, standard deviation and skewness are used to represent the color distribution of an image. Then similarity major between two images is the sum of the difference between these color moments with some weights.
Dominant color descriptor is popular technique to represent the color feature and is used by many researchers for image comparison and retrieval. Same types of color are represented by their dominant color, by this way the performance of the system can be improved. Y. Deng et al. [5] used a color descriptor that contains representative color and its percentage in a region. Image segmentation are apply that form different color regions then with the help of clustering obtained the representative colors for each region.
Local Fourier Transform (LFT) used by Hui Yu et al. [6] to represent texture information in the image. Total eight templates are generated by applying LFT on the image. These templates characterized the image. Then first and second
RED
GREEN
moments are calculated and feature vector are extracted. To overcome the problem in HSV color space ,three dimensional color vector are suggest to used for representing the color. Man Wong et al. [7] describe a problem in RGB based histogram intersection method in which images that are visually similar but different brightness or intensity value may be considered less similar and vice versa. One another problem is the case where two visually similar color of different value are not matched because their intersection area of their histogram are very less or may be nil. To overcome this problem a Merged Histogram Method (MHM) is proposed where instead of making individual color palette a common palette is constructed by intra and inter palette merging.
A cluster based image retrieval scheme is introduced byChen, Wang and Krovetz [8] called cluster-based retrieval of images by unsupervised learning (CLUE). It retrieves the image clusters instead of a set of ordered images. Image cluster are formed by using the unsupervised learning that consider image features as well as how the image are similar to each other semantically.
Fuzzy color histogram is proposed by El-Feghi et al. [1] in which membership value for each color pixel value is calculated using membership function. In this method each pixel may be belongs to more than one color set with some membership value. Manhatin distance is used to find the distance measure between images.
Quynh,Tao and Gyang [9] gives a method for similarity major between image is proposed called Histogram Graph (HISG) .Image are divided in the sequence of sectors and calculate histogram for each color where each bin represented by vertex of the graph. Sum of the minimum cost matching is the distance between two images.
In [10] author gives Adaptive Feature Extraction that is based on BQMP [11] technique in which quaternion moments is used to represent the color data. First color cluster are construct by iteratively calling BQMP. A new distance measure called comparing histogram by clustering (CHIC) is introduced to find the difference between histogram.
3. PROPOSED WORK
For effective image retrieval clustering are used in extensively manner by many researcher. In our work we use binary clustering on color data. We resize the image in equal size and format so that color processing would be easy and effectively work on all images. Let Iqis the quarry image i.e. image to be
search and It is the image from the image database i.e. target
image. In the proposed method all three matrix plane of Iq and
It are combined row by row and considered as a single image
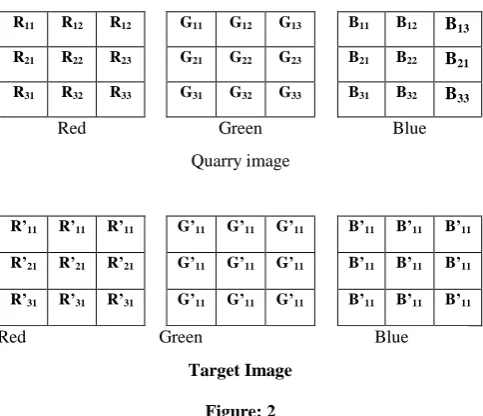
matrix I as shown in figure (2) and (3). Then arrange these matrix planes in one column index form using (1) such that entries of each column sequentially fill up by rows i.e. first quarry image are placed than after target image are place that we call image I. On this image matrix I apply clustering. To identify any pixel belongs to Iqor It a variable dp are used
that store total number of pixel in Iqor It.In matrix plane I if
the index value of any pixel is greater than dpthen it belong to
It otherwise it belong to Iq. Then apply binary clustering on
the data set S so that Si number of clusters are generated and
each Si contain sub cluster 𝑆𝑖𝑞 and 𝑆𝑖𝑡 .The sub cluster 𝑆𝑖𝑞
and 𝑆𝑖𝑡 contains quarry image and target image pixels
respectively. After the clustering process we find the difference between the images by absolutely adding the discrepancy of each cluster. This method also save the index
value in the index cluster Gi. Giis generated corresponding to
each and every color value of the cluster Si called index
cluster and used for retrieving the geometrical feature of the image. On these cluster we calculate geometric mean and geometric standard deviation and then find the geometric difference between the images. The index clusters are stored corresponding to color cluster of image I.
We classify the color data in two class say x0 and x1. Actually
by doing this we are finding out the hyper-plane that will divide the color data set S in x0 and x1.
As shown in figure 3 quarry image pixel 𝑅(𝑥𝑖,𝑦𝑖)𝑞 , 𝐺(𝑥𝑖,𝑦𝑖)𝑞
and 𝐵(𝑥𝑖,𝑦𝑖)𝑞and target image𝑅(𝑥𝑖,𝑦𝑖)𝑡, 𝐺(𝑥𝑖,𝑦𝑖)𝑡 and 𝐵(𝑥𝑖,𝑦𝑖)𝑡
respectively are combined and treated as a single image I.
Coordinate Index Conversion: Any pixel value (xi, yi) are
converted in index form. If M is the matrix with n rows and m columns than index formulas are
𝐼 = 𝑚 ∗ 𝑥 − 1 + 𝑦 (1)
𝑥 = (𝐼 − 𝑦)/(𝑚 + 1) (2)
𝑦 = 𝑚 𝑚𝑜𝑑 𝐼 𝑤𝑒𝑛 𝑚 𝑚𝑜𝑑 𝐼 > 0 (3)
𝑚 𝑜𝑡𝑒𝑟𝑤𝑖𝑠𝑒
Where I is the index value, x is the row of the element i.e. x coordinate and y is the column of element i.e. y coordinate.
R11 R12 R12 G11 G12 G13 B11 B12 B13
R21 R22 R23 G21 G22 G23 B21 B22 B21
R31 R32 R33 G31 G32 G33 B31 B32 B33
Red Green
Quarry image
Blue
R’11 R’11 R’11 G’11 G’11 G’11 B’11 B’11 B’11
R’21 R’21 R’21 G’11 G’11 G’11 B’11 B’11 B’11
R’31 R’31 R’31 G’11 G’11 G’11 B’11 B’11 B’11
Red Green Blue
[image:2.595.308.550.364.572.2]Target Image
Figure: 2
For the input color data set S we use variance 𝜎𝑡 as a
threshold value. One can decide value of 𝜎𝑡 empirically. For
splitting any cluster Si, the variance 𝜎𝑖 of that cluster must be
greater than 𝜎𝑡. To divide the data set S of image in two subsets Sk and Sk+1 assign some index value kifor each and
every pixel pi of image I. These index values are also used to
calculate geometric difference.
Initially S contains all color values of image I. To split image cluster S in two classes calculate the mean and variance of the Image S. If the variance 𝜎𝑖 is greater than some threshold
variance 𝜎𝑡 then it is a splitable cluster thus split this cluster
in Sk and Sk+1. This process is repeats until we meet all the
clusters are unsplitable.
Now calculate mean 𝑥 𝑚for image I.
𝑥 𝑚 =
1 𝑛 (
𝑛
𝑖=1
𝑥 𝑚=
1 𝑛 𝑝𝑖
𝑛
𝑖=1
Than calculate difference 𝐷𝑖 between 𝑥 𝑚 and 𝑥𝑖 where xi
represents the color value of (Ri ,Gi ,Bi) for pixel pi.
𝐷𝑖= (𝑥𝑖− 𝑥 𝑚)
𝐷𝑖= 𝑅𝑖− 𝑅𝑚 + 𝐺𝑖− 𝐺𝑚 + (𝐵𝑖− 𝐵𝑚)
If the Di is negative than the pixel are placed in sub cluster Sk
otherwise it will placed in sub cluster Sk+1.Than calculate
variance of cluster Skand Sk+1 i.e. 𝜎𝑠𝑘and 𝜎𝑠𝑘+1.We first split
that cluster whose variance is maximum. Suppose 𝜎𝑠𝑘+1 is
greater than 𝜎𝑠𝑘 and 𝜎𝑡 then split this cluster. Otherwise if
𝜎𝑠𝑘+1 is not greater than 𝜎𝑡 than Sk+1 will not split and the
splitting process will stop. Similarly if 𝜎𝑠𝑘is greater than 𝜎𝑡
then split Sk. This procedure repeats for each cluster Sk+n
until we meet all the unsplitable clusters i.e. the variance of all cluster is less than threshold value 𝜎𝑡. Each cluster represents the same type colors of the image I. Then find the discrepancy of each cluster.
𝐷𝑖𝑠𝑖 = 𝑐𝑎𝑟 𝑆𝑖𝑡 − 𝑐𝑎𝑟(𝑆𝑖𝑞 )
𝐶𝑜𝑙𝑜𝑟 𝐷𝑖𝑓𝑓 = 𝐷𝑖𝑠𝑖 𝑛
𝑖=1
By adding discrepancy of all clusters we get the color difference between the Iq and It.
In any cluster Si some pixel are from quarry image and some
pixel are from target image. Corresponding to each cluster Si,
index cluster Gi is generated that contain index value ki
corresponding to each pixel pi. The index value ki is converted
in coordinate (xi , yi) using equation (2) and (3).
R11 R12 R12 G11 G12 G13 B11 B12 B13
R21 R22 R23 G21 G22 G23 B21 B22 B21
R31 R32 R33 G31 G32 G33 B31 B32 B33
R’11 R’11 R’11 G’11 G’11 G’11 B’11 B’11 B’11
R’21 R’21 R’21 G’11 G’11 G’11 B’11 B’11 B’11
R’31 R’31 R’31 G’11 G’11 G’11 B’11 B’11 B’11
Red Green Blue
Figure: 3
For x and y co-ordinate of image It, 𝑥 𝑔𝑚𝑡𝑖 and 𝑦 𝑔𝑚𝑡𝑖 are the
geometric mean respectively.
𝑥 𝑔𝑚𝑡𝑖= 𝑥𝑡𝑙
∀ 𝑥𝑡𝑖 ∈ 𝐺𝑆𝑡𝑖
𝑐𝑎𝑟 (𝐺𝑆 𝑡𝑖)
𝑦 𝑔𝑚𝑡𝑖= 𝑥𝑡𝑚
∀ 𝑦𝑡𝑖 ∈ 𝐺𝑆𝑡𝑖
𝑐𝑎𝑟 (𝐺𝑆 𝑡𝑖)
Similarly for image Iq geometric mean 𝑥 𝑔𝑚𝑞𝑖 and 𝑦 𝑔𝑚𝑞𝑖 will
be
𝑥 𝑔𝑚𝑞𝑖 = 𝑥𝑞𝑙
∀ 𝑥𝑞𝑖 ∈ 𝐺𝑆𝑞𝑖
𝑐𝑎𝑟 (𝐺𝑆 𝑞𝑖)
𝑦 𝑔𝑚𝑞𝑖= 𝑥𝑞𝑚
∀ 𝑦𝑞𝑖 ∈ 𝐺𝑆𝑞𝑖
𝑐𝑎𝑟 (𝐺𝑆 𝑞𝑖)
Where 𝑐𝑎𝑟(𝐺𝑆𝑡𝑖) and 𝑐𝑎𝑟(𝐺𝑆𝑞𝑖) are the cardinality of index
sub cluster 𝐺𝑆𝑡𝑖 and 𝐺𝑆𝑞𝑖 respectively.
For each and every unsplitable cluster calculate the geometric standard deviation (GSTD) with respect to geometric mean of quarry image pixel cluster and target image pixel cluster that are considering as a sub clusters of the cluster Si. Geometric Standard Deviation 𝐺𝑆𝑇𝐷𝑡𝑖 for It will be
𝐺𝑆𝑇𝐷𝑡𝑖
= 𝑥𝑡𝑙− 𝑥 𝑔𝑚𝑡𝑖
2
∀ 𝑥𝑡𝑙 ∈ 𝐺𝑆 𝑡𝑖
+ 𝑦𝑡𝑚− 𝑦 𝑔𝑚𝑡𝑖
2
∀ 𝑦𝑡𝑚 ∈ 𝐺𝑆 𝑡𝑖
And 𝐺𝑆𝑇𝐷𝑞𝑖 for Iq
𝐺𝑆𝑇𝐷𝑞𝑖
= 𝑥𝑞𝑙− 𝑥 𝑔𝑚𝑞𝑖 2
∀ 𝑥𝑞𝑙 ∈ 𝐺𝑆 𝑞𝑖
+ 𝑦𝑞𝑚 − 𝑦 𝑔𝑚𝑞𝑖 2
∀ 𝑦𝑞𝑚 ∈ 𝐺𝑆 𝑞𝑖
Than calculate the difference between geometric standard deviation of the sub cluster. Do this for all unsplitable clusters and by absolutely adding their difference that show the geometrical color discrepancy.
𝐺𝐷𝑖= 1 −𝑐𝑎𝑟(𝑆𝐷𝑖𝑠(𝑆𝑖)
𝑖) ∗ 𝑎𝑏𝑠 𝐺𝑆𝑇𝐷𝑡𝑖− 𝐺𝑆𝑇𝐷𝑞𝑖
𝐺𝐷𝑑𝑖𝑓𝑓 = 𝐺𝐷𝑖 𝑖
Adding this Geometrical color discrepancy and color difference of the image will be the total difference between the quarry image and target image.
𝑇𝑜𝑡𝑎𝑙 𝐷𝑖𝑓𝑓 = 𝐶𝑜𝑙𝑜𝑟 𝑑𝑖𝑓𝑓𝑟𝑒𝑛𝑐𝑒 + 𝛼. 𝐺𝑚
In this method geographical information of pixel are also used to classify images more effectively and results are more accurate.
4. EXPERIMENTS
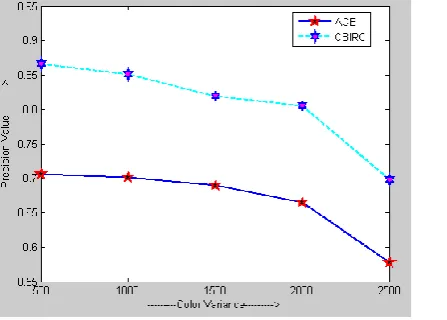
Our experimental result performed on Intel Core2Duo processor of 2.10 GHz with 2 GB RAM in windows XP Environment on MATLAB 7.6.0.324 .We divide all the image in six category . Each and every image belongs to one of the class. We compare our results with the ACE method in the terms of precision graph and figure (6) shows that CBIRC gives the better result.
The performance of color retrieval method measured in terms of average retrieval precision i.e. each time a quarry image select from the database and after processing retrieved k matched image from the database. The average retrieval precision can be defined as
𝜂 = 𝑛𝑖
𝑗 𝑖=1
𝑘
𝑗 𝑖=1
Where j is the no images in the database and ni is the
number of returned image falling into correct image class of quarry image i.
Figure 4: Input image
[image:4.595.317.541.72.232.2]\
Figure 5: Output of CBIRC
Figure 6: Precision Comparison between CBIRC and ACE (VC)
5. CONCLUSION
For Content Based Image retrieval various image feature are used to compare the image. These features may vary as per requirements. More the feature are selected there are chances that results are closer and accurate but it may lead to increase complexity.
CBIRC apply binary clustering simultaneously on target and query images. Binary clustering generates color and their corresponding index cluster. On the basis of these clusters we calculate color and spreadness differences of corresponding colors. Lastly we add these two differences with appropriate weighted i.e. final difference between images. Experimental result shows that average performance of CBIRC are 14% better than ACE.
REFERENCES
[1] I. El-Feghi, H. Aboasha, M. A. Sid-Ahmed, M. Ahmadi “Content-Based Image Retrieval Based on Efficient Fuzzy Color Signature” 2007 IEEE Transaction.
[2] W. Niblack, R. Barber, W. Equitz, M. Flickner, E. Glasman, D. Petkovic, P. Yanker, C. Faloutsos, G. Taubin “The QBIC Project: Querying Images By Content Using Color, Texture, and Shape” SPIE Vol. 1908 (1993) pp : 173-187.
[3] John R. Smith, Shih-Fu Chang “Visually Searching the Web for Content” July-September 1997 IEEE Multimedia: pp: 12-20.
[4] M.Stricker and M.Orengo, “Similarity of color images”, Storage and Retrieval for Image and Video Databases III (SPIE) 1995: pp: 381-392.
[5] Yining Deng, Manjunath, B.S., Kenney, C., Moore, M.S., Shin, H.,”An efficient color representation for image retrieval,” IEEE Transactions on Image Processing, vol.10(1), pp:140 – 147, Jan. 2001
[6] Hui Yu; Mingjing Li; Hong-Jiang Zhang; Jufu Feng,” Color texture moments for content-based image retrieval,” Proc. ICIP 2002, vol. 3 , pp:929-932, 24-28 June 2002.
[image:4.595.59.527.377.754.2][8] Yixin Chen, James Z. Wang, Robert Krovetz,” Content-Based Image Retrieval by Clustering,” MIR’03, November 7, 2003, Berkeley, California, USA, ACM. [9] Nguyen Huu Quynh, Ngo Quoc Tao, Ngo Truong Giang,
“An efficient method for content based image retrieval using histogram graph”, IEEE 10th Intl. Conf. On Control, Automation, Robotics and Vision, pp: 875-876, 17-20 December 2008.
[10]Wei-Ta Chen, Wei-Chuan Liu, and Ming-Syan Chen, Adaptive Color Feature Extraction Based on Image Color Distributions,IEEE Transactions on image processing, pp:2005-2016 vol. 19, no. 8, august 2010. [11]Soo-Chang Pei, Ching-Min Cheng “Color Image