Munich Personal RePEc Archive
Impacts of globalization on quality of life:
evidence from developing countries
Sapkota, Jeet Bahadur
Waseda University, Graduate School of Asia Pacific Studies
11 May 2011
Online at
https://mpra.ub.uni-muenchen.de/37506/
Impacts of Globalization on Quality of Life:
Evidence from Developing Countries
Jeet Bahadur Sapkota, Ph.D.
Visiting Assistant Professor, Global Institute for Asian Regional Integration,
Waseda University
Research Associate, Asian Development Bank Institute, Tokyo
Abstract:
This paper evaluates the impacts of globalization on quality of life, particularly on human development, gender development and human poverty in developing countries. Applying the fixed effect model to the annual panel data of 124 developing countries covering nine years from 1997, it shows that globalization (in terms of its comprehensive indexes and key elements) not only promotes human and gender development, but also significantly reduces human poverty. Not surprisingly, all the three aspects of globalization (economic, social and political) contribute to the overall effect of globalization. In general, the results from the key elements of globalization are consistent with the results from the comprehensive indexes. However, it is also observed that political and social globalization, FDI, and international migration were insignificant to gender-related development. Thus, further research is suggested for appropriate policy recommendations to make these variables significant on promoting gender aspects of development.
Key Words:
Globalization, human development, gender development, human poverty, developing countries
1. INTRODUCTION
Due to its ever-accelerating trend, globalization has been one of the most closely observed processes among scholars, policymakers, politicians and even the general public in recent years (Collier and Gunning 2008, 1-2). Consequently, scholars have devoted their efforts to analyzing the impacts of globalization on different aspects of human life and society. Their arguments are, however, highly contested in terms of impact mechanisms and the gainers and losers of globalization. Some are quite critical as they observe the negative effect of globalization on QOL and society in the form of job elimination, especially in the manufacturing sector (Scott, 2001). These “hyperglobalists” argue that globalization is creating a new era of human history in which nation-states and governments are powerless to improve the quality of life of their citizens (e.g., Guillen, 2001; Soros, 2000). In their view, globalization is a great threat to society and they strongly oppose a globalized world.
In contrast, many others observe the positive impact of globalization on QOL (e.g., Thorbecke and Eigen-Zucchi, 2002). For these “pro-globalists,” trade liberalization and increased marketing integration are opportunities to increase productivity and wages, which lead to improved QOL of workers (Zoellick, 2001). They claim that the negative impact of globalization, such as the elimination of manufacturing jobs, is highly overstated and the decline of the manufacturing industry is the result of rapid changes in technology rather than globalization (Krugman, 1996).
In the debate on the possible consequences of globalization, non-economists generally tend to oppose globalization as they expect the costs associated with globalization to exceed its benefits, particularly in developing countries. On the contrary, supported by a number of empirical studies, most economists strongly believe the net effect of globalization is positive (Dreher, 2006:1091). Although Sirgy et al. (2004) and Tsai (2007) have investigated this question by assessing globalization’s effects on human and social aspects of development, their efforts are still exploratory and further empirical examinations are necessary. This paper attempts to contribute to the study of globalization with an empirical analysis that tests the theories proposed by earlier research, with a focus on the human aspects of development.
2. GLOBALIZATION AND QOL: DEFINITION, TRENDS AND LINKAGES
Most empirical studies related to the so-called third wave of globalization1
These detailed studies, however, failed to consider the overall effect of globalization, as they focused on individual sub-dimensions. As all the dimensions of globalization are strongly related and are important in explaining the consequences of globalization, omitting important variables from the regression equation can generate severely biased estimates (Dreher, 2006). In addition, most of these studies, motivated by conventional wisdom, focus solely on economic growth, income poverty and income inequality (ibid). To avoid these shortcomings, this study intends to use QOL indicators as dependent variables and a comprehensive indicator
of globalization, along with its major elements, as explanatory variables.
employ proxies, such as trade, capital flows and openness as measures of globalization using cross-section data (Dreher, 2006). For example, Heinemann (2000) shows that more globalized countries have lower increments in government outlays and taxes and lower government consumption. Rodrik (1998) also used cross-sectional data and found no effects of capital that account for openness in economic growth. Recently, however, some scholars have used panel data to find the effects of globalization and showed positive impacts of openness on growth and poverty but mixed impacts on income inequality (Dollar and Kraay, 2004; Greenaway et al., 1999).
2.1 Globalization
Globalization is a highly contested concept that means different things to different people (Bardhan, 2006), raising both positive and negative emotions in different groups and circles (Scholte, 2005). Consequently, development practitioners and scholars mostly refrain from explicitly defining globalization, and rather vaguely interpret it as real cross-border interactions and exchanges (Goldin and Reinert, 2007:2). In the literature, globalization is mostly viewed in economic terms. However, we cannot ignore its social and political dimensions, which are usually not considered properly. In fact, cross-national connections are created in the economic, political, cultural, social, and environmental domains.
Measuring these variables into a single indicator is a major challenge in empirical work. In fact, if any concept can be expressed in numbers, it gives more meaning than explanation.
1
Because of its inevitability in empirical research, a number of composite indicators have been developed recently. Constructing such composite indicators has made a significant contribution to globalization research, which is making it possible to consider a wide range of issues of globalization in scholarly works. Although using such composite indexes has its own limitations, the development of a composite indicator is essential to globalization research due to the complexity and comprehensibility of issues involved. Of course, one should be careful when using and interpreting results from such composite indexes. Particularly, conclusions cannot be generalized from such composite indexes for particular sectors or issues, as the results always come from combined effects. Keeping these points in mind, this study uses the KOF index of globalization developed by Axel Dreher (2006), which is considered one of the most comprehensive indicators of globalization.
To define globalization, Dreher followed the explanations of Clark (2000), Norris (2000), and Keohane and Nye (2000:4). He summarized that “globalization is meant to describe the process of creating networks of connections among actors at multi-continental distances, mediated through a variety of flows including people, information and ideas, capital and goods. Globalization is conceptualized as a process that erodes national boundaries, integrates national
economies, cultures, technologies and governance and produces complex relations of mutual interdependence” (Dreher, 2006:1092).
More specifically, Dreher summarized the definition of the KOF index in the following three dimensions. Firstly, “economic globalization,” which is measured by the long-distance flow of goods, capital and services as well as information and perceptions that accompany market exchanges. Secondly, “social globalization” is defined as the spread of ideas, information, images and people, which is measured by personal contacts, information flows
and cultural proximity. Finally, “political globalization” is defined as the level of diffusion of
government policies, which is proxy by the number of embassies and high commissions in a country and, the number of international organizations to which the country is a member and the number of UN peace missions a country participated in. To construct the indices of globalization, Dreher transformed each of 24 variables under the above categories to an index on a scale of one to 100, where 100 is the maximum value for a specific variable over the period 1970 to 2007, and one is the minimum value. Higher values denote greater globalization. For detail see Dreher (2006).
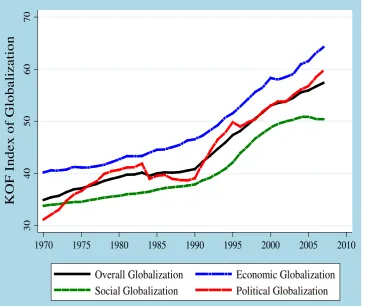
As expected, economic globalization is the strongest of the three factors. In fact, most literature considers economic indicators as a proxy of globalization. This is not only because of data availability and the clarity of economic indicators, but also because of its influence in global integration. Figure 1 also shows that economic globalization has the steadiest trend, without much fluctuation. Even during the Asian Financial Crisis (1997-1998), the trend did not drop sharply. To observe the effect of the current global financial crisis, however, we do not yet have data.
Figure 1 Global Trend of Overall Globalization and Its Sub-Indexes (1970-2007)
30
40
50
60
70
K
O
F
I
nde
x of
G
loba
li
za
ti
on
1970 1975 1980 1985 1990 1995 2000 2005 2010
Overall Globalization Economic Globalization Social Globalization Political Globalization
Source: Calculations done by the author based on data from Dreher (2006). Updated data can be found at: http://globalization.kof.ethz.ch/ (accessed May 5, 2010).
Representing the high turmoil in international security as well as the increasing role of global governance, political globalization fluctuates more. Interestingly, political globalization shows much more of a contribution to the overall globalization trend than social globalization. Social globalization, on the other hand, is continuously the lowest of all trend lines. However, its progress goes along with the pace of other forms of globalization.
be explained by the end of the Cold War in the 1990s, which lead to the opening of many countries in Eastern Europe, Russia and the states that emerged after the collapse of Soviet Union, and many other developing countries. The dramatic increase of political globalization since 1990 has contributed much to the accelerating globalization process.
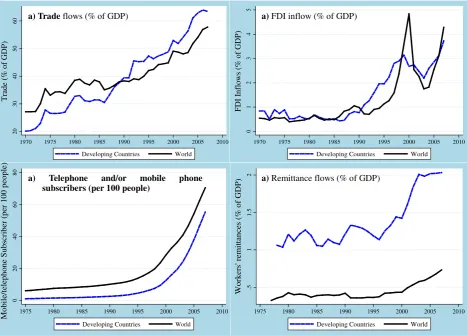
To complement the analysis from the KOF index, this study considers some of the real variables of globalization in a regression analysis. This not only provides an understanding about the relationships between such key elements of globalization and QOL, but also checks the consistency of the results that ultimately enhance the reliability of the study. The selection of the key globalization variables was based on the existing literature in the sense that the most proxy variables for globalization were considered. Therefore, this study uses international trade, FDI, ICT and international migration for its disaggregated analysis. The comparative trends of these key elements of globalization between DCs and the world are shown in Figure 2 on its four parts (2a-2d).
Figure 2(a) shows the comparative trend of international trade between DCs and the world from 1970 to 2007. Interestingly, the trends not only reveal that the trade to GDP ratio is increasing sharply in DCs and the world, but also that international trade has become more and
more important for developing countries in recent decades. Figure 2(b) shows the comparative trends of FDI inflows in percentage of GDP for both the world and DCs from 1970 to 2007,
which reveals that FDI inflows in DCs are less volatile than that of the world. The FDI inflow to GDP ratio has continued to increase since 1990 for both DCs and the world. Again, the fluctuation in the world’s trend is mostly consistent with the trend of DCs in terms of time and direction. However, in terms of magnitude, the world trend has fluctuated sharply in recent years. See the World Investment Reports (WIRs) of 2001 and 2002 of the United Nations Conference on Trade and Development (UNCTAD) for the explanation of such sharp fluctuation, which mainly comes from big mergers and acquisition in developed world (see UNCTAD 2003 and 2008 for detail).
picture would be more interesting. However, information on unofficial flow is difficult to explore. These trends also suggest that the significance of globalization is much higher for DCs.
Figure 2 Comparative Trends of Key Elements of Globalization between DCs and the World
(1970-2007)
Source: Calculations done by the author using data from WDI online database of the World Bank (accessed May 5, 2010).
2.2 Quality of Life (QOL)
QOL, the dependent variable of this study, is also a vague term that has different meanings for different people. QOL is a multifaceted and elusive concept (e.g. Nussbaum and Sen 1993, Doyal and Gough 1991). Generally, QOL definitions emphasize degree of choice, meaning the greater the degree of choice, the higher the QOL. Mainly, choice is explained in economic terms. Thus, for many decades, national QOL measures have been defined by the level of the GNP per capita. Although GNP per capita is a significant part of a development strategy, it cannot capture all aspects of development. Of course, there is a systematic positive relationship
20 30 40 50 60 T ra de (% o f G D P )
1970 1975 1980 1985 1990 1995 2000 2005 2010
Developing Countries World
0 1 2 3 4 5 F DI I nf lo ws ( % o f GDP )
1970 1975 1980 1985 1990 1995 2000 2005 2010
Developing Countries World
0 20 40 60 80 M obi le /t el ephone S ubs cr ibe r (pe r 100 pe opl e)
1975 1980 1985 1990 1995 2000 2005 2010
Developing Countries World
.5 1 1. 5 2 Wo rk er s' r em it tan ces ( % o f G D P )
1975 1980 1985 1990 1995 2000 2005 2010
Developing Countries World
a) Trade flows (% of GDP) a) FDI inflow (% of GDP)
a) Remittance flows (% of GDP)
between GNP per capita and social and human welfare (McGillivray 1991), but the social and physiological aspect of QOL cannot be measured correctly by the income variable. Thus, a range of socio-economic indicators should be considered to measure QOL. For instance, it is estimated that economic development adds approximately 30 years to life expectancy and reduces infant mortality by 140 deaths per thousands live births (Sagan and Afifi, 1978). Additionally, the World Economic Forum’s World Competitiveness Report (WCR, 1993) also recognizes the importance of measuring social and economic indicators of competitiveness among nations, including human resources as the fifth of the 10 most important economic components of a nation’s environment. However, there has been no individual attempt to create such a composite index, as it requires massive efforts and cost.
To cover this shortcoming, the United Nations Development Program (UNDP 1990) introduced the Human Development Index (HDI), a comprehensive measure of QOL, in 1990 aiming to provide a yardstick of human development of all member countries of the United Nations. Since then, the UNDP has published the Human Development Report (HDR) annually for the world, and occasionally for regions and member states, in detail. The HDR’s basic principle is that the essential components of QOL are the combination of a long and healthy life,
education, and a decent standard of living. As a result, the HDI has measured human development through the use of three factors; longevity, knowledge and GDP per capita
measured in purchasing power parity (PPP).
Because of its popularity and data availability for a wide range of countries since before 1990, this study uses the HDI as an overall measure of QOL. Apart from the HDI, there are four other key indexes that have been reported by the HDR: the Gender Development Index
(GDI), the Gender Empowerment Index (GEM), and the two Human Poverty Indexes for
developing (HPI-1) and developed (HPI-2) countries. This study, however, takes the GDI and HPI-1 along with HDI as dependent variables. Detailed explanations and calculations techniques of the indexes can be found in Technical Note 1 of Human Development Report,
2007/08 (UNDP, 2008: 356-357).
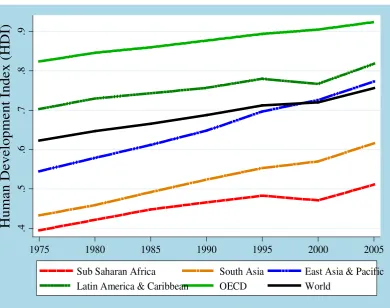
Figure 3 Regional Comparisons of Human Development Trends (1975-2005)
.4
.5
.6
.7
.8
.9
H
um
an
D
eve
lopm
ent
I
nde
x (
H
D
I)
1975 1980 1985 1990 1995 2000 2005
Sub Saharan Africa South Asia East Asia & Pacific
Latin America & Caribbean OECD World
Source: Calculations done by the author based on UNDP (2009). Updated data also available at: http://hdr.undp.org/en/statistics/data/ (accessed in May 3, 2009).
C. Linkages between Globalization and QOL
leads to faster economic growth (Urata and Yokota 1994; Rodrik et al. 2004). However, many argue that some policy measures are essential to make globalization work for all (Mayer 2007) pointed out that globalization alone is not a sufficient condition for development. For example, trade liberalization without roads and ports would not lead to more trade or help the poor (Stiglitz 2004). Even though scholars point out the defects of the current form of globalization and suggest better options, they ultimately tend to favor globalization.
On the contrary, many others see globalization as a new hegemonic project that transnational capitals operate in a way that promises little betterment for most countries. This perspective claims that the current form of globalization is the creation of a new world order that facilitates capitalist accumulation in the so-called free market environment (Petras and Veltmeyer 2001). Promoting private interests in a limitless free market ignores personal and social interests (Smart 2003). As a result, benefits from globalization primarily go mainly to the already advantaged (Scholte 2005).
Within the context of these controversies, this paper attempts to answer how and which types of globalization generate the most favorable and unfavorable human consequences. It founded on the theoretical base provided by the Sirgy et al. (2004) and improves the empirical
model offered by Tsai (2007) to evaluate the human consequences of globalization.
3. DATA AND METHODOLOGY
Most empirical analyses use cross-country data at a certain point in time (Rodrik 1988). Although this is useful to find differences between countries, such studies fail to observe changes in structural features and their correlates over time. These studies are also limited by fewer numbers of observations, which lead to weak results. Thus, this study builds a panel of 124 DCs, covering nine years of annual data of globalization and human development from 1997 to 2005. The selected countries are listed in Appendix 1. Data from 1997 onward is used because there is no HPI data available for years prior to 1997.
The current study corrects these shortcomings by using the components of globalization simultaneously with annual data.
3.1 The Data and Its Sources
The HDI, the GDI and the HPI-1 are the dependent variables of this study. Data are from the 1998-2007/08 annual HDRs. The KOF indexes (sourced from the updated database of Dreher 2006) and some key elements of globalization (sourced from the WDI online database), as defined in the previous section are explanatory variables. Contrary to the conventional approach of using proxies of globalization through specific factors such as trade and investment, this paper adopts a more multidimensional and pluralistic approach. A multidimensional approach is far more effective in preventing the over-simplification of complexities involved in understanding globalization. This over-simplification is usually due to the omitting of important variable(s) in addition to problems of measurement and interpretation (Dreher et al. 2008: 121).
In choosing the set of control variables, this paper follows standard practice as much as possible. Firstly, a country’s level of development is considered a critical element in improving human development (Tsai 2007). Thus, it includes per capita GDP to differentiate development levels across countries. Secondly, as this study focuses on developing countries, population growth is also included because the literature has long documented the harmful impacts of
unchecked fertility against limited resources, such as attenuated health and educational expenditures, insufficient housing, sanitary and water, etc. (Goldthorpe 1996). Data of both the
3.2 The Model
Throughout this paper, the fixed effect (FE) estimation model is used to analyze the data. The FE model explores the relationship between predictor and outcome variables within an entity (country, person, company, etc.). When using the FE model, it is assumed that something within the individual may impact the predictor or outcome variables, so this needs to be controlled for. Another important assumption of the FE model is that time-invariant characteristics are unique to the individual and should not be correlated with other individual characteristics. Each entity is different, therefore the entity’s error term and the constant (which captures individual characteristics) should not be correlated with the others. If the error terms are correlated, then FE is not suitable since inferences may not be correct and that relationship needs to be modeled (probably by using random-effects). The Hausman test indicates that the dataset good fit the FE model. The model is described as follows.
log Yit= α + β1 logCit + β2 logGit + ui +∈it
Here, Y is the vector of dependent variables (i.e. HDI, GDI and HPI-1), C is the vector of
control variables (i.e. GDP per capita and population growth) and G is the vector of
explanatory variables (i.e. the indexes of globalization). α is the constant term. β is the coefficient of explanatory variable that explains the strength and direction of impact on QOL
indicators. In addition, i represents the group identifier (i.e. 124 countries), and t represents the
time identifier (i.e. 9 years from 1997 to 2005). Similarly, ui +∈it is the composite error term,
where ui is the unobservable country effect fixed over time. Time dummies were included in the
equation and found that the time effect is jointly significant; however, results for time dummies are not reported in result tables.
A number of diagnostic tests were performed before and after running the regression in Stata. A unit root test for panel data developed by Levin, Lin and Chu (2002) was performed that confirmed all the variables are free from the unit root problem. Similarly, tests for autocorrelation and heteroskedasticiy also showed no significant such problems on the model. The correlation matrix of each variable is presented in Appendix 3.
4. RESULTS
uses the KOF indexes to capture the overall effects of globalization. Table 1 shows the impacts of the major elements of globalization on the HDI. Column 1 reports the results without the interaction terms, whereas Column 2 reports the results of regression including all the interaction terms. The effects of trade and access to ICT were found to significantly increase human development at the 1 % level in both the columns. These results are consistent with much of the existing literature, theoretical as well as empirical, which argues that trade helps overall socio-economic development by increasing employment, productivity, government revenue, educational access and standards, among other things, all which lead to the overall improvement of human development (Seker, 2009; Bernard et al., 2007). Similarly, UNDP (2001) claims that using ICT in a development strategy allows DCs to achieve a wider diffusion of benefits, which ultimately leads to a broad-based economic growth.
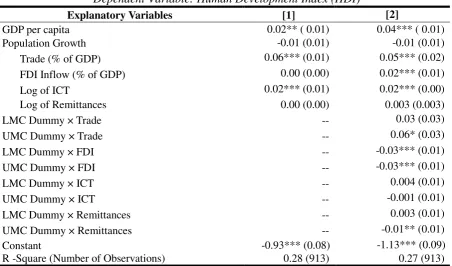
Table 1 Human Development and Four Major Elements of Globalization (1997-2005)
Dependent Variable: Human Development Index (HDI)
Notes: Fixed effect (FE) estimations are reported. Standard errors are in parentheses. * means the coefficient is significant at 10%, ** is significant at 5%, and *** is significant at 1%. LMC=lower-middle income countries and UMC=Upper-middle income countries. All the variables, dependent as well as explanatory, are logged to neutralize the skewness of data. The data covers 1997 to 2005 annually.
Sources: The data of GDP per capita, population growth rate, trade, FDI inflow, mobile/fixed line subscribers (as ICT) and remittances are taken from the WDI online database of the World Bank. HDI are taken from the HDRs from 1997 to 2007/08 of the UNDP.
Impact of FDI was found to be significant at 1% only in Column 2. The finding is consistent with the evidence drawn by Arnal and Hijzen (2008), which suggests that the
Explanatory Variables [1] [2]
GDP per capita 0.02** ( 0.01) 0.04*** ( 0.01)
Population Growth -0.01 (0.01) -0.01 (0.01)
Trade (% of GDP) 0.06*** (0.01) 0.05*** (0.02)
FDI Inflow (% of GDP) 0.00 (0.00) 0.02*** (0.01)
Log of ICT 0.02*** (0.01) 0.02*** (0.00)
Log of Remittances 0.00 (0.00) 0.003 (0.003)
LMC Dummy × Trade -- 0.03 (0.03)
UMC Dummy × Trade -- 0.06* (0.03)
LMC Dummy × FDI -- -0.03*** (0.01)
UMC Dummy × FDI -- -0.03*** (0.01)
LMC Dummy × ICT -- 0.004 (0.01)
UMC Dummy × ICT -- -0.001 (0.01)
LMC Dummy × Remittances -- 0.003 (0.01)
UMC Dummy × Remittances -- -0.01** (0.01)
Constant -0.93*** (0.08) -1.13*** (0.09)
OECD based MNEs tend to provide better pay than their domestic counterparts, especially when they operate in developing and emerging economies. The positive impact on wages also appears to spread to the employees of domestic firms that ultimately uplift the QOL of workers in DCs.
As for the control variables, only GDP per capita has a positive impact on human development. The effect was significant at the 5 % level in Column 1 and the 1 % level in Column 2. This result is in the line with the mainstream literature and the general intuition that income improves overall QOL. However, the effect of population growth was not significant.
The results in Column 2 are firmly consistent with Column 1. The main purpose of this column is to observe whether the above observed effects are different in different income groups of countries. As the model does not include the interaction term with the dummy of low-income countries (LICs), the positive sign of the coefficient of the interaction term of the respective income group reveals a larger effect than LICs and vice versa. Thus, Column 2 reveals that the effect of FDI is significantly (at 1%) lower in lower-middle income countries (LMCs) and upper-middle income countries (UMCs) than LICs, as both have -0.3 coefficients. This is a welcoming result that the HDI promoting effect of FDI is higher in LICs, as many
scholars worry that FDI works well only on those countries that have already reached a certain level of development. Regarding the trade issue, the effect on UMCs was significantly (at 10%)
more than other groups of countries.
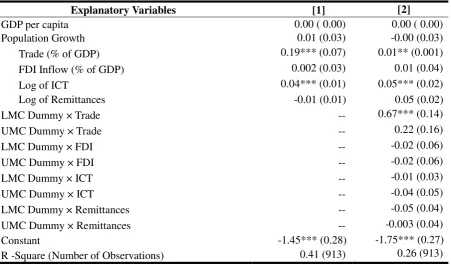
In Table 2, the dependent variable is the GDI. The table reports that trade and ICT are significant at 1% in promoting gender development in both columns except for trade effects on Column 2, which is only significant at 5%. These results support the arguments that international trade reduces the gender gap in DCs. For example, evidence shows that job creation for women in export sectors are growing rapidly (UNDP 1999), and girls, who historically have low labor market participation rates and so have not benefited from the traditional network, take greater advantage of available opportunities when their society undergoes economic changes (Munshi and Rosenzweig 2006). Similarly, the impact of ICT on gender development is consistent with the arguments that ICT brought some benefits to the developing world as women are empowered with ICT access and they negotiate gender relations in the household and community (Kelkar and Nathan 2002).
income groups of countries except for the trade effect on LMCs, which is significantly higher (at 1%) than the other region.
Table 2 Gender-Related Development and Four Major Elements of Globalization (1997-2005)
Dependent Variable: Gender-Related Development Index (GDI)
Explanatory Variables [1] [2]
GDP per capita 0.00 ( 0.00) 0.00 ( 0.00)
Population Growth 0.01 (0.03) -0.00 (0.03)
Trade (% of GDP) 0.19*** (0.07) 0.01** (0.001)
FDI Inflow (% of GDP) 0.002 (0.03) 0.01 (0.04)
Log of ICT 0.04*** (0.01) 0.05*** (0.02)
Log of Remittances -0.01 (0.01) 0.05 (0.02)
LMC Dummy × Trade -- 0.67*** (0.14)
UMC Dummy × Trade -- 0.22 (0.16)
LMC Dummy × FDI -- -0.02 (0.06)
UMC Dummy × FDI -- -0.02 (0.06)
LMC Dummy × ICT -- -0.01 (0.03)
UMC Dummy × ICT -- -0.04 (0.05)
LMC Dummy × Remittances -- -0.05 (0.04)
UMC Dummy × Remittances -- -0.003 (0.04)
Constant -1.45*** (0.28) -1.75*** (0.27)
R -Square (Number of Observations) 0.41 (913) 0.26 (913)
Notes: Fixed effect (FE) estimations are reported. Standard errors are in parentheses. * means the coefficient is significant at 10%, ** is significant at 5%, and *** is significant at 1%. LMC=lower-middle income countries and UMC=Upper-middle income countries. All the variables, dependent as well as explanatory, are logged to neutralize the skewness of data. The data covers 1997 to 2005 annually.
Sources: The data of GDP per capita, population growth rate, trade, FDI inflow, mobile/fixed line subscribers (as ICT) and remittances are taken from the WDI online database of the World Bank. GDI are taken from the HDRs from 1997 to 2007/08 of the UNDP.
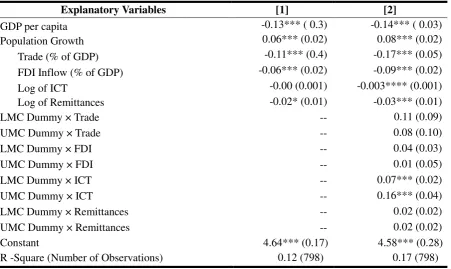
Table 3 presents the impacts of the major elements of globalization on human poverty in developing countries (HPI-1). The poverty effect of globalization elements is broader than the human and gender development effects because all the four elements of globalization (trade, FDI, access to ICT and remittances (except in Column 1)) are found to be significant in decreasing human poverty at 1 %. Trade and FDI inflows are significant at 1% in both cases with or without the interaction terms, whereas ICT was significant at 1% in Column 2 but not significant in Column 1. Migration was significant at 1 % in the case with and 10% without interaction terms.
These results are consistent with the positive arguments of Winters (2000) and Urata (2002) for trade effect, Moran (2001) for FDI effect, the World Economic Forum (2010) for
economic growth.
Table 3 Human Poverty and Four Major Elements of Globalization (1997-2005)
Dependent variable: Human Poverty Index for Developing Countries (HPI-1)
Explanatory Variables [1] [2]
GDP per capita -0.13*** ( 0.3) -0.14*** ( 0.03)
Population Growth 0.06*** (0.02) 0.08*** (0.02)
Trade (% of GDP) -0.11*** (0.4) -0.17*** (0.05)
FDI Inflow (% of GDP) -0.06*** (0.02) -0.09*** (0.02)
Log of ICT -0.00 (0.001) -0.003**** (0.001)
Log of Remittances -0.02* (0.01) -0.03*** (0.01)
LMC Dummy × Trade -- 0.11 (0.09)
UMC Dummy × Trade -- 0.08 (0.10)
LMC Dummy × FDI -- 0.04 (0.03)
UMC Dummy × FDI -- 0.01 (0.05)
LMC Dummy × ICT -- 0.07*** (0.02)
UMC Dummy × ICT -- 0.16*** (0.04)
LMC Dummy × Remittances -- 0.02 (0.02)
UMC Dummy × Remittances -- 0.02 (0.02)
Constant 4.64*** (0.17) 4.58*** (0.28)
R -Square (Number of Observations) 0.12 (798) 0.17 (798)
Notes: Fixed effect (FE) estimations are reported. Standard errors are in parentheses. * means the coefficient is significant at 10%, ** is significant at 5%, and *** is significant at 1%. LMC=lower-middle income countries and UMC=Upper-middle income countries. All the variables, dependent as well as explanatory, are logged to neutralize the skewness of data. The data covers 1997 to 2005 annually.
Sources:The data of GDP per capita, population growth rate, trade, FDI inflow, mobile/fixed line subscribers (as ICT) and remittances are taken from the WDI online database of the World Bank. HPI-1 are taken from the HDRs from 1997 to 2007/08 of the UNDP.
As expected, population growth has a poverty increasing effect at a 1% level of significance. However, GDP per capita was insignificant in reducing poverty.
Column 2 reveals that there is no difference on the poverty reducing effects of globalization elements across income groups of countries except for ICT. It has a larger effect on higher income group countries and the effect is significant at the 1% level.
result-tables, the suffix ‘a’ is given for the result-columns without interaction terms, and suffix ‘b’ is given for the result-columns with interaction terms.
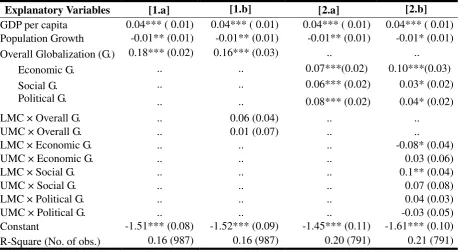
[image:19.595.71.530.258.510.2]The results from both the columns [1.a] and [1.b] show that the overall globalization is highly significant (at 1%) to increase human development. However, Column [1.b] reveals that these effects are not different across income groups of countries. This result supports the theoretical proposition made by Sirgy et al. (2004) that globalization enhances human quality of life in many ways.
Table 4 Human Development and Globalization (1997-2005)
Dependent Variable: Human Development Index (HDI)
Explanatory Variables [1.a] [1.b] [2.a] [2.b]
GDP per capita 0.04*** ( 0.01) 0.04*** ( 0.01) 0.04*** ( 0.01) 0.04*** ( 0.01)
Population Growth -0.01** (0.01) -0.01** (0.01) -0.01** (0.01) -0.01* (0.01)
Overall Globalization (G.) 0.18*** (0.02) 0.16*** (0.03) .. ..
Economic G. .. .. 0.07***(0.02) 0.10***(0.03)
Social G. .. .. 0.06*** (0.02) 0.03* (0.02)
Political G. .. .. 0.08*** (0.02) 0.04* (0.02)
LMC × Overall G. .. 0.06 (0.04) .. ..
UMC × Overall G. .. 0.01 (0.07) .. ..
LMC × Economic G. .. .. .. -0.08* (0.04)
UMC × Economic G. .. .. .. 0.03 (0.06)
LMC × Social G. .. .. .. 0.1** (0.04)
UMC × Social G. .. .. .. 0.07 (0.08)
LMC × Political G. .. .. .. 0.04 (0.03)
UMC × Political G. .. .. .. -0.03 (0.05)
Constant -1.51*** (0.08) -1.52*** (0.09) -1.45*** (0.11) -1.61*** (0.10)
R-Square (No. of obs.) 0.16 (987) 0.16 (987) 0.20 (791) 0.21 (791)
Notes: Fixed effect (FE) estimations are reported. Standard errors are in parentheses. * means the coefficient is significant at 10%, ** is significant at 5%, and *** is significant at 1%. LMC=lower-middle income countries and UMC=Upper-middle income countries. All the variables, dependent as well as explanatory, are logged to neutralize the skewness of data. The data covers 1997 to 2005 annually. Column (2) has fewer observations because some particular types of globalization data are not reported for some countries.
Sources: Globalization indexes are taken from Dreher (2006), GDP per capita (current US$) and population growth rates are from the WDI online database of the World Bank, and HDI are from the HDR from 1997 to 2007/08 of the UNDP.
negative correlations with economic growth, health and educational indicators, particularly in developing countries (e.g. Kelly and Schmitd, 1995).
In Columns [2.a] and [2.b], instead of overall globalization, the three sub-indexes economic, social and political globalization, are included in the equation. Such disaggregated analyses not only demonstrate the independent effect of each dimension of globalization, but also cross-checks the validity of the model based on the consistency of the results. Here, the result is highly consistent with Column [1.a] and Column [1.b]. All the three dimensions of globalization; economic, social and political, were found to be highly significant at the 1% level to increase human development in both the equations with or without the interaction term, except for the social and political globalization in Column 2.b in which the effect were found significant at 10%. Interestingly, the magnitude and direction of the effect of GDP per capita and population growth were also found to be exactly the same as in the previous columns [1.a] and [1.b]. These findings are similar with the outcomes of an empirical analysis by Tsai (2007), but the relationship that he found was rather poor; Tsai showed the significance level of the overall impact of globalization on human development at 10 % and also reported no significant impact of economic and social globalization.
Unlike the case of overall globalization, the results from the disaggregated analysis shows that the human development effect of economic globalization was significantly (at 10%) lower
in LMCs than LICs. However, there is no difference in effects between LICs and UMCs. However, social globalization has a significantly (at 5%) larger effect on LMCs. This indicates that a certain level of development helps to optimize the benefits from social globalization.
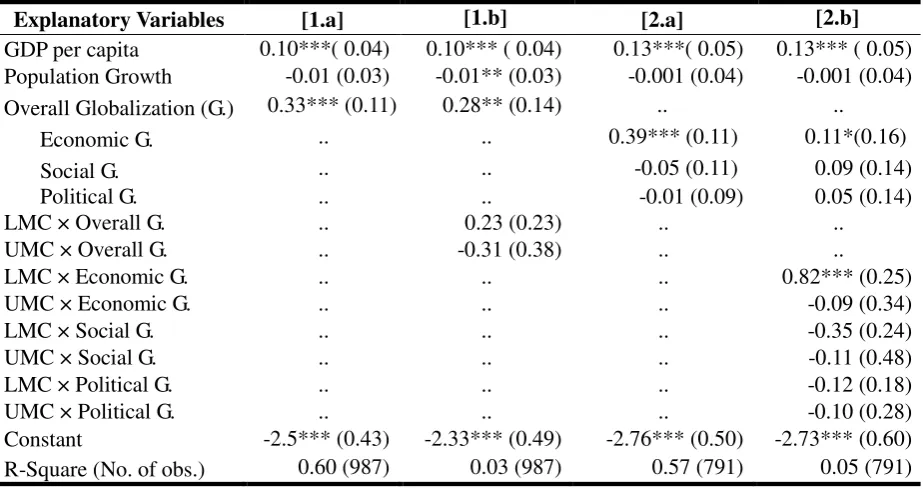
Regarding the control variables, GDP per capita has a significantly (at 1%) positive impact on GDI for both the columns. As expected, population growth was found significant (at 5%) to reduce gender development, although there was no significant effect observed in Column [1.a]. All the effects are found no different across the income group of countries.
Table 5 Gender-Related Development and Globalization (1997-2005)
Dependent Variable: Gender-Related Development Index (GDI)
Explanatory Variables [1.a] [1.b] [2.a] [2.b]
GDP per capita 0.10***( 0.04) 0.10*** ( 0.04) 0.13***( 0.05) 0.13*** ( 0.05)
Population Growth -0.01 (0.03) -0.01** (0.03) -0.001 (0.04) -0.001 (0.04)
Overall Globalization (G.) 0.33*** (0.11) 0.28** (0.14) .. ..
Economic G. .. .. 0.39*** (0.11) 0.11*(0.16)
Social G. .. .. -0.05 (0.11) 0.09 (0.14)
Political G. .. .. -0.01 (0.09) 0.05 (0.14)
LMC × Overall G. .. 0.23 (0.23) .. ..
UMC × Overall G. .. -0.31 (0.38) .. ..
LMC × Economic G. .. .. .. 0.82*** (0.25)
UMC × Economic G. .. .. .. -0.09 (0.34)
LMC × Social G. .. .. .. -0.35 (0.24)
UMC × Social G. .. .. .. -0.11 (0.48)
LMC × Political G. .. .. .. -0.12 (0.18)
UMC × Political G. .. .. .. -0.10 (0.28)
Constant -2.5*** (0.43) -2.33*** (0.49) -2.76*** (0.50) -2.73*** (0.60)
R-Square (No. of obs.) 0.60 (987) 0.03 (987) 0.57 (791) 0.05 (791)
Notes: Fixed effect (FE) estimations are reported. Standard errors are in parentheses. * means the coefficient is significant at 10%, ** is significant at 5%, and *** is significant at 1%. LMC=lower-middle income countries and UMC=Upper-middle income countries. All the variables, dependent as well as explanatory, are logged to neutralize the skewness of data. The data covers 1997 to 2005 annually. Column (2) has fewer observations because some particular types of globalization data are not reported for some countries.
Sources: Globalization indexes are taken from Dreher (2006), GDP per capita (current US$) and population growth rates are from the WDI online database of the World Bank, and GDIare from the HDR from 1997 to 2007/08 of the UNDP.
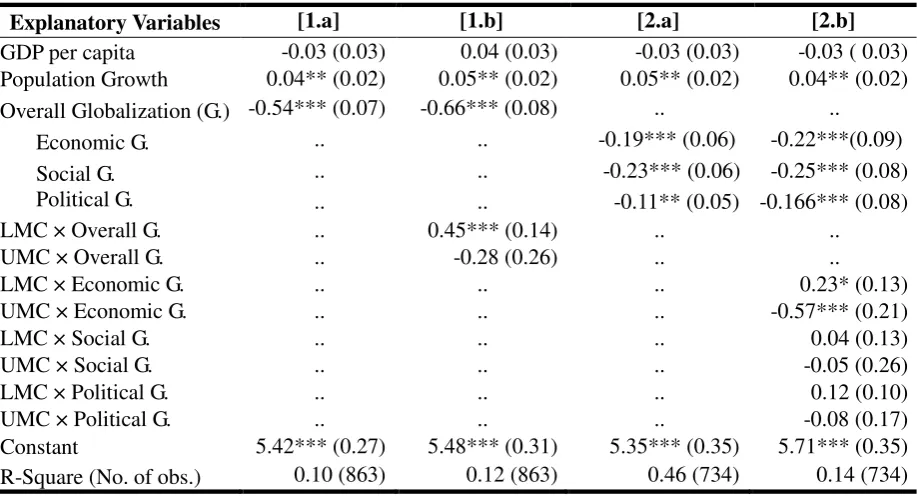
Table 6 shows the relationship between globalization and human poverty. As expected, all the indexes of globalization are found to be significant (mostly at 1%) in reducing poverty, as the coefficient of each indicator has a negative sign. Only in the case of Column [2.a] was the effect of political globalization observed at a 5% level of significance. These results are consistent with the findings by Dollar (2005) and many others that they found globalization has a positive impact on improving the lives of poor people in developing countries and areas.
Table 6 Human Poverty and Globalization (1997-2005)
Dependent Variable: Human Poverty Index for Developing Countries (HPI-1)
Explanatory Variables [1.a] [1.b] [2.a] [2.b]
GDP per capita -0.03 (0.03) 0.04 (0.03) -0.03 (0.03) -0.03 ( 0.03)
Population Growth 0.04** (0.02) 0.05** (0.02) 0.05** (0.02) 0.04** (0.02)
Overall Globalization (G.) -0.54*** (0.07) -0.66*** (0.08) .. ..
Economic G. .. .. -0.19*** (0.06) -0.22***(0.09)
Social G. .. .. -0.23*** (0.06) -0.25*** (0.08)
Political G. .. .. -0.11** (0.05) -0.166*** (0.08)
LMC × Overall G. .. 0.45*** (0.14) .. ..
UMC × Overall G. .. -0.28 (0.26) .. ..
LMC × Economic G. .. .. .. 0.23* (0.13)
UMC × Economic G. .. .. .. -0.57*** (0.21)
LMC × Social G. .. .. .. 0.04 (0.13)
UMC × Social G. .. .. .. -0.05 (0.26)
LMC × Political G. .. .. .. 0.12 (0.10)
UMC × Political G. .. .. .. -0.08 (0.17)
Constant 5.42*** (0.27) 5.48*** (0.31) 5.35*** (0.35) 5.71*** (0.35)
R-Square (No. of obs.) 0.10 (863) 0.12 (863) 0.46 (734) 0.14 (734)
Notes: Fixed effect (FE) estimations are reported. Standard errors are in parentheses. * means the coefficient is
significant at 10%, ** is significant at 5%, and *** is significant at 1%. LMC=lower-middle income countries and UMC=Upper-middle income countries. All the variables, dependent as well as explanatory, are logged to neutralize the skewness of data. The data covers 1997 to 2005 annually. Column (2) has fewer observations because some particular types of globalization data are not reported for some countries.
Sources: Globalization indexes are taken from Dreher (2006), GDP per capita (current US$) and population growth rates are from the WDI online database of the World Bank, and HDI are from the HDR from 1997 to 2007/08 of the UNDP.
To compare the poverty effect of globalization across different groups of countries, overall globalization was found to have a significantly high impact on LMCs. This clearly shows that countries should reach a certain level of development to capture the optimum poverty effect of globalization. The result is thus consistent with the argument of Sabi (2007) that globalization is important for human development only after certain level of income growth. This result actually comes from economic globalization as Column [2.b] shows that economic globalization has a significantly high impact on LMCs (at 10%) but a low impact on UMCs (at 1%), and the effect of social and political globalization are not different across income groups of countries.
Overall, it is argued that globalization, in terms of the KOF index, is statistically significant not only in increasing human development and gender development, but also in reducing human poverty. Even for the segregated index of globalization (i.e. economic, social and political globalization), the results are generally robust. The results are consistent with the analysis using some of the key elements of globalization instead of globalization indexes at the beginning of this section, which further strengthen the reliability of the mode used in this study. Thus, the dataset used and model applied in this study is valid and appropriate.
5. CONCLUSION
In the context of disputing arguments among scholars, the empirical results of this study reveal
that globalization enhances QOL by promoting human and gender-related development and significantly reducing human poverty. Not only the key elements of globalization, but the KOF indexes are highly significant regarding all three dependent variables of QOL (i.e. HDI, GDI and HPI-1) and have been shown to be quite robust in the FE regression model. Not surprisingly, all of the aspects of globalization (economic, social and political) contribute to the overall effect. Indeed, these three factors of globalization comprise a tripod of global integration and move along together rather than separately. Furthermore, the selected key elements of globalization were also found to significantly and positively affect the QOL indicators. This rather conventional approach gives further evidence of the validity and credibility of the data used and the methodology followed in this research. Therefore, it is argued that along with the results, the methodology applied in this study is also useful for similar research of this kind.
effects were found higher in LMCs in general. Thus, the international community should focus their support to LICs to empower them to raise their income level up to a certain level.
The study also observed some unexpected outcomes. Political and social globalization, FDI, and international migration (proxy by remittances) were all found to be insignificant factors of gender-related development. Thus, how can these variables be made to significantly promote gender aspects of development? This is a crucial question for policymakers and the right answers will enhance their capacity for successful globalization because there is no choice but for globalization to improve QOL and other kinds of development. Indeed, better policies will matter in making every element significant in this process. The paper suggests further research for such policy recommendations.
REFERENCES
Arnal, Elena and Alex Hijzen. 2008. “The Impact of Foreign Direct Investment on Wages and Working Conditions.” Paris: OECD Social, Employment and Migration Working Papers no. 68.
Bardhan, Pranab. 2006. “Globalization and Rural Poverty.” World Development 34, no. 8: 1393–1404.
Bernard, Andrew B, J. Bradford Jensen, Stephen J. Redding and Peter K. Schott. 2007. “Firms in International Trade.” Journal of Economic Perspectives 21, no. 3: 105-30.
Clark, William C. 2000. “Environmental Globalization.” In Governance in a Globalizing World,
eds. Joseph S. Nye and John D. Donahue. Washington, DC: Brookings Institution Press: 86-108.
Collier, Paul and Jan Willem Gunning (eds.). 2008. Globalization and Poverty Vol. I. Cheltenham: Edward Elgar Publishing Inc.
Dollar, David. 2005. “Globalization, Poverty, and Inequality since 1980.” The World Bank
Research Observer 20, no. 2: 145-175.
Dollar, David and Aart Kraay. 2004. “Trade, Growth, and Poverty.” The Economic Journal 114,
no. 493: 22-49.
Doyal, Lan and Ian Gough. 1991. A Theory of Human Need. London: Macmillan.
Dreher, Axel. 2006. Does Globalization Affect Growth? “Empirical Evidence from a new Index.” Applied Economics 38, no. 10: 1091-1110.
Firebaugh, Glenn and Brian Goesling. 2004. “Accounting for the recent decline in global income inequality.” American Journal ofSociology 110: 283–312.
Goldin, Ian and Ken Reinert. 2007. Globalization for Development: Trade, Finance, Aid,
Migration and Policy. Washington DC, The World Bank and Palgrave Macmillan.
Grennes, Thomas. 2003. “Creative destruction and globalization.” Cato Journal 22: 543–558. Guillen, Mauro F. 2001. “Is Globalization civilizing, destructive or feeble? A critique of five
key debates in the social science literature.” Annual Review of Sociology 27: 235–260.
Heinemann, Friedrich. 2000. “Does globalization restrict budgetary autonomy? A multidimensional approach.” Intereconomics 35: 288–98.
Kelkar, Govind and Dev Nathan. 2002. “Gender Relations and Technological Change in Asia.”
Current Sociology 50, no. 3: 427-441.
Kelley, Allen C. And Schmidt, Robert M. 1995. “Aggregate population and economic growth correlations: the role of the components of demographic change.” Demography 32, no. 4:
543-556.
Keohane, Robert. O. and Joseph. S. Nye. 2000. “Introduction.” In Governance in a Globalizing
World, eds. J. S. Nye and J. D. Donahue. Washington, DC: Brookings Institution Press: 1–
44.
Levin, Andrew, Chien-Fu Lin and Chia-Shang James Chu. 2002. “Unit root tests in panel data: asymptotic and finite-sample properties”. Journal of Econometrics, 108(1): 1-24
Krugman, Paul. 1996. Pop Internationalism. Cambridge, MA: MIT Press.
Mayer-Foulkes, David. 2007. “Globalization and the Human Development Trap.” UNU-WIDER Research Paper No. 2007/64.
McGillivray, Mark. 1991. “The human development index: Yet another redundant composite development indicator?” World Development 19: 1461–1468.
Moran, Theodore H. 2001. Parental Supervision: The New Paradigm for Foreign Direct
Investment and Development. Washington, DC: Institute for International Economics.
Munshi, Kaivan and Mark Rosenzweig. 2006. “Traditional Institutions Meet the Modern World: Caste, Gender and Schooling Choice in a Globalizing Economy.” American
Economic Review 96, no.4: 1225-52
Norris, Pippa 2000. “Global Governance and Cosmopolitan Citizens.” In Governance in a
Globalizing World, eds. Joseph S. Nye and John D. Donahue. Washington, DC: Brookings
Institution Press, 155-177.
Nussbaum, Martha and Amartya Sen. 1993. The Quality of Life. New York: Oxford University Press.
Oostendorp, Remco H. 2004. “Globalization and the Gender Wage Gap.” The World Bank, Policy Research Working Paper 3256.
Özden, Çaglar and Maurice Schiff (eds.). 2006. International Migration, Remittances, and
Brain Drain. New York: A copublication of the World Bank and Palgrave Macmillan.
Petras, James and Henry Veltmeyer. 2001. Globalization Unmasked Imperialism in the 21st
Century. London: Zed.
Rodrik, Dani. 1998. “Who needs capital account convertibility?” In Should the IMF Pursue
Capital Account Convertibility,Essays in International Finance, 207, eds. Fischer, S.; R. N.
Cooper; R. Dornbusch; P. M. Garber; C. Massad; J. J. Polak; D. Rodrick and S. S. Tarapore. Princeton, NJ: Department of Economics, Princeton University, 55–65.
primacy of institutions over geography and integration in economic development.” Journal
of Economic Growth 9:131–165.
Sabi, Manijeh. 2007. “Globalization and Human Development.” The Paper Presented at the International Conference on Globalization and Its Discontents, Cortland.
Sagan, L. A. and A. A. Afifi. 1978. “Health and economic development factors affecting mortality.” In Energy Risk Management, eds. G. T. Goodman and W.D. Rowe. Maryland,
Academic Press: 139–167.
Scholte, Jan Art. 2005. Globalization: A Critical Introduction (2nd eds.). New York: Palgrave
Macmillan.
Scott, Robery E. (2001) “NAFTA’s Impact on the States: The Industries and states that Suffered the Most in the Agreement's First Seven Years.” Economic Policy Institute Briefing Paper, Washington, DC.
Şeker, Murat. 2009. “Importing, Exporting and Innovation in Developing Countries.” The World Bank, Policy Research Working Paper no. 5156.
Sirgy, M. Joseph, Dong-Jin Lee; Chad Miller and James E. Littlefield. 2004. “The impact of globalization on a country’s quality of life: toward an integrated model.” Social Indicators
Research 68: 251–298.
Smart, Barry. 2003. Economy, Culture and Society: A Sociological Critique of Neo-liberalism.
Buckingham: Open University Press.
Soros, George. 2000. Open Society:Reforming Global Capitalism. New York: Public Affairs.
Stiglitz, Joseph. E. 2004. “Globalization and Growth in Emerging Markets and the New Economy.” The Journal of Policy Modeling, 25: 505-525.
Thorbecke, Willem and Christian Eigen-Zucchi. 1992. “Did NAFTA cause a ‘giant sucking sound’?” Journal of Labor Research 23, no. 4: 647-658.
Tsai, Ming-Chang 2007. “Does Globalization Affect Human Well-being?” Social Indicators
Research 81: 103–126.
UNCTAD. 2009. World Investment Report 2002: Transnational Corporations and the Infrastructure
Challenge. Geneva: United Nations Conference on Trade and Development.
_____. 2003. World Investment Report 2008: Transnational Corporations and Export Competitiveness.
Geneva: United Nations Conference on Trade and Development.
UNDP. 2009. Human Development Report 2007/08, updated database. New York, UNDP. http://hdr.undp.org/en/statistics/data/ (accessed May 3, 2009).
_____. 2008 Human Development Report 2007/08: Fighting Climate Change-Solidarity in a
Divided World. New York: Oxford University Press.
_____. 2001.Human Development Report 2001: Making New Technologies Work for Human
Development.New York: Oxford University Press.
_____. 1999. Human Development Report 1999: Globalization with Human Face. New York:
Oxford University Press.
_____. 1990. Human Development Report 1990: Concept and Measurement of Human
Urata, Shujiro. 2002. “Globalization and the Growth in Free Trade Agreements.” Asia-Pacific Review 9 (1): 20-32.
Urata, Shujiro and Kajuhiko Yokota. 1994. “Trade Liberalization and Productivity Growth in Thailand”. The Developing Economies 32(4): 444-59.
Winters, L. Alan. 2000. “Trade, trade policy and poverty: what are the links?” Centre for Economic Policy Research, Discussion Paper no. 2382.
World Bank 2009. World Development Indicators 2009. Washington, DC: The World Bank. _____. 1993. The East Asian Miracle: Economic Growth and Public Policy. Washington, DC:
The World Bank.
World Economic Forum. 2010. The Global Information Technology Report 2009–2010: ICT
for Sustainability. http://www.weforum.org/documents/GITR10/index.html (accessed May
9, 2010).
_____. 1993 The World Competitiveness Report (WCR), 12th ed. Geneva: WEF and IMD.
Zoellick, Robert B. 2001. Remarks at the national foreign trade council, July 26. http://www.nftc.org/upload/October%202001.pdf (accessed May 16, 2010).
APPENDICES
Appendix-1 List of developing countries included in the study (in alphabetical order)
1. Albania 2. Algeria 3. Angola 4. Argentina 5. Armenia 6. Azerbaijan 7. Bangladesh 8. Belarus 9. Belize 10. Benin 11. Bhutan 12. Bolivia 13. Botswana 14. Brazil 15. Bulgaria 16. Burkina Faso 17. Burundi 18. Cambodia 19. Cameroon 20. Cape Verde 21. Central African
Republic 22. Chad 23. Chile 24. China 25. Colombia 26. Comoros 27. Congo 28. Congo Rep. 29. Costa Rica 30. Cote d’Ivoire 31. Croatia 32. Djibouti 33. Dominica
34. Dominican Republic 35. Ecuador
36. Egypt 37. El Salvador 38. Eritrea 39. Ethiopia 40. Fiji 41. Gabon 42. Gambia 43. Georgia 44. Ghana 45. Grenada 46. Guatemala 47. Guinea 48. Guinea-Bissau 49. Guyana 50. Haiti 51. Honduras 52. India 53. Indonesia 54. Iran 55. Jamaica 56. Jordan 57. Kazakhstan 58. Kenya 59. Kyrgyzstan 60. Lao PDR 61. Latvia 62. Lebanon 63. Lesotho 64. Libya 65. Lithuania 66. Macedonia 67. Madagascar 68. Malawi 69. Malaysia 70. Maldives 71. Mali 72. Mauritania 73. Mauritius 74. Mexico 75. Moldova 76. Mongolia 77. Morocco 78. Mozambique 79. Namibia 80. Nepal 81. Nicaragua 82. Niger 83. Nigeria 84. Pakistan 85. Panama
Appendix-2 Summary Statistics
Variables Obs. Mean Std. Dev. Min Max
Human Development Index (HDI) 1116 0.630986 0.156687 0.25 0.87
Gender-related Development Index
(GDI) 1116 1.166219 17.94408 0.24 600
Human Poverty Index (HPI-1) 869 28.9441 15.40484 3.3 65.5
GDP per capita 1116 1810.893 1846.233 81.58 8931.87
Population Growth 1116 1.630654 1.241132 -2.76 9.76
Trade 1116 81.6509 38.33903 15.84 224.89
FDI 1116 31.18571 32.31529 -16.59 202.3
ICT 1116 19.93576 22.86311 0.04 150.97
Migration (remittances) 1053 4.391168 6.358951 0 44.3
Economic Globalization 909 52.25267 13.77251 17.64 84.6
Social Globalization 1116 45.58204 17.30288 8.56 89.69
Political Globalization 1116 57.10932 19.85124 19.1 93.6
Overall Globalization 1116 50.39887 12.60756 20.82 80.02
Appendix-3 Correlation Matrix
Variables HDI GDI HPI-1 gdppc pgrow trade fdi ict remit
HDI 1
GDI -0.0193 1
HPI-1 -0.9518 0.0169 1
GDP per capita
(gdppc) -0.1824 -0.0148 0.1932 1
Population Growth
(pgrow) 0.1352 -0.0297 -0.1413 -0.4296 1
Trade 0.0815 -0.03 -0.118 0.0942 -0.2033 1
FDI -0.0811 -0.0318 0.0402 0.1023 -0.1903 0.5246 1
ICT -0.1265 -0.0019 0.1383 0.7641 -0.4592 0.1978 0.1772 1
remittances -0.1299 -0.0089 0.0868 -0.137 -0.1185 0.267 0.1416 0.0366 1
Economic G. (ecog) -0.1351 -0.0161 0.1217 0.562 -0.4011 0.5077 0.5713 0.5689 0.1147
Social G. (socg) -0.1128 -0.0237 0.0913 0.6426 -0.4293 0.4227 0.2998 0.6111 0.1649
Political G. (polg) -0.125 0.0615 0.1382 0.2971 -0.2511 -0.3154 -0.2073 0.3546 -0.1369
Overall G. (ovlg) -0.1725 0.0006 0.1564 0.7079 -0.5034 0.3607 0.3898 0.7136 0.1099
ecog socg polg ovlg
Economic G. (ecog) 1
Social G. (socg) 0.6711 1
Political G. (polg) 0.0663 0.1046 1