Load Frequency Control of Multi-Source Power System
with Redox Flow Batteries: An Analysis
K. P. Singh Parmar
Assistant Professor National Power Training Institute Faridabad, Haryana, 121003, India
ABSTRACT
This paper presents the Load frequency control (LFC) of a multi-source power system with Redox flow batteries (RFB). The power system comprises non-reheat thermal, hydro and gas generating units. RFB is integrated to the LFC system to improve the dynamic responses. The proportional plus integral (PI) controller is designed using the PSO technique. Dynamic responses are obtained by giving 1% step load perturbation (SLP) in the area. Further, to show the robustness of the controller, the dynamic responses are obtained by varying the SLP from 1% to 3%. Dynamic responses obtained in all the cases, satisfy the LFC requirements. PSO technique gives good convergence characteristics and promising computational results.
General Terms
Frequency deviation, Multi-source
Keywords
Controller, Particle swarm Optimization, Load Frequency Control
1.
INTRODUCTION
The size and complexity of the power system is increasing and its structure is also changing [1]. LFC is one of the important ancillary services in the power system operation [1-3]. The successful operation of any power system requires the matching of total real power generation (MW) with the total load demand plus losses [1-5]. The operating point of the power system changes with time, and hence power systems may experience deviation in frequency and tie line power exchanges [5]. These deviations may yield undesirable effects. The LFC plays an important role in maintaining the frequency and tie line power at their nominal values [1-5]. LFC problem has been studied by many researchers as it plays a vital role in modern power systems [5]. Optimal control theory based controllers are presented for the LFC study of multi area interconnected power systems [6-8]. A MISO PID controller is used for LFC of decentralized system [8].
Artificial intelligence (AI) and Evolutionary algorithms based controllers have been applied to LFC problem by a wider section of researchers [5, 9-16]. Modern intelligent methods and Evolutionary algorithms, such as Genetic algorithms(GAs), Artificial neural networks (ANNs), Fuzzy
premature convergence which degrades its efficiency and the search capability [5,17]. LFC study of multi area interconnected power systems using type-2 fuzzy approach [14] and Variable structure fuzzy gain scheduling [15] has also been appeared in the literature. PSO is very important and powerful tool to solve the various engineering problems [5, 13, 17].
A fast acting battery energy storage system can effectively reduce the electromechanical oscillations in a power system by providing storage capacity in addition to the kinetic energy of generator rotor [5]. Battery energy storage [5, 20] is very helpful in meeting the sudden load requirements and is effective in improving transient response of frequency and tie line power deviations. A variety of energy storage systems like SMES, BES, CES, RFB have been used in the LFC systems [18-25]. SMES has been applied to LFC problem by many researchers [18, 19, 21]. Rechargeable batteries such as RFB are equivalent to SMES and gaining momentum in research due to their fast and outstanding performance [5, 22-25]
Representing a control area of power systems with multi- sources like hydro, thermal, gas, nuclear etc is more pragmatic [4,17, 28-30]. Most probably, Ramakrishna and Bhatti [28] have introduced first the LFC analysis using multi-source power generation in a control area. Further, many researchers have used and extended the concept of multi-source power system models for LFC analysis [29-31].
Challa et al. [30] studied the LFC of two area interconnected power system with hydro, thermal and gas based units in each control area. Further, Parmar et al. [31] overcome the difficulty of full state feedback controllers by replacing them with output feedback controllers (few states are required for feedback) and implemented in a single area multi-source power system.
schooling and bird flocking. A brief theory is presented for the ready reference; more detail on PSO is contained in [37].
The PSO tool [37] provides a population based search technique in which individuals defined as particles change their position with time. In a PSO system, particles fly around in a multi-dimensional search space. During the flight, each particle adjusts its position based on its own experience and the experience of its neighbouring particles, making use of the best fittest position met by it and neighbouring particles [37-39]. The swarm direction of a particle is defined by the set of particles neighbouring the particle and its past historic experience. Each individual in PSO flies in the search space with a velocity which is dynamically adjusted according to its own flying experience and its companions’ flying experience.
Let p denote a particle’s position and v denote its corresponding flight velocity in a search space [37-39]. Each
particle is treated as a volume less particle and represented as =( , ,…, ) in the -dimensional space. The best previous position of the particle is recorded and represented as =( , ,…….. ). The index of the best particle among all the particles is treated as global best particle and represented as . The velocity for the particle is represented as =( , , ……..., ).
The modified velocity and position of each particle can be computed using the current velocity and the distance from to as shown in the following equations [37-39].
= *w+ *rand( )*( - )+ *Rand( )*(
) (1)
= +
(2)
In the above equation, and are defined as the acceleration coefficients that pull each particle towards the and positions. Rand( ) and rand( ) are the uniform random numbers between 0 and 1. The term rand( )*( - ) is called the cognitive component. The term Rand( )*( - ) is called the social component [37-39]. is the inertia weight factor. Low values of acceleration coefficients allow particles to roam far from the target regions before being tugged back and high values result in abrupt movement towards, or past target regions. Hence, the acceleration constants and are usually set to be 2.0 according to past experiences.
A large inertia weight factor enhances global exploration while a low inertia weight factor helps in local search. As originally developed [39], w often decreases linearly from about 0.9 to 0.4 during a run. In general, the inertia weight w is set according to the following equation [37-39]:
w= –[( – )* ]/( ) (3)
Here is the maximum inertia weight, is the minimum inertia weight, is current no. of iterations,
is maximum no. of iterations.
The performance index is evaluated for each of the particles in the current population. The PSO then updates the particle coordinates based on the equations (1) and (2). This evaluation and updating the coordinates are repeated from population to population until the search termination criterion is met.
3.
REDOX FLOW BATTERIES SYSTEM
AND MODELLING
RFB are rechargeable batteries and becoming very popular due to their quick responses [5, 22, 23]. RFB are not aged by frequent charging and discharging and have outstanding function during overload [5, 22, 23]. Simple operating principle, long service life, suitability for high capacity systems, quick start up and ease in maintenance are the salient features of these batteries [22, 23].
[image:2.595.321.540.326.486.2]Recently, RFB have been integrated in LFC scheme to improve the system response in wake of small load disturbances [24, 25]. A basic diagram [22, 23] of the integration of RFB to the power system is as shown in Fig. 1. During the low load periods, battery charges and delivers the energy back to the system during the peak load demands or sudden load changes [22-25]. The dual converter performs both AC-DC and DC-AC conversions.
Fig. 1: Integration of Energy storage system to a power system
A simplified transfer block of the RFB [22-25] is given in the Fig. 2. Area Control Error (ACE) is used as the input command signal for the RFB in controlling the output response in the LFC system [24].
Fig. 2: Simplified transfer function block diagram of the RFB system
The RFB transfer function block is suitably integrated [24,25] to the LFC system as shown in the Fig. 3.
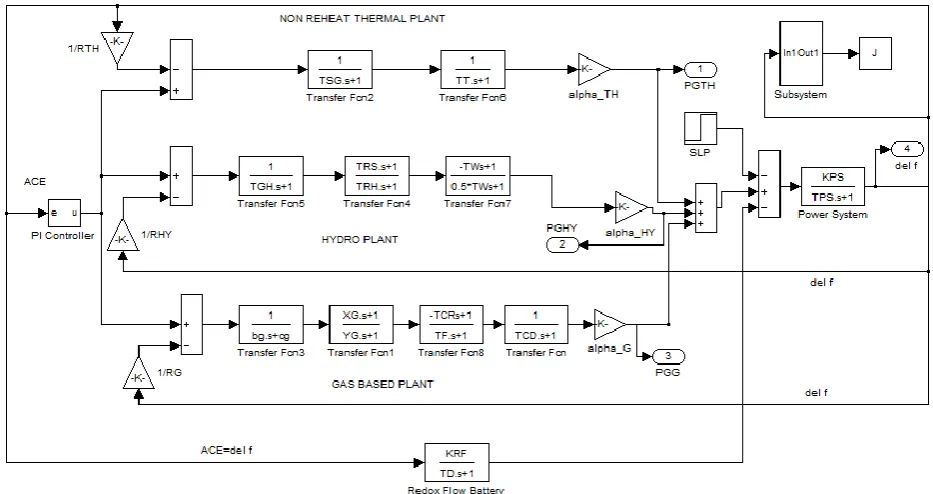
[image:2.595.323.532.551.642.2]Fig. 3: MATLAB Simulation of a multi-source power system with Redox flow batteries system
4.
POWER SYSTEM SIMULATION AND
PARAMETER OPTIMIZATION
A multi-source power system with RFB is presented for LFC system using the PSO based PI controller. The power system is shown in Fig.3. The power system comprises non-reheat thermal, hydro and gas based units in the control area. PSO based PI controller is used in the secondary loop.
The RFB transfer function shown in Fig. 2 is integrated with LFC system. The polarity of the RFB output control signals is kept as per the LFC requirement.
The signal fed into the proposed PI controller is referred to as area control error (ACE). For the single area power system, the ACE can be defined [1-3] in terms of frequency only as there is no interconnection with neighbouring areas.
ACE
B f
(4)Where, B is frequency bias parameter (pu MW/Hz) and assumed unity.
The speed changer (Governor) commands for control area can be given as
dtref p i
P K ACE K ACE
(5)
Where,
p
K
andK
i are the proportional and integral gains of the PI controller, respectively.The minus signs are included since each area of the power system should increase its generation level if its frequency error increment is negative [1-3].
performance index for the PI controller is defined using the Integral square error (ISE) criteria as follow:
2 2
0 0
( ) ( )
T T
J
ACE dt
f dt (6)Where, T is the simulation time.
The controller gains
K
p andK
i have been optimized by minimizing the performance index (J) using the efficient PSO technique as described in section 2.PSO parameters used are as follow: Population size=40,
Maximum number of iterations=100, c1=2; c2=2,
wmax=0.9; wmin=0.4,
Simulation time=100s.
The MATLAB code based on PSO algorithm has been run in MATALB Environment [40]. The convergence characteristic of the PSO algorithm is shown in Fig. 4. The minimum value of the J becomes 0.00021223. The optimized values of the controller gains are computed as: Kp = 1.4814, Ki =0.5657.
5.
SIMULATION RESULTS AND
DISCUSSION
observed, application of RFB improves the transient responses greatly; however settling time remains approximately same. The frequency deviation response of the power system is shown in Fig. 5. The percentage improvement in the frequency overshoot becomes 72. The generating companies either increase or decrease their generation to match the total power generation with the load demand by sensing the incremental change in frequency.
[image:4.595.325.524.76.246.2]Fig. 4: Convergence characteristics of PSO technique
Fig. 5: Frequency deviation response
Fig. 6: Power output of thermal generating unit
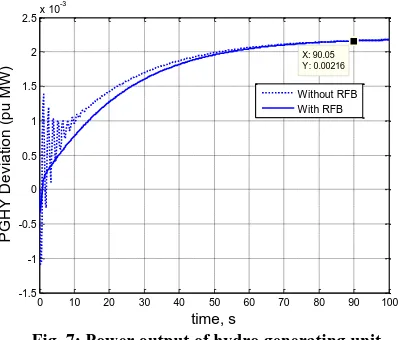
[image:4.595.67.286.168.350.2]Fig. 7: Power output of hydro generating unit
Fig. 8: Power output of gas based generating unit
Fig. 9: Frequency deviation response for 1%-3% SLP variation
The incremental change in generator power outputs of thermal, hydro and gas units are shown in Figs 6, 7 and 8, respectively. In response to 0.01 pu MW SLP in the area, the incremental change in the generation (pu MW) of thermal, hydro and gas units become 0.006643, 0.00216, and 0.001208, respectively. The total sum of the generation at steady state matches the desired value 0.01 pu MW. Further, dynamic responses have been obtained by varying the SLP levels from 1% to 3%. The frequency deviation response is shown in Fig. 9. The overshoot increases with the increase in SLP level and the settling time remains same. The generator responses are shown in Figs 10-12, an extensive analysis
0 10 20 30 40 50 60 70 80 90 100
2.1 2.15 2.2 2.25 2.3 2.35 2.4 2.45 2.5 2.55x 10
-4
No. of iterations
P e rf o rm a n c e I n d e x (J )
0 5 10 15 20 25 30
-20 -15 -10 -5 0 5x 10
-3 time, s F re q u e n c y D e v ia ti o n ( H z ) Without RFB With RFB
0 10 20 30 40 50 60 70 80 90 100 0 0.002 0.004 0.006 0.008 0.01 0.012 0.014 0.016 0.018 X: 90.18 Y: 0.006643 time, s P G T H D e v ia ti o n ( p u M W) Without RFB With RFB
0 10 20 30 40 50 60 70 80 90 100 -1.5 -1 -0.5 0 0.5 1 1.5 2 2.5x 10
-3 X: 90.05 Y: 0.00216 time, s P G H Y D e v ia ti o n ( p u M W) Without RFB With RFB
0 10 20 30 40 50 60 70 80 90 100 -0.5 0 0.5 1 1.5 2 2.5x 10
-3 X: 89.51 Y: 0.001208 time, s P G G D e v ia ti o n ( p u M W) Without RFB With RFB
0 5 10 15 20 25 30
-16 -14 -12 -10 -8 -6 -4 -2 0 2x 10
[image:4.595.58.266.444.701.2] [image:4.595.328.538.459.597.2]reveals that generators respond according to the SLP levels in order to match the total power generation with load demand. Thus, all the dynamic responses are satisfactory and PSO based PI controller is robust.
[image:5.595.65.263.344.506.2]Fig. 10: Power output of thermal generating unit for 1%-3% SLP variation
Fig. 11: Power output of hydro generating unit for 1%-3% SLP variation
6.
CONCLUSION
LFC of a multi-source power system with RFB is presented using efficient PSO technique. PSO based PI controller is used in the secondary loop of the LFC system. The dynamic responses are obtained in wake of 1% SLP in the area. The dynamic responses have been obtained with and without consideration of RFB in the LFC system. Examination of dynamic responses shows that application of RFB improves the transient responses greatly; however settling time remains approximately same. The percentage improvement in the frequency overshoot becomes 72. The total sum of the generation at steady state matches the desired value 0.01 pu MW. Further, dynamic responses have been obtained by varying the SLP levels from 1% to 3%. The overshoot increases with the increase in SLP level and the settling time remains same.The PSO based PI controller is robust and performs well under the wide range of load disturbances. All the simulation results are as per the requirements of the LFC system.
APPENDIX A
Power System Parameters
0
2000 (Rated capacity of the area ) 1740 MW (Nominal load of the area) 60 Hz,
5 MWs/MVA 0.0145 pu MW/Hz,
68.9655 Hz/pu MW, 11.49 s,
0.06 s, 0.3 s, 2.4 Hz/puMW, rt L PS PS SG T
TH HY G
P MW P f H D K T T T
R R R
1.1s, 5s, 28.75s, 0.2s, 0.6s, 1s,
1, 0.05s, 0.23s, 0.01s, 0.2s 1.8, 0 W RS RH GH G G
g g F
CR CD RF D T T T T X Y
c b T
T T
K T s
7.
REFERENCES
[1] Kothari DP, Nagrath IJ. Modern power system analysis. 4th ed. New Delhi: Tata McGraw Hill; 2011.
[2] Elgerd OI. Electric energy system theory: an introduction. 2nd ed. New York: McGraw Hill; 1983. [3] Kundur P. Power system stability and control. 5th
reprint. New Delhi: Tata McGraw Hill; 2008.
[4] Bevrani H. Robust power system frequency control. New York: Springer; 2009.
[5] Ibraheem, Kumar P, Kothari DP. Recent philosophies of automatic generation control strategies in power systems. IEEE Trans Power Syst 2005;20(1):346–57.
[6] Parmar KPS, Majhi S, Kothari DP. Automatic generation control of an interconnected hydrothermal power system. In: IEEE conference on proceedings, INDICON. 0 10 20 30 40 50 60 70 80 90 100
0 0.005 0.01 0.015 0.02 0.025 time, s P G T H D e v ia ti o n ( p u M W) 1% SLP 2% SLP 3% SLP
0 10 20 30 40 50 60 70 80 90 100 -1 0 1 2 3 4 5 6 7x 10
-3 time, s P G H Y D e v ia ti o n ( p u M W) 1% SLP 2% SLP 3% SLP
0 10 20 30 40 50 60 70 80 90 100 -0.5 0 0.5 1 1.5 2 2.5 3 3.5
4x 10
[image:5.595.62.263.555.720.2]output feedback method. In: IEEE conference on proceedings, PEDES. New Delhi, India; 2010.
[8] Yazdizadeh A, Ramezani MH, Hamedrahmat E. Decentralized load frequency control using a new robust optimal MISO PID controller. Int J Electr Power Energy Syst 2012; 35:57–65.
[9] H. Shayeghi, H. A. Shayanfar. Application of ANN technique for interconnected power system load frequency control. Int J Eng., vol. 16, no. 3, pp. 247 – 254, 2003.
[10]S. Ramesh, A. Krishnan. Fuzzy rule based load frequency control in a parallel AC-DC interconnected power system through HVDC link. International Journal of Computer Applications, vol. 1, no. 4, 2010.
[11]C. S. Chang, W. Fu. Area load frequency control using fuzzy gain scheduling of PI controllers. Electr Power Syst Res, vol. 47, pp. 145 – 152, 1997.
[12]E. Cam, I. Kocaarslan. Load frequency control in two area power system using fuzzy logic controller. J. Energy Conversion and Management, vol. 45, pp. 233 – 245, 2005.
[13]P. Bhatt, R. Roy, and S. Ghoshal. GA/particle swarm intelligence based optimization of two specific varieties of controller devices applied to two-area multi-units automatic generation control. Int. Journal of Electrical Power and Energy Syst., vol. 32, no. 4, pp. 299 – 310, May 2010.
[14]Sudha KR, Santhi RV. Robust decentralized load frequency control of interconnected power system with generation rate constraint using type-2 fuzzy approach. Int J Electr Power Energy Syst 2011;33:699–707. [15]Chandrakala KRMV, Balamurugan S, Sankaranarayanan
K. Variable structure fuzzy gain scheduling based load frequency controller for multi-source multi-area hydro thermal system. Int J Electr Power Energy Syst 2013;53:375–81.
[16]Panda S, Yegireddy NK. Automatic generation control of multi-area power system using multi-objective non-dominated sorting genetic algorithm-II. Int J Electr Power Energy Syst 2013;53:54–63.
[17]Bevrani H, Hiyama T. Intelligent automatic generation control. New York: CRC Press; 2011.
[18]A M Hemeida. A fuzzy logic controlled superconducting magnetic energy storage, SMES frequency stabilizer. Electrical Power and Energy Systems, vol.80, pp.651–6, 2010
[19]KR Sudha, RV Santhi. Load frequency controls of an interconnected reheat thermal system using type-2 fuzzy system including SMES units. Electrical Power and Energy Systems, vol.43, pp. 1383–92, 2012.
[20]SK Aditya, and D Das. Battery energy storage for load frequency control of an interconnected power system. Electric Power Systems Research, vol. 58 (3), pp.179– 85, 2001.
[21]P Bhatt, SP Ghoshal, R Roy. Load frequency stabilization by coordinated control of Thyristor controlled phase shifters and superconducting magnetic energy storage for three types of interconnected two-area
power systems. Electrical Power and Energy Systems, vol. 32, pp.1111–24, 2010
[22]N Tokuda. Development of a redox flow battery system. Japan Society of Energy and Resources, Conf. of energy system and economy and environment, 1998.
[23]Enomoto K, Sasaki T, Shigematsu T, Deguchi H. Evaluation study about redox flow battery response and its modeling. IEEJ Trans Power Eng , vol. 122-B(4), pp.554–60, 2002
[24]I.A. Chidambaram, B. Paramasivam. Genetic Algorithm Based Decentralized Controller for Load- Frequency Control of Interconnected Power Systems with RFB Considering TCPS in the Tie-Line. International Journal of Electronic Engineering Research, Vol. 1 (4), pp. 299– 312, 2009
[25]I.A. Chidambaram, B. Paramasivam. Optimized load-frequency simulation in restructured power system with Redox Flow Batteries and Interline Power Flow Controller. Electrical Power and Energy Systems, vol. 50, pp. 9–24, 2013
[26]Tyagi B, Srivastava SC. A decentralized automatic generation control scheme for competitive electricity markets. IEEE Trans Power Syst 2006;21(1):312–20. [27]Tyagi B, Srivastava SC. A LQG based load frequency
controller in a competitive electricity environment. Int J Emerging Elect Power Syst (online) 2005:2. <http://www.bepress.com/ijeeps/vol2/iss2/art1044>. [28]Ramakrishna KSS, Bhatti TS. Automatic generation
control of single area power system with multi-source power generation. Proc IMechE: J Power Energy 2008;222(A):1–11.
[29]Ramakrishna KSS, Sharma P, Bhatti TS. Automatic generation control of interconnected power system with diverse sources of power generation. Int J Eng Sci Technol 2010;2(5):51–65.
[30]Challa KK, Rao PSN. Analysis and design of controller for two area thermal-hydro- gas AGC system. In: IEEE conference on proceedings, PEDES. New Delhi, India; 2010.
[31]Parmar KPS, Majhi S, Kothari DP. Load frequency control of a realistic power system with multi-source power generation. Int J Electr Power Energy Syst 2012;42:426–33.
[32]Parmar KPS, Majhi S, Kothari DP. LFC of an interconnected power system with thyristor controlled phase shifter in the tie line. Int J Comput Appl 2012;41(9):27–30.
[33]Parmar KPS, Majhi S, Kothari DP. Improvement of dynamic performance of LFC of the two area power system: an analysis using MATLAB. Int J Comput Appl 2012;40(10):28–32.
[34]IEEE power engineering systems committee report. Dynamic models for steam and hydro turbines for power systems studies. IEEE Trans Power App Syst 1973;PAS-92.
[36]Working group on prime mover and energy supply models for system dynamic performance studies. Dynamic models for combined cycle plants in power system studies. IEEE Trans Power Syst 1994; 9(3):1698– 708.
[37]J. Kennedy, R. Eberhart. Particle swarm optimization. Proceedings of IEEE Int. Conf. on Neural Networks, vol. 4, pp. 1942-1948, 1995
[38]Y. Shi, R. Eberhart. A modified particle swarm optimizer. Proceedings of IEEE Int. Conf. on Evol. Comput., pp. 69-73, 1998
[39]Y. Shi, R. Eberhart. Empirical study of particle swarm optimization. Proceedings Congr. Evol. Comput., NJ, pp. 1945-1950, 1999