STATISTICAL BASED OUTLIER DETECTION IN DATA
AGGREGATION FOR WIRELESS SENSOR NETWORKS
1U.BARAKKATH NISHA, 2 N.UMAMAHESWARI, 3 R.VENKATESH, 4 R.YASIR ABDULLAH 1Asstt Prof., Department of Computer Science, PSNA CET, Dindigul-624 622, India
2
Prof., Department of Computer Science, PSNA CET, Dindigul-624 622, India
3
Prof., Department of Information Technology, PSNA CET, Dindigul-624 622, India
4
Asstt Prof., Department of Computer Science, SSCET, Palani-624 601, India
E-mail: [email protected], [email protected]
ABSTRACT
Inconsistent data caused by compromised nodes in Wireless Sensor Networks can be detached to improve data reliability, accuracy and to make effective and correct decisions. Multivariate Outliers normally describe the data behavior abnormality. Data aggregation is frequently used for the reduction of communication overhead and energy expenditure of sensor nodes during the process of data collection in Wireless Sensor Networks and also to improve the lifetime of the WSN. For the delivery of accuracy in base station, the outlier detection protocol must be incorporated with secure data aggregation. Aggregation will also try to increase the circle of knowledge and the level of accuracy. In this paper we use multivariate data analysis technique, data to handle outlier in correlated variables. To achieve the reliability and accuracy, a two phase algorithm is proposed. First, to build up a well conditioned PCA model for fault detection. Second, we use various statistical techniques to determine similarity between the sensed data against the real data set. We have evaluated our algorithm based on synthetic and real data injected with synthetic faults collected from a WSN. Our results concludes that the proposed algorithm achieves high true alarm rate and low false alarm rate and outperforms all the existing methods in terms of data accuracy and reliability.
Keywords: Wireless Sensor Network (WSN), Aggregation, Multivariate Outlier, Well Conditioned PCA,
Mahalanobis Distance (MD), Minimum Volume Ellipsoid (MVE), Minimum Covariance Determinant (MCD), Minimum Generalized Variance (MGV)
1.
INTRODUCTIONWireless sensor networks (WSN) have a large number of sensor nodes with the ability to communicate among them and also to a base station. WSN comprises of large number of tiny sensor nodes that have limited power, bandwidth, and number of computational capabilities [1] [2]. These inherent limitations of sensor nodes can make the network more vulnerable to faults and malicious attacks. Due to the deployment nature of WSN, sensor nodes are highly vulnerable to many physical attacks, hardware failure and environment related sources. However, in this paper we concentrate on false data detection. False data can be injected by compromised sensor nodes in various ways, including data aggregation and relaying. Outlier detection is an important problem
[3]. The current outlier mining approaches can be classified in five categories: Statistical based, nearest-neighbor based, clustering based, classification based, and spectral decomposition based. Outlier detection approaches are attracting more attentions for accurate reliable outlier detection[8]. Since sensor nodes are energy constrained, it is inefficient for the entire sensor to transmit the data directly to the base station. Due to some harmful environment condition data generated from neighbor sensors is highly correlated [4][5]. In order to reduce the energy consumption as well as redundant data elimination, data aggregation process is used. In this paper we propose an efficient multivariate outlier detection method using correlated variable relationships algorithm must be incorporated with data aggregation in order to make it distributed and robust against outliers. Towards this direction, in this context, aggregator does the role of determining multivariate outlier during aggregation process. This algorithm identifies abnormal sensor node and send report to the base station. Base station broadcast the sensor ID to entire WSN and will not use the inconsistent information that is collected by the compromised node. The rest of this paper is organized as follows. Section 2 reviews the body of related work, and Section 3 describes system architecture and Network model with assumptions, and Section 4 discusses our multivariate outlier detection algorithm. Section 5 describes the details of proposed methodology. Section 6 presents the Implementation and Performance comparisons simulation results, and Section 7 concludes this paper.
2.
RELATED WORKOutlier detection is an important problem for many domains. Outlier detection algorithms are founded upon statistical modeling techniques either by prior knowledge based or prior knowledge free. The knowledge regarding outlier detection often consists of assumption and experience. A prior knowledge free scheme allows performing detection without any related knowledge in advance. The authors in [11] conclude prior knowledge based scheme are generally good at detecting outlier that closely correlates to their known knowledge. Outlier detection in Wireless sensor networks survey introduced by yang et al. (2010) [ 12] is a very systematic and technical survey describes the challenges of designing effective outlier detection techniques to motivate researchers to find solutions for such challenges.
A lot of research work has been carried out in data aggregation, anomaly detection but only few studies have incorporated data aggregation with outlier detection. In [13] random sampling mechanisms and interactive proofs are used to check the correctness of data aggregation in base station. In [14] sensor nodes first send data aggregators the characteristics of their data to determine which sensor nodes having distinct data send their encrypted data.
In [15], a spatial-temporal correlation analysis is proposed to detect outliers in the collected data. This method is based on correlation coefficient tests between neighbor nodes. Detection is achieved with collaboration between the nodes so as to isolate the compromised nodes. In [16], the authors propose an aggregator node election mechanism that aims at load balancing too. According to this mechanism, the network is partitioned into equally sized sectors, wherein the aggregator nodes- that are selected considering correlation-collect the data from their children in case an event occurs.In [17], the authors employ PCA (principal component analysis) in order to detect the misbehavior of the nodes and filter out their measurements. However the paper assumes a special network topology with more powerful primary nodes that, at same time, cannot be compromised. Moreover, prior assumption in PCA is that most important components are those that have a high variance in their values.
A multivariate statistical technique called Canberra [18] is used for intrusion detection. The method does not suffer from normality assumption of the data. However their experiments showed that the Canberra technique performed well only in case where all the attacks were placed together. In [19], the author describes anomaly detection based on hotelling’s T test that detects both counter relationship anomalies and mean-shift anomalies.
From the literature survey most of the existing work has been done on univariate outlier detection. Our approach focuses on the efficient detection of multivariate outliers throughout a sensor network in a distributed manner and is based on different multivariate analysis techniques.
3.
SYSTEM ARCHITECTURE AND NETWORK MODEL3.1 System Architecture
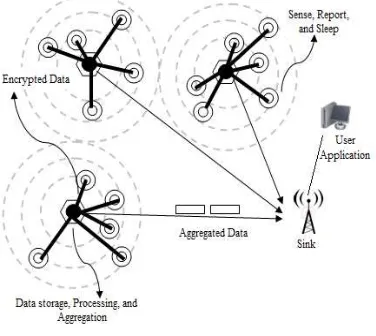
[image:3.612.100.288.495.663.2]In this research we assume the set of sensor nodes are randomly deployed in the square field to continuously monitor the phenomenon under inspection. The concept of data aggregation is to combine the data arriving from different data centric routing sources along the way. This allows one to eliminate redundancy, minimize the number of transmissions and in turn be parsimonious with energy consumptions. Data aggregation reduces the number of messages transmitted leading to a significant decrease in energy consumption due to communication [9] [10]. However nodes have different network attributes in which large number of low cost light weight wireless devices (that simply sense the environment changes) and a few energy rich devices (that serves as cluster heads in data aggregation and in network processing) coexist. We know that in LEACH algorithm [6] [7], each node randomly decides to become a CH once a node decides to become a cluster head, it aggregates the data received from various nodes inside the cluster and send in to the base station. However completely independent random CH select can’t guarantee the number of distributed of CH in each round. In this paper we use three level of hierarchy structure system model, which divides nodes into three categories. Base station (BS), Cluster head node (CH) or actor node and other common sensor nodes (SN). However, the ratio of number of sensor nodes to an actor node is limited and user specified. Following Figure1 show the System architecture.
Figure 1: System Architecture
Assumption:
Some of the main assumptions in this study are • The WSN is a very dense composed of a
large number of sensors.
• Nodes are uniformly distributed. Sensor nodes and base station are stationary after deployment.
• Actor nodes are not compromised. Sensor nodes are compromised.
• Falsified data injected by compromised nodes are significantly different from real values.
• Assume that BS and aggregators employ a secure mechanism to enable an authenticated broadcast to all the nodes in the network.
3.2 Network Model
We consider a distributed heterogeneous WSN; where large number of low cost sensor nodes senses the physical phenomena and the few energy rich actor nodes perform outlier detection with data aggregation. Each cluster has an actor node Ai,j and set of sensing nodes Si,j Where, Ai,1,A i,2 ….. Ai-1,j Ɛ Ci,j and Si,1,S i,2 ….. Si-1,j Ɛ Ci,j. We assume that sensor nodes are uniformly deployed in C. Node density is obtained from ρ = n/C, where n denotes number of nodes and C the network area. When sensor nodes absorb particular phenomena it transmits the information to the nearby actor node. The actor node processes all incoming data and initiates an appropriate response and relays the information to the sink. The network area C is grouped into number of clusters. Within a cluster CLi , each actor node Ai has n spatially correlated sensor nodes represented by S(I,j)n = { Si,1 , Si,2, ……Si,n ; i=1,2…..n } (ie) C(CLi) = { Si,j Ɛ CLi } ǀ (SI,j, and AI,j Ɛ ED) The network topology is modeled as undirected graph G where G = (CL, ED).At every time interval ȶ each sensor nodes in the cluster CLi measures a data vector. Our aim is to perform real time detection and isolation of anomalous data in the multivariate data received at Ai,j
4.
MULTIVARIATE OUTLIER DETECTIONData obtained from sensors are often missing, corrupted by noise or affected by node failures. Hence the accuracy of data gets affected. Therefore those outliers must be detected. Multivariate outliers are those that deviate from the usual correlation structure in multi-dimensional space defined by the variables [20] [22].
Univariate statistics, such as Grubbs, Dixon, Walsh, t-test and range method (mean ± n x stndev) are quite commonly used to detect outlying values. Main drawback of univariate statistical method is analyzing the variable relationships with the sample sets [21]. With data on a single attribute; univariate outlier detection method performance is good. With many attributes, the situation becomes complicated, in high dimensional data set, outliers that do not appear as outlying observations in univariate criterion. Thus in order to increase outlier detection rate, all attributes need to be considered together using a multivariate outlier detection approach.
Multivariate is used to detect outlier based on correlation i.e by identifying relationship among the variables that are participated in the outlier detection process. A major problem in detecting outliers in multivariate data is that an observation is not extreme in any of the original variables. There are several proposed idea for detecting outliers in multivariate data. The traditional method for detection of outliers is known as mahalanobis distance, a large distance may indicate that the corresponding observation is an outlier.
4.1 Well Conditioned PCA Model
Principal Component Analysis (PCA) is a multivariate statistical technique and is often used to reduce the dimension of data. The principal components are computed from the covariance matrix or the correlation matrix, but results from the covariance and correlation matrix are usually not the same [24] [25].
Traditional PCA models have several shortcomings. One is that naive methods for finding the principal component directions have trouble in high dimensional data sample. Consider attempting to diagnose the covariance matrix of n vectors in a space of d dimensions. Covariance matrix computation complexity requires O (nd2) operations. To solve the drawback of standard PCA, a well conditioned PCA model is proposed. In this paper we propose an efficient multivariate outlier detection method such as agile-PCA using correlated variable relationships and is augmented with various distance measure techniques to detect and isolate the abnormal data.
To achieve dimensionality reduction on a dataset, the correlation matrix and its eigen values and eigen vectors must be found first, next, the dataset is projected onto the subspace spanned by
the eigen vectors belonging to the largest eigen values [26].
Let us consider a data matrix X= [x1,x2,…. xn ]
be a sample of multivariate normal distribution., which gathers n measurements collected from various sensor nodes.
Variance covariance matrix δm is
For n random sample i.e x1,x2,…. xn. if (λ1,e1),(λ2,e2),……(λn,en) where λ1≥ λ2≥ …. λn ≥ 0 are the n eigen value, eigen vector pairs of δm then the ith principle component is
Where ∆ is the correlation matrix of standardized vector Z, which normalizes the covariance matrix by standardization.
Where is the diagonal standard deviation and
be the sample mean
In variance- covariance matrix, any two eigen vectors ei and ek
Since eigen vectors of ∆ are
orthogonal λ1≠λ2≠ …. λn In matrix notation Where
Traditionally, PCA is based on the extraction of eigen vectors from the covariance matrix of a sample data set. The covariance matrix can only be used when the measurements (variables) are all of the same type and have low variances. To counterfeit the shortcomings of utilizing covariance matrix, we advocate using correlation matrix in place of covariance matrix, which normalizes the covariance by Z score vector.
matrix of PC’s for detecting outlier is to combine information from selective number of PC’s in order to form a new statistics. Kaiser rule is used to select the number of PC’s from PCA method [23].
The Kaiser rule is to drop all components with eigen values under 1.0. The Kaiser criterion is the default method for detecting number of PC’s .The PCA model partitions the measurement space into two orthogonal spaces:
• The principal component space, which includes data variations according to the principal component model.
• The residual space, which includes data variation not explained by the model. Such variations are due to noise and model errors in the data.
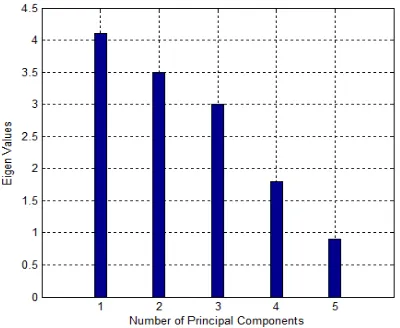
[image:5.612.349.496.261.331.2]Figure 2 is a plot of the eigen values versus PC’S and is used to help to choose the number of PC’s to keep in the model. The size of the eigen value equals the amount of variance explained in the corresponding PC. We will keep 3 PC’s that explain 99.91% of the variance.
Figure 2: Eigen Values versus Principal components
4.2 Mahalanobis Distance
The most commonly recommended approach for multivariate outlier detection is mahalanobis distance (MD), which is based on a measure of multivariate distance [27]. It identifies outliers based on the measure of full dimensional distance between a point and its nearest neighbor in the dataset. Using the Mahalanobis distance to label the data, an outlier is considered to be a measurement whose MD is larger than a certain threshold. This
threshold is defined as the average value of the MD values.
Let D(x) be N random sample data set with correlated variables x1,x2,…. xn
where T is tuple function operates on different time interval and S is full sample data set. Mahalanobis distance is given by the following formula.
Where be the sample mean and δm is the sample standard deviation of D(x).
It is a useful way of determining the similarity of a set of values from an unknown sample to a set of values measured from a collection of known samples. Furthermore, for N d-dimensional points from a normal distribution, the square of Mahalanobis distance follow a chi-square distribution ( ) with d degree of freedom. Thus,
an outlier in multivariate data is a point whose Mahalanobis distance is larger than a pre-defined threshold. Assume that the independent variables as defining a multidimensional space in which each observation can be plotted. The mean point in the multidimensional space is also called centroid.
The mahalanobis distance is a distance of a vector from the centroid in a multidimensional space, defined by the correlated independent variables. If the independent variables are uncorrelated it is the same as the simple Euclidean distance. Thus this measure provides an indication of whether or not an observation is an outlier with respect to the independent variable values. There are two steps in outlier Detection: First, compute mean vector and variance, covariance matrix δm. Second, MD (xi) is distributed as chi-square d with d degree of freedom. Here xi is regarded as outlier if MD (xi) > estimating mean and
variance covariance matrix may suffer from distortion caused by outlying sensor node xi.
[image:5.612.94.294.399.563.2]To cope with outliers the most commonly used approaches in statistics replace the standard estimation of the two covariance matrix δm, with robust estimator of the covariance matrix S*. This formulation weights the mean and the outer products which form the covariance matrix. Calculating the eigen values and eigen vectors of this robust covariance matrix gives eigen values that are robust to sample outliers. The mean and the robust covariance can be calculated as
Where and are scalar
weights, which are a function of the mahalanobis distance
4.3 Minimum Volume Ellipsoid
One of the earliest of alternative approach to outlier detection was the Minimum Volume Ellipsoid (MVE), developed by Rousseeuw (1985). It is used to detect outliers in multidimensional data. In concept, the goal behind this method is to identify a subsample of observations of size h that creates the smallest volume ellipsoid of data points, based on the values of the variables. Subsamples of approximately 50% of the observations are examined to find the subsample that minimizes the occupied by the data [28]. The best subsample (smallest volume) is then used to calculate the covariance matrix. The MVE estimator is the center and the covariance of a subsample size h (h≤n) that minimizes the volume of the covariance matrix associated to the subsample. Formally,
Where i= {set of h instances k such that # (k) =h}
and MDi
represents the Mahalanobis distance of the jth instance in Sk. The value of h can be treated as the minimum number of instances which must not be outlying and h= [(n+p+1)/2], is the greatest integer function and p is the number of predictor.
By definition, this ellipsoid should be free of outliers, and estimates of central tendency and
dispersion would be obtained using just this subset of observations. The MVE approach to dealing with outliers can, in practice, be all but in tractable to carry out as the number of possible ellipsoids to investigate will typically be quite large. Therefore, an alternative approach is to take a large number of random samples of size h with replacement, Where h= [(n/2) +1] and calculate the volume of the ellipsoids created by each. The final sample to be used in further analyses is that which yields the smallest ellipsoid. An appropriate cut-off value is then estimated, and the observations with distances that exceed that cut-off are declared to be outliers.
4.4 Minimum Covariance Determinant
The MCD estimator is a robust estimator to estimate the location and shape of the clusters. Points that are outliers with respect to a particular cluster will not be involved in the location and shape calculations of that cluster, and points that are outliers with respect to all clusters will not be involved in the calculations of any clusters. The difference between the single population case and the multiple cluster case is that, in the latter, MCD samples need to be computed for each cluster. This important difference leads to a need for a good robust starting point in the clustering situation. The MCD estimator is defined by
Where i={set of h instances k such that #(k)=h}
4.5 Minimum Generalized Variance
One potential difficulty with both MVE and MCD is that they tend to identify a relatively large number of outliers when the variables under examination are not independent of one another .A third approach for outlier detection that was designed to avoid this problem is the Minimum Generalized Variance (MGV).MGV is based on a similar principle to MCD in that the set of data with the smallest over all variance is identified [31]. However, rather than relying on the random addition of observations to the core dataset to be retained, it includes those individuals whose inclusion increases the generalized variance as little as possible. As with MVE and MCD, MGV is an iterative procedure. In the first step the t most centrally located points are identified using a non-parametric estimate of Di which is calculated as Di
which is calculated as
Where
In other words, MAD, the median absolute deviation, is the median of the deviations between each individual data point and the median of the dataset, M. The most centrally located observations are those with the smallest value of Di as calculated
above. These points are then placed in a new dataset, after which the generalized variance associated with adding each of the remaining observations not originally placed in this new data is calculated. The observation with the smallest
generalized variance is then added to the new dataset. For each data point remaining outside of the new dataset, the generalized variance is recalculated, accounting for the new observation that was just added. Once again, the observation with the lowest generalized variance is then added to the new dataset. This process is repeated until all of the original data points are included in the new dataset; i.e., the new dataset is identical in terms of membership to the old one. However, now each observation has associated with it a value for the generalized variance [32]. Observations that are more distant from the bulk of the data will have larger values of the generalized variance. For t=2 variables, observations with a generalized variance greater than
would be considered outliers, where q1 and q2 are the lower and upper quartiles, respectively, of the generalized variances. For more than two variables, the generalized variances are compared with
,
Where is the median of the generalized
variance values and
5.
PROPOSED METHODOLOGYIn this paper, we propose a new method combining well conditioned principal component analysis with mahalanobis distance, robust mahalanobis distance, MVE, MCD, and MGV for multivariate outlier detection. Our proposed technique permits the actor node in network to identify the new arriving data measurements from its members as normal or abnormal. Our proposed approach based on correlation among the attributes that are measured by sensor node. Generally, there are two types of dependencies exists among each sensor node.
1. Dependencies among the attributes of the sensor node.
2. Dependency of sensor node readings on history and neighbor node readings.
Voltage of mote determines the accuracy of the value that is sensed. Here the relationship between the voltage and the other variables is probability affecting the other variables by the voltage levels. This is same in case of temperature, humidity and pressure.
Figure 4: Correlation among attributes
V-Voltage,L-Light,P-Pressure,H-Humidity,T-Temperature
Using the naturally existing correlation among the sensor attributes, the aggregator can efficiently detect the outliers.
The proposed framework model is illustrated in Figure 5. Initially, perform a well conditioned PCA on the real data set and determine the model by a proper selection of the number of PC. After that five different consolidation techniques are combined with a well conditioned PCA for detecting outlier. Finally, Multivariate outlier detection block decides a confident decision of outlier detection from the various classification techniques. The five techniques provides a set of hypothesis hMD(t), hRMD(t), hMVE(t), hMCD(t), hMGV(t).Outlier Detection (OD) = { hMD(t)+ hRMD(t)+ hMVE(t),+ hMCD(t)+ hMGV(t)}. The outlier detection block outputs a hypothesis equal to ‘‘1’’, meaning that the measurement provided by the node was classified as being erroneous and “0” meaning that the consistent data was provided by the node.
Figure 5: Proposed framework model
6.
RESULTS AND DISCUSSIONIn this section, we evaluated the performance of the proposed integration of PCA with mahalanobis distance, robust mahalanobis distance, Minimum volume ellipsoid, Minimum covariance determinant and minimum generalized variance for multivariate outlier detection. The performance is evaluated, for both synthetic and real data. Real data sets collected from Intel research laboratory at Berkeley [33]. Experiments were carried out using a set of humidity ranging from 0% to 100%, light in Lux, temperature in degree, voltage in volts and pressure readings obtained from a 54 Mica2Dot sensor at different time interval.
In our experiments to simulate cluster based multivariate outlier detection method, this paper uses MATLAB as the experiment platform. The test area is a square plane of 250m by 250m with 500 nodes distributed uniformly. After node deployment using LEACH protocol cluster formation is developed overall cluster size is 10%. Each node has a unique ID number to distinguish it from other nodes. Synthetic data collected from various sensor nodes injected by various levels of synthetic faults. For evaluation of the effectiveness of the outlier detection algorithm, we measure two performance metrics,
The performance of PCA with the various classification techniques is analyzed with receiver operating characteristics (ROC), where the quality goal is to maximize the true alarm rate and minimize the false alarm rate.ROC comparison was done for all proposed approaches in different rate of compromised nodes. Figure 6 shows the ROC curve for different outlier percentages. In each case compromised sensors will report faulty readings according to the data contaminated level. From the figure 6, it is clear that the proposed method offers the true alarm rate greater than 90% on an average when 10% of the nodes in the network are found to be compromised.
[image:9.612.314.535.403.596.2]Figure 6: False Alarm Rate versus True Alarm Rate for various outlier percentages
Figure 7 shows the performance comparison between the methods proposed in the paper under different corruption level. In fact, when contamination levels continued to increase, there was actually a decrease in the number of outliers detected. The minimum volume ellipsoid (MVE) approach proved to be superior to the mahalanobis distance approach in all cases where outliers were present.
When data alteration level is less than 50% mahalanobis distance maintain good performance and with increase of data alteration level its true alarm rate declines rapidly.
Figure 8 shows the comparison graph for false alarm rate against outlier percentage to detect misclassification of normal data as outliers using the three methods. From the graph it is inferred that
false alarm is almost zero for MGV and MVE. MCD shows some value of false alarm rate till 20% of outlier. MGV and MVE shows false alarm rate after 30% outlier data.
Figure 7: Data Alteration level versus True Alarm rate
Figure 8: Outlier percentage versus False Alarm Rate
Figure 9: False Alarm Rate versus True Alarm Rate
7.
CONCLUSIONIn this paper, we introduced the development and implementation of a new scheme to improve the reliability and accuracy of data by collected from the wireless sensor network. In this paper, we proposed a novel method based on various classification techniques. To determine well conditioned PCA model which combines with five classification techniques, we effectively detect anomalous data with the accuracy of 89 % based on the correlation exist among the sensor nodes. Experimental research shows that our approach gives better performance for contaminated data by demonstrating that the proposed algorithm achieves high true alarm rate and low false alarm rate and outperforms existing methods in terms of data accuracy and reliability. Our future work includes deploying Wireless sensor networks in weather monitoring systems for identifying incorrect data.
REFRENCES:
[1] Akyildiz.,I.F.,, W.Su, Y.Sankarasubramaniam and E.Cayirci, “Wireless Sensor Networks: A Survey”, Computer Networks, Vol. 38, No. 4, 2002, pp. 393–422, DOI 10.1016/S1389-1286(01)00302-4
[2] Chandola,V., A.Banerjee and V.Kumar, “Anomaly Detection: A Survey”, ACM Comput.Surveys.DOI:10.1145/1541880.1541 882.
[3] Rajasegarar, S., C. Leckien and M. Palaniswami, “Anomaly Detection in Wireless Sensor Networks”, IEEE Wireless
Commun., 15;34-40.DOI:
10.1109/MWC.2008.4599219.
[4] Piers,W.R.,T.H.De Paula Figueiredo, H.C.Wong and A.A.F. Loureiro , “Malicious node detection in Wireless Sensor Networks”, Proceedings 18th Interanational, Parallel and
Distributed Processing
Symposium,(PDS’04),pp:1-7.
[5] Y.Zhang, N. Meratina, and P. J. M. Havinga, “Outlier Detection Techniques for Wireless Sensor Network: A Survey”, IEEE Commun. Surveys Tutorials, 12: 159-170.DOI: 10.1109/SURV.2010. 021510.00088
[6] Elena Baralis,Taina Cerquitelli,Vincenzo D’Elia.et al,2007.”Modelling a Sensor Network by Means of Clustering”, 18th International Workshop on Database and Expert Systems Application (DEXA’07), pp. 177-181.
[7] Sunhee Yoon and Cyrus Shahabi, “The Clustered Aggregation technique leveraging spatial and temporal correlations in wireless sensor Networks”, 2007. Vol. 3(1).
[8] Chitra Devi.N, Palanisamy .V, Baskaran.K and Nisha.U.B, 2010. “Outlier aware Data Aggregation in Distributed Wireless Sensor Network using Robust Principal Component Analysis”, Second International Conference on Computing, Communication and Networking Technologies, IEEE Xplore, pp. 1-9.
[9] Mohamed Watfa , William Daher and Hisham Al Azar , “A Sensor Network Data Aggregation Technique”, International Journal of Computer Theory and Engineering Vol. 1, No. 1, April 2009
[10] S. Brown, C.J. Sreenan,“A Study on Data Aggregation and Reliability in Managing Wireless Sensor Networks”, Proc. Of IEEE International Conference on Mobile Adhoc and Sensor Systems (MASS) - Workshop on Protocols and Algorithms for Reliable and Data Intensive Sensor Networks, October 2007
[11] Miao Xie, Song Han, Biming Tian, Sazia Parvin, “Anomaly Detection in Wireless Sensor Networks:A Survey” Journal of Network and Computer Applications. Volume 34 Issue 4, July, 2011. Pages 1302-1325 [12] Yang, Z.N.Meratnia and P.Havinga,“Outlier
Detection Technique for WSN: A Survey”,
IEEE Communication Surveys
[13] Bartosz Przydatek, Dawn Xiaodong Song, Adrian Perrig, “SIA: secure information aggregation in sensor networks”. In proc- SenSys – 2003:pp 255-265
[14] H. Cam, S. Ozdemir, P. Nair, D. Muthuavinashiappan, H. O. Sanli, "Energy-Efficient Secure Pattern Based Data Aggregation for Wireless Sensor Networks", Computer Communications, Vol. 29, No. 1, Elsevier, Dec. 2005.
[15] S.Tanachaiwiwat and A.Helmy “Correletion analysis for alleviating effects of inserted data in WSN” in proc. Mobile and ubiquitous sys: Networking Services, 2005. pp 97-108. [16] Y.Zhu, R.Vedantham, S.Park, R.Sivakumar,
”A Scalable Correlation aware Aggregation Strategy for WSN”, in Proceedings of the first International Conference on Wireless Internet (WICON),2005.
[17] Chatzigiannakis, S.Papavassiliou, “Diagnosing Anomalies and Identifying Faulty nodes in Sensor Networks”, IEEE Sensors Journal, Vol.7, No.5, May 2007. [18] S.M Emran and N. Ye, “Robustness of
Canberra Metric in Computer Intrusion Detection” , Proceedings of the 2001 IEEE workshop on Information Assurance and Security, United States Military Academy,West Point,NY,June 5-6,2001. [19] N.Ye,S.M.Emran,Q.Chen, and S.Vilbert,
“Multivariate Statistical Analysis of Audit Trails for Host-Based Intrusion detection” , IEEE Transactions on computers, Vol.51,No.7,July 2002
[20] Hair Anderson and Tatham Black, “Multivariate Data Analysis”, Dorling Kindersley, Pearson Education, 2006
[21] R.A. Johnson and D.W. Wichern, “Applied Multivariate Statistical Analysis”, Upper Saddle River, NJ: Prentice Hall, 1998
[22] Barnett, V. & Lewis, T. (1994). Outliers in Statistical Data, 3rd edition. John Wiley & Sons.
[23] Valle S., Weihua Li and Qin S.J., Selection of the Number of Principal Components: The Variance of the Reconstruction Error Criterion with a comparison to other methods, Ind. Eng. Chem. Res., 38, 4389-4401
[24] Yann et al., Distributed Principal Component Analysis for Wireless Sensor Networks, Journal of Sensor, 2008, 8(8), 4821-4850 [25] Sun, Y., and Daigel, J.N. (2006), A
PCA-based Vehicle classification system in wireless sensor networks, In Proceedings of
the wireless communications and networking conference, vol. 4, pp. 2193-2198
[26] Jollife, L.T., (1986), Principal Component Analysis, Springer-Verlag
[27] M. G. Kim, "Multivariate Outliers and Decompositions of Mahalanobis Distance," Communications in Statistics-- Theory and Methods, 29, 1511-1526, 2000.
[28] L. Davies, "The Asymptotics of Rousseeuw's Minimum Volume Ellipsoid Estimator," The Annals of Statistics, 20, 1828-1843, 1992. [29] R. W. Butler, P. L. Davies and M. Jhun,
"Asymptotics for the Minimum Covariance Determinant Estimator," The Annals of Statistics, 21, 1385-1400, 1993.
[30] D. M. Hawkins, "The Feasible Solution Algorithm for the Minimum Covariance Determinant Estimator in Multivariate Data," Computational Statistics & Data Analysis, 17, 197-210, 1994.
[31] D. M. Rocke and D. L. Woodruff, "Identification of Outliers in Multivariate Data," Journal of the American Statistical Association, 91, 1047-1061, September 1996. [32] Tabachnick, B.G., and Fidell, L.S. (2007).
“Using Multivariate Statistics.” Boston: Pearson Education, Inc.
[33] INTEL. 2004. The Intel Lab Data set
available at: