OPTIMIZATION ON SHORTEST PATH FINDING FOR
UNDERGROUND CABLE TRANSMISSION LINES
ROUTING USING GIS
1VISWARANI.C.D, 2VIJAYAKUMAR.D, 3SUBBARAJ.L, 4S.UMASHANKAR, 5KATHIRVELAN.J
1, 2, 4
School of Electrical Engineering, VIT University, Vellore, Tamilnadu, India
3
Institute of Remote Sensing, Anna University, Chennai, Tamilnadu, India 5 School of Electronics Engineering, VIT University, Vellore, Tamilnadu, India-632014
E-mail: 1 [email protected]
ABSTRACT
In cable trench construction, one of the tasks for engineers is to select a suitable route to minimize construction cost and obstructions. This paper discusses the development of a Geographic Information Systems (GIS)-based Customized system to automate the process of optimum shortest path finding for routing of underground power supply cable between any two substations. It combines the spatial analysis capabilities of GIS with the sophistication of one of the Artificial Intelligence technique “Simple Ant Colony Optimization” to deal with the complexity inherent in optimum shortest path finding. The results of this project are validated and compared with an inbuilt tool Network analyst of GIS software ArcGIS and explained in the Result and discussion of this paper. In this project only optimum shortest path finding is aimed and this will be one of the main input data in my future work of improving distribution efficiency using GIS.
Keywords: Geographic Information System (GIS), Ant Colony Optimization (ACO), Network Analyst
(ArcGIS), Electrical Distribution System
1. INTRODUCTION
In route planning of underground cable transmission line, as the path distance increases the cable cost and construction cost also increases. Hence this paper mainly focuses on finding shortest path for route planning of underground cable transmission line. The complexity of such problem is high due to many alternatives that have to be considered. The number of possible solutions is considerably high. Fortunately, many algorithms have been developed and discussed in order to find a shortest path to the optimized solution.
The previous works carried out by the various authors in route planning or corridors planning of transmission or distribution systems are studied.
In [2], shortest path is found for raster data and hence research is focused for average time taken by the ACO algorithm and the accuracy but in our paper we have used vector data. Determining the optimal set of alternatives for highway infrastructure facilities by using ant colony algorithm and GIS is discussed in [4]
The spatial nature of some of the aspects involved in power line routing leads to a
compromise between a straight line from one point to another and path deviation to avoid costly terrain, obstacles, or other intolerance criteria. The automation of the routing process integrates a detailed geographic modeling of the problem with information and expert knowledge in order to reduce both the time consumed and the gap between planning and erection and, therefore, to reduce efforts in the revision of the project [3]. Automated line design has been an active research field in the last decades, but most of the efforts have been made in the detailed sizing of all the elements of the new power line, and only a few references include approaches based on realistic geographic line routing. In early published works, GIS were identified as the proper computer platform to develop automated routing of underground residential distribution systems [3], [5].
Other approaches included a heuristic search algorithm for optimizing routes, reducing the space of feasible routing alternatives [6], or automating the search of the shortest path in street routes for underground feeder planning [7].
identify the areas that constitute an environmental
constraint and giving different qualitative weights to each constraint.
An automated distribution routing approach for rural areas was presented in [9], where the area studied to build a new electric line was divided into different cost regions according to the difficulty of building in each region. The obstacles or regions with high constraints to the construction of a new line were created as infinite cost regions. A further approach with the same methodology, but using GIS, was presented in [10].
A distinct approach, based on the representation of geographic data in raster format, was used in [11] for distribution system planning, although the routing problem was ignored.
The criterion for the selection of the optimal route for a new underground line is a function called impedance index [12], corresponding to a weighted length value of the proposed routes along the streets according to the characteristics of each segment of the route. In [13], a algorithm for the optimal feeder routing problem using the dynamic programming technique and GIS facilities is proposed.
A new methodology, based upon the Ant colony system (ACS) algorithm, is proposed [14] for the planning of electric energy distribution systems. The methodology is very flexible and calculates the location and the characteristics of the circuits minimizing the investment and operation costs while enforcing the technical constraints such as th transmission capabilities and the limits on the voltage magnitudes, allowing the consideration of a very complete and detailed model for the electric system.
Ant System -An analogy with the way ant colonies function has suggested the definition of a new computational paradigm, is proposed in [15]. It has a viable new approach to stochastic combinatorial optimization.
Mostly the conventional approaches rely on heuristic strategies and rules of thumb based on an individual's knowledge and experience gained from previous problem solutions in India. From the above survey the complexity of the problem involves the need to process spatial data such as road and circuit maps, public utility records, and construction plans. In the classic manual approach, it is difficult for the planner to identify the spatial relationship between different data layers which usually results in an over designed, costly and non-standardized solution. Which platform will help us to grid off from the above difficulties?
Geographic Information Systems (GIS), a technology for spatial data analysis, seems to have significant potential in solving these problems. GIS-ArcrInfo provides an internal macro language for
[image:2.595.307.524.184.351.2]users to automate their system design and the ability to interface with other application software. In this paper for the optimization of underground cable transmission lines Simple Ant Colony Optimization is used and implemented in GIS.
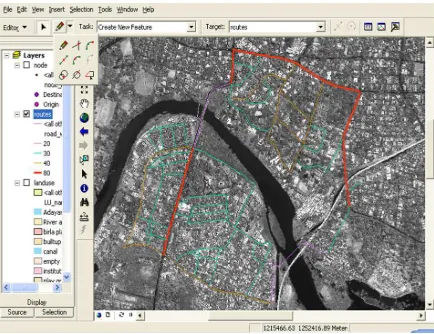
Figure 1: Study Area - Panchromatic image of IKONOS satellite with thematic layers for routes and its nodes
obtained after Route Network Analysis
2.RESEARCHMETHOD:
2.1Data Analysis
2.1.1 study area
This project is to get the route plan for the 110 KV cable line connecting R.A. Puram 110/33/11 KV substation and a substation which is assumed to be situated for Anna University in the campus. Panchromatic image (1m resolution) of IKONOS satellite covering the study area (figure 1) is collected for interpretation and digitization of thematic layers.
2.1.2 data
line feature. The route network obtained after the
route network analysis is shown in figure 1.
2.1.3 route network analysis
The most preferable and conventional place for cable laying is any one side of the road. And therefore the major routes in the route network are roads. In the route network analysis, the routes which are unsuited for the project are selected using the select by attribute tool in the GIS software and deleted and hence search space for the proposed algorithm is reduced. For example roads having the width less than 12 feet are neglected since those roads are very narrow and so cabling in those roads cause disturbances to both public and the work involved in the cabling. Roads which terminate by itself are also deleted, since they won’t be useful to create a path between the specified origin and destination anymore. And roads which are inside the private authority, important government administration, airport & other protected areas are also neglected since there is no permission for cable laying in those roads.
Other than the roads, analyzing can also be done for some other possible routes to pass the cables, if it is rule-governed. For example, in this case, after the thorough study of the area and interpreting the ikonos image, there are two additional line features are included in the route feature class which are, a line feature run along beside the canal, and a line feature (the line features in purple color in the figure 1) across the neck of the river. The output of the route network analysis is shown in figure 1.
2.1.4 weightage to the routes
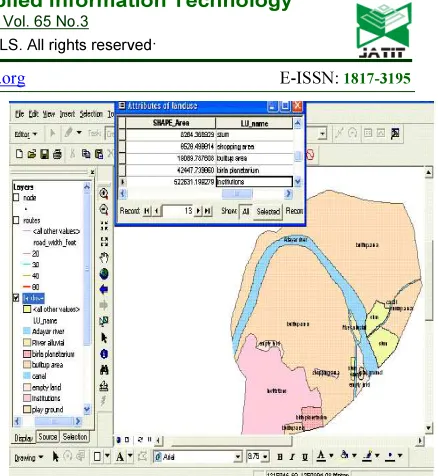
[image:3.595.302.521.76.314.2]Weightage (initial weightage) to the routes are assigned after consulting TNEB authorities of cable laying section, on considering the factors such as Road width, Land use, Traffic flow (high, medium, low), Congestion in the road, Road type (one way or two way), Cost etc.
Figure 2: Landuse Feature Class And Its Attribute Table
Figure 3: VB environment in the GIS software, ArcInfo
2.2Optimum Shortest Path
[image:3.595.306.524.338.567.2]In this proposed algorithm a single ant has
been used to find out the optimum shortest path between a pair of nodes (origin node and destination node) on a connected graph with many branches (here onwards called as routes). All the routes are given with some initial weightage as discussed in section 2.1.4. This ant traces the connected graph in many numbers of Transactions until it gets the same path or until the user defined number of Transactions. Each Transaction consists of two tracings named Forward Tracing from origin node to destination node and Reverse Tracing from destination node to origin node. Tracing is choosing of high probability route from the routes connected to the node where the ant presents. While tracing a route real ants leave a chemical substance called Pheromone. The counterpart for this is designed as Trail Substance defined as sum of Trail Substance of the route in previous trace (Initially it is Initial weightage of the route given by the user) and length of the route. And Trail Intensity of a route is given as Trail Substance per meter. High probability route is the route which has highest Trail Intensity.
[image:4.595.302.520.75.287.2]In the First Transaction in Forward Tracing ant starts from origin node and traces routes based on the highest probability as said above until it reaches the destination node. In that process when it moves from one node to other it saves the data of its visited routes called Tabu List. The Tabu List routes should not be taken into account for the probability calculation of connected routes to a particular node as the ant has to reach the destination node. Once it reached the destination node the Forward Tracing is completed and Tabu List will be emptied but not the Trail Substance and starts the Reverse Tracing in the same procedure until it reaches the origin node to cover the other missed out paths in Forward Tracing. Many number of Transactions to be run because to cover all the paths in the connected graph to narrow down the optimum shortest path. To reduce the run time in calculating Trail Substance (Trail Substance of a route = Trail Substance of the route in previous trace + length of the route) for bigger numbers at the end of each Transaction, Trail Substance is assigned with only 25% of its value.
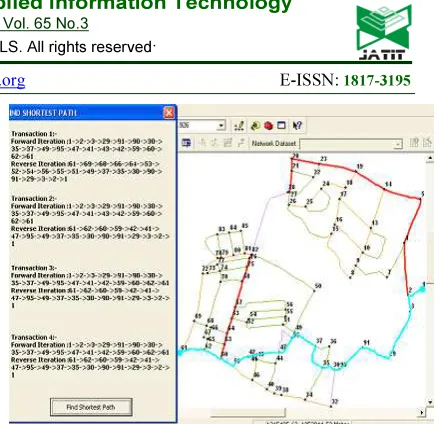
Figure 4: Output Of The Program For The Specified Origin(Node No.1) And Destination(Node No.61)
Figure 5: Result Of Our Algorithm And The Network Analyst For The Shortest Path Finding Based On Only The Length Of The Routes Between The Origin(Node No.
1) And Destination(Node No. 28) Are Same
3.RESULTS&DISCUSSIONS
Coding for the above algorithm is done in the inbuilt VB editor (figure 3) of GIS software ArcInfo for the site geometries created for the project. The optimum shortest path for the cabling for the origin and destination is found after running the program and it is shown in the figure 4.
[image:4.595.307.520.327.504.2]the routes (means the algorithm should give the
shortest path only based on the length of the routes) and the result of our algorithm and the Network Analyst was same as the shortest path is based only on the length of the routes in both the cases which is shown in figure 5. It is verified and it is true for other some node pair combinations also.
4.CONCLUSION
In electrical power supply systems, transmission power loss is directly proportional to the length of the transmission cable. The main advantage of finding out optimum shortest path not only reduces the cable cost but also significantly reduces the transmission power loss. The Proposed algorithm as a customized application in ArcGIS for optimum shortest path finding for underground cable transmission lines seems to be robust to meet the requirements related to reliability by giving separate space to weightage analysis for the routes in the connected graph in the future research. Hence without fully depending on ArcGIS extensions, customizing such programs in cases like, automating simple repetitive tasks, streamlining the work flow, creating new functionality, or producing third party solutions etc is beneficial.
REFERENCES
[1] R. Geetha and G. Umarani Srikanth, “Ant Colony Optimization in Different Engineering Applications: An Overview”, International Journal of Computer Application, Volume 49 - Number 17, 2012
[2] Dilpreet kaur and Dr.P.S Mundra, “Ant Colony Optimization: A Technique Used For Finding Shortest Path”, International Journal of Engineering and Innovative Technology, Volume 1, Issue 5, May 2012
[3] Z. Sumic, S. S. Venkata, and T. Pistorese, “Automated underground residential distribution design. Part I: Conceptual design,” IEEE Trans. Power Del., vol. 8, no. 2, pp. 637–643, Apr. 1993.
[4] Hongga Li , Xiaoxia Huan and Quan Feng” Optimizing Expressway Maintenance Planning by Coupling Ant Algorithm and
Geography Information System
Transportation in Hubei Province, China” IGARSS 2011
[5] Z. Sumic, T. Pistorese, H. Males-Sumic, and S.S. Venkata, “Automated underground residential distribution design. Part2: Prototype implementation and results,” IEEE Trans. Power Del., vol. 8, no. 2, pp. 644–651, Apr. 1993.
[6] E.-C. Yeh, Z. Sumic, and S. S. Venkata, “APR: A geographic information system based primary router for underground residential distribution design,” IEEE Trans. Power Syst., vol. 10, no. 1, pp. 400–406, Feb. 1995. [7] W. M. Lin, M. T. Tsay, and S.W.Wu,
“Application of geographic information system for substation and feeder planning,” Int. J. Electr. Power Energy Syst., vol. 18, pp. 175–183, Mar. 1996.
[8] M. Vega and H. G. Sarmiento, “Image processing application maps optimal transmission routes,” IEEE Comput. Appl. Power, vol. 9, no. 2, pp. 47–51, Apr. 1996. [9] N. A. West, B. Dwolatzky, and A. S. Meyer,
“Terrain based routing of distribution cables,” IEEE Comput. Appl. Power, vol. 10, no. 1, pp. 42–46, Jan. 1997.
[10] A. D. Luchmaya, B. Dwolatzky, and A. S. Meyer, “Using terrain information in an electrification planning tool,” in Proc. IEEE Power Eng. Soc. Transmission Distribution Conf., 2001, pp. 456–460.
[11] E.-C. Yeh and H. Tram, “Information integration in computerized distribution planning,” IEEE Trans. Power Syst., vol. 12, no. 2, pp. 1008–1013, May 1997.
[12] M. Y. Cheng and G. L. Chang, “Automating utility route design and planning through GIS,” Automation Construction, vol. 10, pp. 507–516, May 2001.
[13] N. G. Boulaxis and M. P. Papadopoulos, “Optimal feeder routing in distribution system planning using dynamic programming technique and GIS facilities,” IEEE Trans. Power Del., vol. 17, no. 1, pp. 242–247, Jan. 2002
[14] J. F. Gómez, H. M. Khodr, P. M. De Oliveira, L. Ocque, J. M. Yusta, R. Villasana, A. J. Urdaneta “Ant Colony System Algorithm for the Planning of Primary Distribution Circuits,” IEEE Trans. on Power Systems, Vol. 19, No. 2, May 2004