Manchester, United Kingdom - August 10-14, 2015
Division V, Paper 275
DEVELOPMENT OF EVALUATION METHOD FOR SEISMIC
ISOLATION SYSTEMS OF NUCLEAR POWER FACILITIES
- BREAK TEST OF FULL SCALE LEAD RUBBER BEARINGS FOR
NUCLEAR FACILITIES,
PART3 FINITE ELEMENT ANALYSIS MODEL FOR BREAK TEST-
Takahiro Mori1, Nobuo Masaki2, Nobuo Murota3, Takafumi Hiraki4, Masaki Ikeda5, Hiroshi Shimizu6, Masakazu Jimbo7, Takashi Nakayama8and Yoshito Umeki9
1
Infrastructure Products Development Department, Bridgestone Corporation, Japan
2
Fellow, Infrastructure Products Development Department, Bridgestone Corporation, Japan
3
General Manager, Infrastructure Products Development Department, Bridgestone Corporation, Japan
4
Research Engineer, Central Research Institute of Electric Power Industry (CRIEPI), Japan
5Staff Engineer, Aseismic Engineering Sec., Nuclear Plant Engineering Dept., Hitachi-GE Nuclear Energy,
Ltd, Japan
6Structure No.1 Lab., Strength Research Dept., Research & Innovation Center, Mitsubishi Heavy Industries,
Ltd., Japan
7
Chief Specialist, Plant Design & Engineering Dept., Isogo Nuclear Engineering Center , Toshiba Corporation Power Systems Company, Japan
8
Senior Manager, Structural Engineering Nuclear Power Department, Kajima Corporation, Japan
9
Manager, Nuclear Power Plant Arch. Eng. Section, Civil & Arch. Dept., Chubu Electric Power Co. Inc., Japan
ABSTRACT
In the previous report, other part of this series of papers (Imaoka et al. (2015) and Nakayama et al. (2015)), break test results of full-scale lead rubber bearing (LRB) were shown. In this report, we propose finite element analysis (FEA) model which can trace the break test results for the purpose of prediction of LRB break characteristics. In the case of modelling FEA for rubber bearings, selection of material model for rubber is important. As a rubber material model, we select hyper-elastic model which can represent the softening under tri-axial tensile deformation.
First, details of proposed FEA model are shown. Second, we show the validity of proposed model by comparing with break test results of relation between shear/tensile stress and shear/tensile strain. Finally, breaking criteria of LRB is suggested.
INTRODUCTION
23rd Conference on Structural Mechanics in Reactor Technology Manchester, United Kingdom - August 10-14, 2015 Division IX (include assigned division number from I to X)
breaking criteria of LRB is suggested to predict break characteristics of LRB and parameter studies are performed for the purpose of improvement of breaking characteristics.
FEA MODELLING OF LRB
In the case of modelling rubber bearings, selection of material model for rubber and its values of material parameters are important. In this section, outlines of the FEA model including material model for rubber and determination result of material parameters are shown.
Outlines of FEA Model
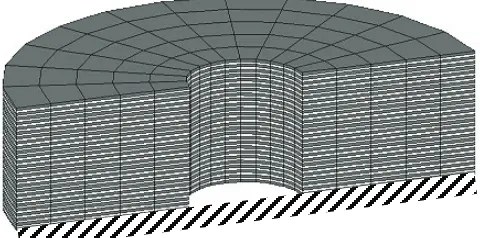
FEA model for determination of rubber material parameters are shown in Figure 1. If nodes are shared at a boundary between lead and rubber/plate, stable analysis results are obtained. Therefore, in the case of calculating horizontal loading under compression, nodes of inner rubber and insert plate are shared with lead, because vertical deformation is small. However, since horizontal deformation is large in the case of vertical tensile loading, node share boundary condition is not valid and contact condition must be used. If contact condition is used at boundary between lead and inner rubber/insert plate, analysis becomes instable. Therefore, in almost all of the case, modelling of lead plug is omitted because it is assumed that lead does not affect the result of break characteristics. Details of selected element for each material are shown in Table 1, and boundary conditions are shown in Table 2.
Figure 1. FEA model for determination of rubber material parameters
Table 1. Element types
Material Element type
Inner rubber 8-nodes hexahedral element (full integral) Insert plate 8-nodes hexahedral element (reduced integral) Lead plug (if modelling) 8-nodes hexahedral element (full integral)
Table 2. Boundary conditions
Boundary of each materials Node share
Lower surface of LRB Fixed
Upper surface of LRB Tying with dummy node which has 2 DOF for vertical and horizontal loading direction
23rd Conference on Structural Mechanics in Reactor Technology Manchester, United Kingdom - August 10-14, 2015 Division IX (include assigned division number from I to X)
Material Model and Material Parameters
Material model for inner rubber is given by,
(1)
(2)
(3)
where, W is strain energy density function, Wdev is deviatoric part of W, Wvol is volumetric part of W, I1 is
first invariant of right Cauchy-Green tensor and J is invariant representing volume change. This model can represents the reduction of stiffness under tensile deformation caused by generation of void in rubber. a, b, κ1, κ2, κ3 andε1 are material parameters. a represents linear spring constant, b represents magnitude
of hardening behavior at the range of large shear strain, κ1 represents the compressive modulus, κ2
represents tensile modulus, κ3 represents tensile modulus after yielding and ε1 represents the yielding
tensile strain. a and b are determined to make shear stress – shear strain relationship of analysis result correspond with that of test result of horizontal loading under compressive stress 0MPa. In the case of determining a and b, material model represented by Equation (4) is used for inner rubber for simplicity.
(
) (
)
(
1/3)
21 3 1 1 1 2 9 3
3 + - +
-=a I b I J
W
k
(4)
κ2,κ3 andε1 are determined to make tensile stress – tensile strain relationship of analysis result correspond
with that of test result of vertical tensile loading under offset=0%. Since it is difficult to determine κ1, κ1
is set to 1000MPa. Details of analysis conditions are shown in Table 3.
Material model for insert plate and lead plug are bi-linear plastic-elastic model whose yielding condition is Mises condition, and material parameter values are shown in Table 4.
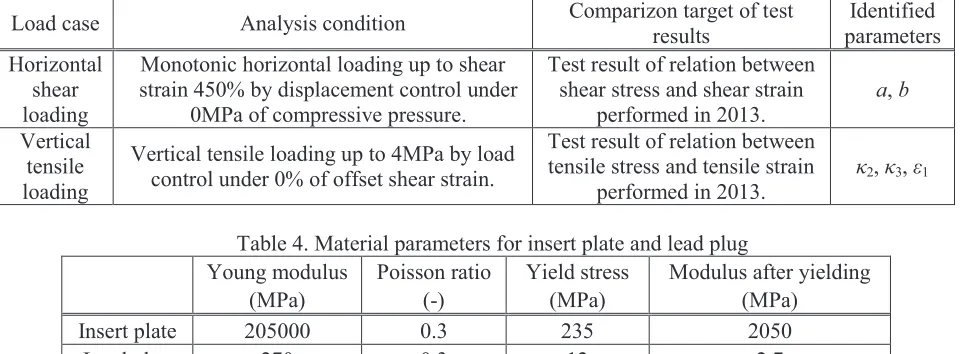
Table 3. Analysis conditions
Load case Analysis condition Comparizon target of test results Identified parameters Horizontal shear loading
Monotonic horizontal loading up to shear strain 450% by displacement control under
0MPa of compressive pressure.
Test result of relation between shear stress and shear strain
performed in 2013.
a, b
Vertical tensile loading
Vertical tensile loading up to 4MPa by load control under 0% of offset shear strain.
Test result of relation between tensile stress and tensile strain
performed in 2013.
κ2,κ3,ε1
Table 4. Material parameters for insert plate and lead plug Young modulus (MPa) Poisson ratio (-) Yield stress (MPa)
Modulus after yielding (MPa)
Insert plate 205000 0.3 235 2050
Lead plug 270 0.3 12 2.7
vol dev
W
W
W
=
+
(
) (
)
31 1
dev=a I -3 +b I -3
23 Conference on Structural Mechanics in Reactor Technology Manchester, United Kingdom - August 10-14, 2015 Division IX (include assigned division number from I to X)
Determination Result of Material Parameters of Rubber
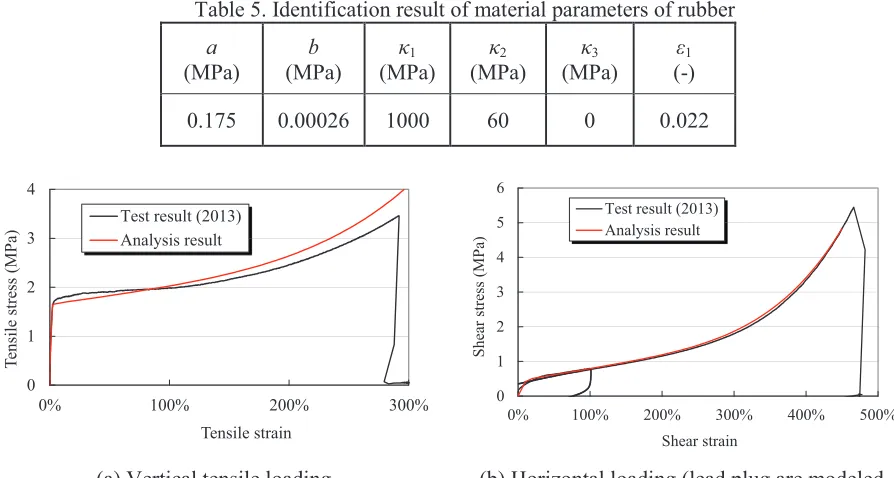
Identification result of material parameters are shown in Table 5, and comparison with test results are shown in Figure 2. As can be seen from Figure 2, analysis result shows good agreement with test result.
Table 5. Identification result of material parameters of rubber
a (MPa)
b (MPa)
κ1
(MPa)
κ2
(MPa)
κ3
(MPa)
ε1
(-)
0.175 0.00026 1000 60 0 0.022
0 1 2 3 4
0% 100% 200% 300%
T
ensile
stre
ss
(MPa)
Tensile strain Test result (2013) Analysis result
0 1 2 3 4 5 6
0% 100% 200% 300% 400% 500%
S
he
ar
stre
ss
(MPa)
Shear strain Test result (2013) Analysis result
(a) Vertical tensile loading (b) Horizontal loading (lead plug are modeled limited only this case)
Figure 2. Comparison with test results in 2013 (See Table. 3 for comparison target of test result)
Validation of FEA Model by Comparing Test Results
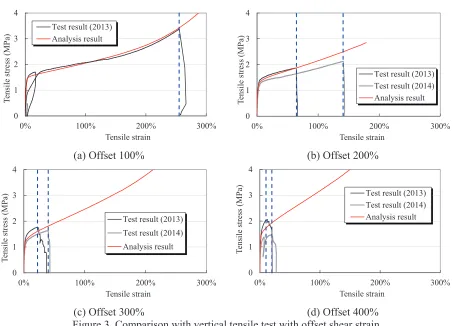
Preceding definition of break criteria, comparison with vertical tensile test under each offset strain is shown to examine the validity of proposed FEA model. Analysis conditions are shown in Table 6, and comparison results are shown in Figure 3. As can be seen from Figure 3, analysis result can well simulate the vertical tensile behaviour.
Table 6. Analysis conditions
Vertical tensile loading Offset shear strain
Vertical tensile loading up to 4MPa by load control.
100% 200% 300% 400%
DEVELOPMENT OF PREDICTION TECHNIQUE OF BREAK CHARACTERISTICS FOR LRB
23 Conference on Structural Mechanics in Reactor Technology Manchester, United Kingdom - August 10-14, 2015 Division IX (include assigned division number from I to X)
0 1 2 3 4
0% 100% 200% 300%
T ens il e s tre ss (MP a) Tensile strain Test result (2013)
Analysis result 0 1 2 3 4
0% 100% 200% 300%
T ens il e s tre ss (MP a) Tensile strain
Test result (2013) Test result (2014) Analysis result
(a) Offset 100% (b) Offset 200%
0 1 2 3 4
0% 100% 200% 300%
T ensil e stre ss (MPa) Tensile strain Test result (2013) Test result (2014)
Analysis result 0 1 2 3 4
0% 100% 200% 300%
T ensil e stre ss (MPa) Tensile strain
Test result (2013) Test result (2014) Analysis result
(c) Offset 300% (d) Offset 400%
Figure 3. Comparison with vertical tensile test with offset shear strain
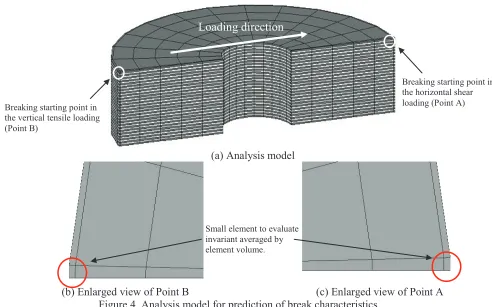
Defining Method of Break Criteria for LRB
First, defining method of break criteria for LRB is shown. Break criteria is defined by examining the state of strain of breaking point at the moment LRB breaks. Break criteria is defined as a function of principal stretch ratio λ1, λ2 and λ3. λ1, λ2 and λ3 are maximum, medium, minimum principal stretch ratio
respectively. Meshes examined principal stretch ratio are shown in Figure 4, and analysis conditions are shown in Table 7 and 8.
Table 7. Analysis conditions of horizontal shear loading
Analysis No. Compressive stress Horizontal shear loading condition H-m1 -1MPa (Tensile stress)
Monotonic loading up to shear strain 500%.
H-00 0MPa
H-05 5MPa
H-08 8MPa
Table 8. Analysis conditions of vertical tensile loading Analysis
No. Vertical tensile loading condition Offset strain
V-00 Monotonic tensile loading 0%
V-01
Monotonic tensile loading after loading offset shear strain under compressive
stress 0MPa.
100%
V-02 200%
V-03 300%
23rd Conference on Structural Mechanics in Reactor Technology Manchester, United Kingdom - August 10-14, 2015 Division IX (include assigned division number from I to X)
(a) Analysis model
(b) Enlarged view of Point B (c) Enlarged view of Point A Figure 4. Analysis model for prediction of break characteristics
Analysis Results
Contour figures of Green-Lagrange strain at the moment when LRB breaks at the vertical tensile test are shown in Figure 5. As can be seen from Figure 5, the point which tends to become breaking start (Point B) shows maximum value in analysis result. In the case of offset=200%, strain value has widely distributed compared with other offset case. Therefore, local vertical strain at breaking point is largely different from total vertical strain of LRB. This is why, tensile breaking strain at offset=200% is largely reduced from that at offset=100%.
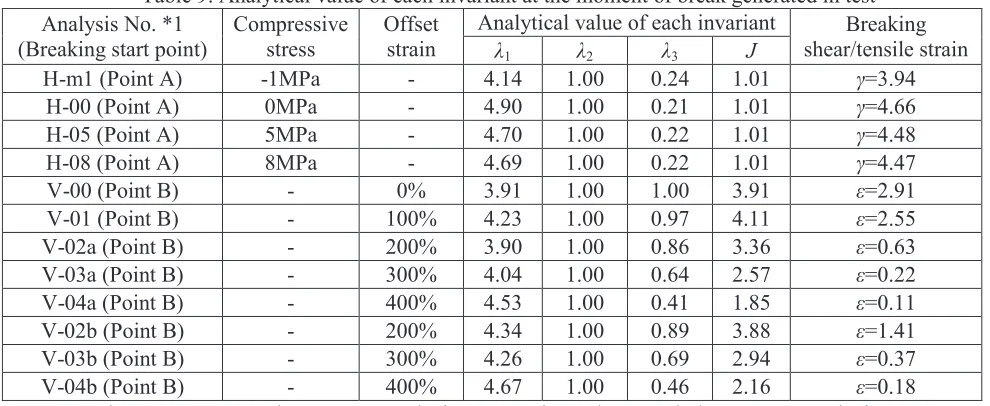
Definition of Breaking Criteria
Analytically obtained values of principal stretch ratios λ1, λ2 and λ3 at breaking point at the moment LRB
breaks in the test are shown in Table 9. γ and ε denote shear and tensile strain respectively. As can be seen from Table 9, λ2 indicate almost 1 independent of loading condition, so it can be regarded that breaking
point is plane-strain state. Maximum principal stretch ratios λ1, on the other hand, indicate approximately
4 independent of loading condition. According to this result, it is assumed that breaking of LRB occurs when λ1 reaches certain threshold value at breaking point. Therefore, breaking criteria is defined as λ1=Bcr.
There is a possibility which predict breaking strain of LRB by calculating shear/tensile strain at the moment when λ1 reaches certain threshold value Bcr at breaking point A or B.
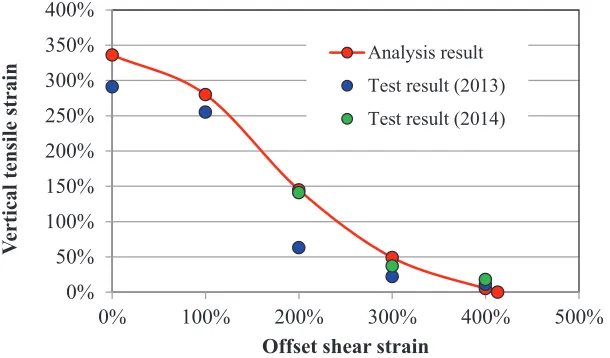
As a result of calculating Bcr by least-square method, threshold value is obtained as Bcr=4.36. A figure
plotted Bcr values at breaking point at the moment LRB breaks is shown in Figure 6 in each analysis. Blue
solid line denotes threshold value Bcr=4.36. Whereas variability inevitably exists, when λ1 reaches 4.36 in
analysis, break occurs in break test. A comparison between test results of break test and breaking curve predicted by FEA is shown in Figure 7.
Breaking starting point in the vertical tensile loading (Point B)
Loading direction
Small element to evaluate invariant averaged by element volume.
23 Conference on Structural Mechanics in Reactor Technology Manchester, United Kingdom - August 10-14, 2015 Division IX (include assigned division number from I to X)
(a) Vertical tensile loading (Offset 0%) (b) Vertical tensile loading (Offset 100%)
(c) Vertical tensile loading (Offset 200%) (d) Vertical tensile loading (Offset 300%)
(e) Vertical tensile loading (Offset 400%) (f) Horizontal shear loading (Compressive stress 0MPa)
Figure 5. Maximum principal strain contours at the moment of break generated in test
Table 9. Analytical value of each invariant at the moment of break generated in test Analysis No. *1
(Breaking start point)
Compressive stress
Offset strain
Analytical value of each invariant Breaking shear/tensile strain
λ1 λ2 λ3 J
H-m1 (Point A) -1MPa - 4.14 1.00 0.24 1.01 γ=3.94
H-00 (Point A) 0MPa - 4.90 1.00 0.21 1.01 γ=4.66
H-05 (Point A) 5MPa - 4.70 1.00 0.22 1.01 γ=4.48
H-08 (Point A) 8MPa - 4.69 1.00 0.22 1.01 γ=4.47
V-00 (Point B) - 0% 3.91 1.00 1.00 3.91 ε=2.91
V-01 (Point B) - 100% 4.23 1.00 0.97 4.11 ε=2.55
V-02a (Point B) - 200% 3.90 1.00 0.86 3.36 ε=0.63
V-03a (Point B) - 300% 4.04 1.00 0.64 2.57 ε=0.22
V-04a (Point B) - 400% 4.53 1.00 0.41 1.85 ε=0.11
V-02b (Point B) - 200% 4.34 1.00 0.89 3.88 ε=1.41
V-03b (Point B) - 300% 4.26 1.00 0.69 2.94 ε=0.37
V-04b (Point B) - 400% 4.67 1.00 0.46 2.16 ε=0.18
*1 V-02a – V-04a denotes test results in 2013 and V-02b – V-04b denotes test results in 2014.
Point B
Point A
Loading direction
Loading direction
Point B
Point B
Point B
23rd Conference on Structural Mechanics in Reactor Technology Manchester, United Kingdom - August 10-14, 2015 Division IX (include assigned division number from I to X)
0 1 2 3 4 5 6
Max
im
um
pri
nci
pal
st
re
tch
rat
io
λ1
Analysis No.
Analytical value Criteria value
Figure 6. Comparison between criteria
B
cr andλ
1 at the moment of break generated in test0% 50% 100% 150% 200% 250% 300% 350% 400%
0% 100% 200% 300% 400% 500%
V
er
tical
te
n
si
le s
tr
ai
n
Offset shear strain
Analysis result Test result (2013) Test result (2014)
Figure 7. Comparison between break test result and break curve obtained from FEA analysis
PARAMETER STUDY BASED ON PROPOSED BREAKING CRITERIA
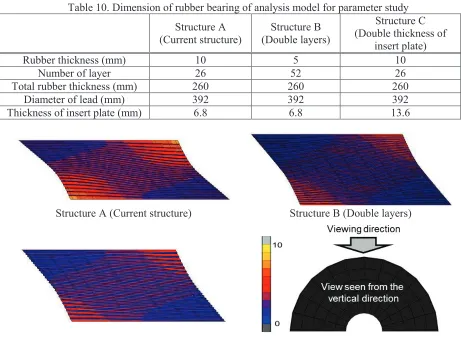
In this section, by performing parameter study which changes thickness of inner plate or rubber, we perform feasibility study whether change of such structure improved breaking characteristics. In this report, we perform 2 cases of analysis in addition to current structure. One is the case where number of rubber layer doubles and thickness of rubber halves (Structure B). The other is the case where thickness of insert plate doubles (Structure C). (Current structure is ‘Structure A’) By comparing breaking curve obtained in previous section with that of parameter study analysis, we examined whether there are effects of improvement of breaking characteristics. Dimension of LRB calculated in parameter study is shown in Table 10.
Contour figures of maximum principal strain of Green-Lagrange strain at the moment when LRB breaks at the vertical tensile test are shown in Figure 8. As can be seen from Figure 6, Structure B and C shows low value of Green-Lagrange strain at breaking point compared with current structure A.
Calculation result of breaking curve is shown in Figure 9. As can be seen from Figure 9, effect of improvement of breaking characteristics is confirmed.
23 Conference on Structural Mechanics in Reactor Technology Manchester, United Kingdom - August 10-14, 2015 Division IX (include assigned division number from I to X)
Table 10. Dimension of rubber bearing of analysis model for parameter study
Structure A (Current structure)
Structure B (Double layers)
Structure C (Double thickness of
insert plate)
Rubber thickness (mm) 10 5 10
Number of layer 26 52 26
Total rubber thickness (mm) 260 260 260
Diameter of lead (mm) 392 392 392
Thickness of insert plate (mm) 6.8 6.8 13.6
Structure A (Current structure) Structure B (Double layers)
Structure C (Double thickness of insert plate)
Figure 8. Maximum principal strain contours at the moment of break generated in test
0% 50% 100% 150% 200% 250% 300% 350%
0% 100% 200% 300% 400%
V
er
tic
al
te
n
sil
e str
ain
Offset shear strain
Structure A Structure B Structure C
23rd Conference on Structural Mechanics in Reactor Technology Manchester, United Kingdom - August 10-14, 2015 Division IX (include assigned division number from I to X)
CONCLUSION
We developed an FEA model which can predict the ultimate state of LRB by determining the break criteria of rubber and examined the validity of the model by comparing LRB break test. Important summary of analysis condition of proposed FEA model is shown as follows;
FEA model : 3-Dimensional (Modelling of materials are inner rubber and insert plate only). Material model for rubber : Material model which can represents the reduction of stiffness under
tensile deformation caused by generation of void in rubber. Breaking criteria of rubber : Maximum principal stretch ratio.
By applying developed prediction technique, it may be possible to design LRB considering ultimate characteristics. However, application range of developed prediction technique is not clear. Therefore, it is remaining issue of this study to examine accuracy of the FEA model by comparing other cases of break test result.
ACKNOWLEDGMENTS
This technology development has been carried out as Japan national project “Development of Evaluation Method for Seismic Isolation Systems of Nuclear Power Facilities” with the participation of Chubu Electric Power, Japan Atomic Power, Hokkaido Electric Power, Tohoku Electric Power, Tokyo Electric Power, Hokuriku Electric Power, Kansai Electric Power, Chugoku Electric Power, Shikoku Electric Power, Kyushu Electric Power, J Power, Toshiba, Hitachi-GE Nuclear Energy, Mitsubishi Heavy Industries, and the Institute of Applied Energy.
We thank Dr. Nishikawa, a Professor Emeritus at Tokyo Metropolitan University, Dr. Kubo, a Professor Emeritus at the University of Tokyo, Dr. Fujita, a Professor Emeritus at the University of Tokyo, Dr. Kasahara, a Professor at the University of Tokyo, Dr. Yabana, the Central Research Institute of Electric Power Industry for their advice.
REFERENCES
Imaoka, T. et al.(2015), “Development of Evaluation Method for Seismic Isolation Systems of Nuclear Power Facilities, -Break Test of Full Scale Lead Rubber Bearings for Nuclear Facilities, Part 1,” Trans of the twenty-third Structural Mechanics in Reactor Technology (SMiRT-23), Manchester, UK .
Nakayama, T. et al.(2015), “Development of Evaluation Method for Seismic Isolation Systems of Nuclear Power Facilities, -Break Test of Full Scale Lead Rubber Bearings for Nuclear Facilities, Part 2,” Trans of the twenty-third Structural Mechanics in Reactor Technology (SMiRT-23), Manchester, UK .
Ogden, R. W., (1998) “Nonlinear Elastic Deformations”, Dover.
Yeoh, O. H., (1993) “Some forms of the strain energy function for rubber”, Rubber Chemistry and technology, Volume 66, Issue 5, 754-771.