Sub-event based multi-document summarization
Naomi Daniel,
1Dragomir Radev,
1,2Timothy Allison
31School of Information
2Department of Electrical Engineering and Computer Science 3Department of Classical Studies
University of Michigan
{ndaniel, radev, tballiso}@umich.eduAbstract
The production of accurate and complete multiple-document summaries is challenged by the complexity of judging the usefulness of information to the user. Our aim is to determine whether identifying sub-events in a news topic could help us capture essential information to produce better summaries. In our first experiment, we asked human judges to determine the relative utility of sentences as they related to the sub-events of a larger topic. We used this data to create summaries by three different methods, and we then compared these summaries with three automatically created summaries. In our second experiment, we show how the results of our first experiment can be applied to a cluster-based automatic summarization system. Through both experiments, we examine the use of inter-judge agreement and a relative utility metric that accounts for the complexity of determining sentence quality in relation to a topic.
1. Introduction
Multiple articles on a particular topic tend to contain redundant information as well as information that is unique to each article. For instance, different news sources covering the same topic may take different angles, or new information may become available in a later report. So, while all the articles are related to the larger topic, each article may be associated with any of several sub-events. We wanted to find a way to capture the unique sub-event information that is characteristic in multiple-document coverage of a single topic. We predicted that breaking documents down to their sub-events and capturing those sentences in each sub-event with the highest utility would produce an accurate, thorough, and diverse multi-document summary.
In our first experiment, we compared six methods of summarization to see which produces the best summaries. The methods included three automatic and three manual methods of producing summaries. We used relative utility to capture and measure subtleties in determining sentence relevance. We created multiple document summaries using both a sub-event based approach and a topic-based approach. Generally, we expected to find that the manual summaries performed better than the automatic summaries. In our second experiment, we designed a multi-document summarizer which relied on a clustering method, and we tested the three policies we devised for creating summaries from the manual summarization technique developed in our first experiment.
2. Related Work
3. Article Corpus
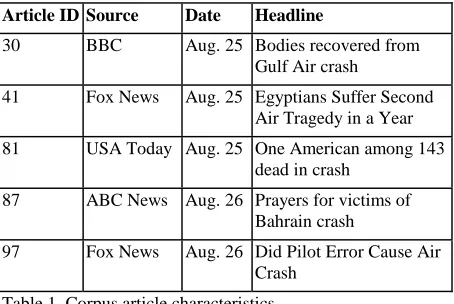
Our study involves two experiments carried out on one corpus of news articles. The article corpus was selected from a cluster of eleven articles describing the 2000 crash of Gulf Air flight 072. From these articles we chose a corpus of five articles, containing a total of 159 sentences. All the articles cover a single news event, the plane crash and its aftermath. The articles were gathered on the web from sources reporting on the event as it unfolded, and come from various news agencies, such as ABC News, Fox News, and the BBC. All of the articles give some discussion of the events leading up to and following the crash, with particular articles focusing on areas of special interest, such as the toll on Egypt, from where many of the passengers had come. The article titles in Table 1, below, illustrate the range of sub-events that are covered under the crash topic.
Article ID Source Date Headline
30 BBC Aug. 25 Bodies recovered from
Gulf Air crash
41 Fox News Aug. 25 Egyptians Suffer Second Air Tragedy in a Year 81 USA Today Aug. 25 One American among 143
dead in crash 87 ABC News Aug. 26 Prayers for victims of
Bahrain crash
[image:2.612.71.298.297.449.2]97 Fox News Aug. 26 Did Pilot Error Cause Air Crash
Table 1. Corpus article characteristics.
4. Experiment 1: Sub-Event Analysis
Our first experiment involved having human judges analyze the sentences in our corpus for degree of saliency to a series of sub-events comprising the topic.4.1 Description of Sub-Event User Study
The goal of this experiment was to study the effectiveness of breaking a news topic down into sub-events, in order to capture not simply salience, but also diversity (Goldstein, 1998).The sub-events were chosen to cover all of the material in the reports and to represent the most significant aspects of the news topic. For the Gulf Air crash, we determined that the sub-events were:
1. The plane takes off 2. Something goes wrong 3. The plane crashes
4. Rescue and recovery effort 5. Gulf Air releases information 6. Government agencies react
7. Friends, relatives and nations mourn 8. Black box(es) are searched for 9. Black box(es) are recovered 10. Black box(es) are sent for analysis
We instructed judges to rank the degree of sentence relevance to each sub-event. Judges were instructed to use a scale, such that a score of ten indicated that the sentence was critical to the sub-event, and a score of 0 indicated that the sentence was irrelevant. Thus, the judges processed the 159 sentences from 5 documents ten times, once pertaining to each sub-event. This experiment produced for each judge 1590 data points which were analyzed according to the methods described in the next section.
We used the data on the relevance of the sentences to the sub-events to calculate inter-judge agreement. In this manner, we determined which sentences had the overall highest relevance to each sub-event. We used this ranking to produce summaries at different levels of compression.
5. Methods for Producing Summaries
To gather data about the effectiveness of dividing news topics into their sub-events for creating summaries, we utilized data from human judges, upon which we manually performed three algorithms. These algorithms and their application are described in detail below. We were interested to determine if the Round Robin method (described below,) which has been used by McKeown et al. (1999), Boros et al. (2001) and by Hatzivassiloglou et al. (2001), was the most effective.5.1 Sub-Event-Based Algorithms
After collecting judges’ scores of relevance for each sentence for each subtopic, we then ranked the sentences according to three different algorithms to create multiple-document summaries. From this data, we created summary extracts using three algorithms, as follows:
•
Algorithm 1) Highest Score Anywhere - pick the sentence which is most relevant to any subevent, no matter the subevent; pick the next sentence which is most relevant to any subevent, etc.• Algorithm 2) Sum of All Scores - for each sentence, sum its relevance score for each cluster, pick the sentence with the highest sum; then pick the sentence with the second highest sum, etc.
Judge 1 Judge 2 Judge 3 Judge 1 Judge 2 Judge 3 Judge 1 Judge 2 Judge 3 Article 30,
Sentence 1 1 0 0 5 0 5 8 8 10
2 1 0 0 7 4 7 10 10 10
3 4 0 0 10 10 10 10 5 7
4 1 0 3 5 0 2 8 0 2
5 0 0 0 3 0 0 5 0 2
6 0 0 0 3 0 0 6 0 2
7 0 0 0 3 0 0 6 0 2
8 0 0 0 3 4 2 10 10 10
9 0 0 2 0 0 0 8 0 0
10 0 0 0 3 0 0 6 0 2
[image:3.612.91.525.84.241.2]Sub-Event 1 Sub-Event 2 Sub-Event 3
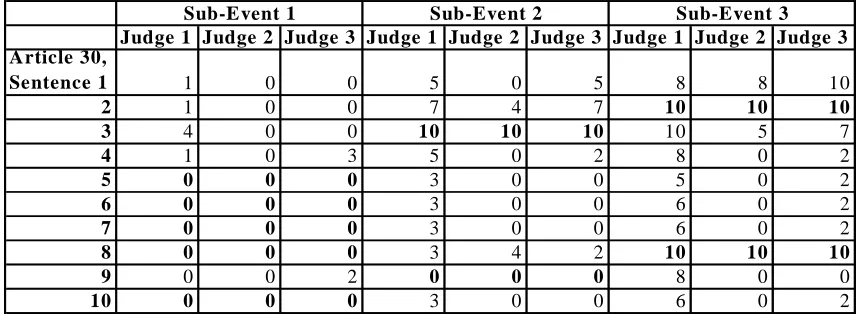
Table 2. First ten sentences of article 30, shown with scores given by three judges for three sub-events. Judges often disagree on the degree of sentence relevancy. Some sentences are used in more than one sub-event.
Algorithm 1 - Highest Score
Anywhere (HSA):
This algorithm was produced by summing the data across all judges to produce a total inter-judge score and keeping sub-events distinct, to see the inter-judge utility scores given to sub-events. We ordered the sentences by ranking these scores in descending order and omitting duplicates, to produce the ten and twenty percent extracts. For example, with data from seven judges on ten sub-events, the highest possible score for each sentence was seventy. Thus seventy was the highest score.In the case that there was a tie between sentences, we ordered them by sub-event number (first sub-event first and tenth sub-event last).
Algorithm 2 - Sum of All Scores
(SAS):
This algorithm was produced by summing the data across all judges to produce a total inter-judge score, and combining events so that we could see the utility scores given across sub-events. We ordered the sentences by ranking these cross-event inter-judge utility scores in descending order and omitting duplicates, to produce the ten and twenty percent extracts.Algorithm 3 - Round Robin (RR): This algorithm was produced by summing the data across all judges to produce a total inter-judge score and keeping sub-events distinct, to see the inter-judge utility scores given to sub-events. We ordered the sentences by ranking the inter-judge utility scores in descending order within each sub-event. We then chose the top sentence from each sub-event (one through ten), the second highest sentence from each sub-event, and so on, omitting duplicates, until we had produced the ten and twenty percent extracts.
In this manner, we created thirty-six sub-event-based summary extracts – six clusters, three algorithms, two compression rates – which we then analyzed.
The Sum of All Scores algorithm most closely replicates a centroid-based summary by combining the ten sub-event scores into one pan-topic score for each sentence. Further, the Sum of All Scores algorithm is the sub-event algorithm most likely to pick sentences with a high “general relevance,” which is what the baseline relative utility scores are meant to capture. In contrast, the Highest Score Anywhere algorithm maintains the structure of the sub-event breakdown, preferring the highest score in any sub-event. Likewise, the Round Robin algorithm maintains the sub-event breakdown, but rather than preferring the highest score in any event, it selects the highest score from each sub-event, serially; this algorithm most closely resembles the Lead-based automatic summarizer, and is at the heart of Hatzivassiloglou et al.’s (2001) SimFinder.
5.2 Automatic Multi-Document
Summaries
MEAD:
First, we produced summaries using the MEAD system. MEAD produces a centroid (vector) for all of the sentences and then selects those sentences which are closest to the centroid. MEAD measures similarity with the cosine measurement and TF*IDF weighting. Mead also adjusts a sentence’s score based on its length, its position in the original document and its similarity to sentences already selected for the extract. (Radev et al, 2000).Lead-Based:
We also produced summaries by the Lead-based method. This method involves assigning the highest score to the first sentence in each article, then the second sentence in each article, and so on.Random:
We created summaries with every possible combination of sentences for each summary length. This allowed us to compute the average random relative utility score.6. Relative Utility
Following (Radev et al., 2000), we used relative utility as our metric. Relative utility was chosen for advantages in a couple of areas.
Relative utility is a metric which measures sentence relevance. It allows us to distinguish the degree of importance between sentences, providing a more flexible model for evaluating sentence utility (Radev et al., 2000). Studies involving sentence extraction have often been predicated upon determining the usefulness of sentences as either useful or non-useful (Allan et al. 2001b). However, determining the usefulness of sentences is more complex than a simple a binary choice can account for. We employ a relative utility metric to account for subtleties in determining the saliency of sentences.
Another advantage of the relative utility metric is that, although human judges have often agree very little on which sentences belong in a summary, they tend to agree on how important sentences are to a topic or event; thus, relative utility makes it possible to leverage this agreement.
To calculate relative utility, we had human subjects assign a score to each sentence in a corpus of articles. The score reflects the subject’s perception of a sentence’s relevance to the overall topic of the corpus. The scale our judges were instructed to use ranged from zero to ten. A score of zero indicated that the sentence was irrelevant; whereas a score of ten indicated that the sentence was crucial to the understanding of the topic. So that judges’ scores can be fairly compared, each judge’s scores are normalized by the highest score and lowest score which that judge gives any sentence.
Relative utility is determined by first adding together the utility scores given to each sentence by each judge. Each sentence in a summary is then awarded the total of the judges’ scores for that sentence. Finally, the summary’s total score is divided by the best possible score, given the size of the summary.
For example, let us assume that a cluster has three sentences (A, B and C) which have been judged by two judges in the following way: A 10, 9, B 8, 6 and C 6, 5. That is, judge 1 gives sentence A a 10, while judge 2 gives sentence A a 9, and so on. In the first step, we sum the judges’ scores for each sentence, yielding (A 19, B 14, C 11). If a summarizer has to pick a 2 sentence summary, and it picks A and C, its utility score is 30. We then divide this score by the best possible 2 sentence summary, in this case A and B, whose utility is 33, yielding a final relative utility of .91.
7. Extract Creation
Summaries can be created by abstracting or extracting [Mani, 2001]. For purposes of comparison with MEAD, an extractive summarizer, we used an extractive method to create all six summary types: sum of all scores, highest score anywhere, round robin, MEAD, lead-based, and random.
7.1 Clusters
Each of the summarization methods was employed at both ten and twenty percent compression rates. We used the summaries thus produced to consider how compression rates could influence the effectiveness of the six summarization methods. In our first experiment, we additionally looked at varying combinations of the five articles, such that we examined the corpus in six clusters, as shown in the figure below. We selected these article combinations to maximize the diversity of sources in each cluster, and to achieve a variable number of articles in a cluster.
Combination 1) articles 30 + 41 + 81 + 87 + 97
Combination 2) articles 30 + 41 + 81
Combination 3) articles 41 + 81 + 87
Combination 4) articles 81 + 87 + 97
Combination 5) articles 87 + 97 + 30
Combination 6) articles 97+ 30 + 41
Figure 1. Article clusters.
10% 20%
HSA SAS RR MEAD Lead Rand HAS SAS RR MEAD Lead Rand
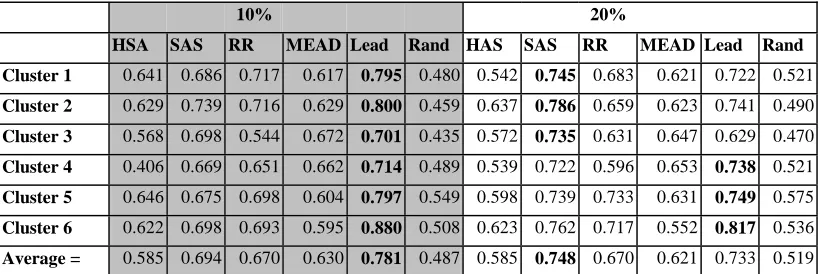
[image:5.612.71.481.87.224.2]Cluster 1 0.641 0.686 0.717 0.617 0.795 0.480 0.542 0.745 0.683 0.621 0.722 0.521 Cluster 2 0.629 0.739 0.716 0.629 0.800 0.459 0.637 0.786 0.659 0.623 0.741 0.490 Cluster 3 0.568 0.698 0.544 0.672 0.701 0.435 0.572 0.735 0.631 0.647 0.629 0.470 Cluster 4 0.406 0.669 0.651 0.662 0.714 0.489 0.539 0.722 0.596 0.653 0.738 0.521 Cluster 5 0.646 0.675 0.698 0.604 0.797 0.549 0.598 0.739 0.733 0.631 0.749 0.575 Cluster 6 0.622 0.698 0.693 0.595 0.880 0.508 0.623 0.762 0.717 0.552 0.817 0.536 Average = 0.585 0.694 0.670 0.630 0.781 0.487 0.585 0.748 0.670 0.621 0.733 0.519 Table 3. Results: Best performing algorithm at each cluster/compression rate shown in bold.
8. Results from the first experiment
Some of our results met our expectations, while others surprised us (see Table 3). The Sum of All Scores manual algorithm produces the best summaries at the twenty percent compression rate. At the ten percent compression rate, data shows Lead-based summaries performing best, with the Sum of All Scores algorithm coming in right behind. Mead scores in the mid-range as expected, for both compression rates, just behind the Round Robin Algorithm. In contrast, the random method leads in low scores, with the Highest Score Anywhere algorithm coming in only slightly higher. Random sets the lower bound. Here, we discuss the details of our findings and their significance in more detail.
8.1 Manual Algorithms
Both the Sum of All Scores, and Round Robin algorithms performed better than MEAD, with the highest score anywhere algorithm performing less well. This result is reasonable, based upon the characteristics of the algorithms. Algorithm 2 (SAS), the best performer among the manual summaries, used the sum of all scores across events and judges; thus, it tapped into which sentences were most popular overall. Algorithm 3 (RR), also better than MEAD, used a round robin technique, which, similarly to the Lead-based results, tapped into the pyramid quality of news journalism. Algorithm 1 (HSA), poorest performer second to Random, used the highest score in any event by inter-judge score; its weakness was in negating both the benefits of the pyramid structure of the judges’ sentence rankings, as well as the popularity of sentences across events.
8.2 Compression Rate
For extracts at the ten percent compression rate, Lead-based sets the upper, and random the lower, bound. However, the Sum of All Scores algorithm performed better at the twenty percent compression rate, beating
Lead-based for best summaries. Each method produced better summaries overall at ten percent compression rate, except for Algorithm 2, which performed better at the twenty percent compression rate.
We believe that SAS performed better at the twenty percent compression rate as a result of two characteristics: as the sum of scores across sub-events, this algorithm preferred both sentences that received higher scores, as well as sentences which were highly ranked most frequently. Therefore, it is weighted toward those sentences that carry information essential to several sub-events. Because of these sentences’ relevancy to more than one sub-event, they are most likely to be important to the majority of readers, regardless of the user’s particular information task. This can also be seen as popularity weighting, with those sentences getting the most and best scores from judges producing the most useful summaries. The patterns uncovered by this result should be leveraged for future improvements to automatic summarizers.
8.3 Lead-Based Summaries
We were not extremely surprised to find that Lead-based summaries produced better summaries at the 10% summary rate. This result may be explained by the pyramid structure of news journalism, which, in a sense, pre-ranks document sentences in order of importance, in order to convey the most critical information first. As our corpus was comprised entirely of news articles, this effect could be exaggerated in our results. As expected, though, the Random summarizer set the lower bound.
8.4 Manual Summaries and MEAD
9. Automatic Clustering and Extraction
In our second experiment, we were interested to see how the different strategies would work with a simple clustering-based multi-document summarizer. We did not expect our clustering algorithm to neatly partition the data according to the subevents we identified in our first experiment, but we did want to see if our findings about SAS would hold true for automatically partitioned data. And so we turned to sentence clustering. While Boros et al. (2001) report poor performance but some promise to this method, Hatzivassiloglou et al. (2001) have exploited clustering with very good results in SimFinder. Both rely on the RR method, although SimFinder considers several other important factors in sentence selection.9.1 Automatic Clustering
Because of the vast number of variables associated with designing a cluster-based summarization algorithm, we chose to limit our system so that we could focus on RR, HSA and SAS. To give a sense of our performance, we also ran a purely centroid-based summarization algorithm.
We used K-means clustering, and obtained results for K = 2-20, at both the 10% and 20% summary levels. By this process, we created K clusters, seeded them as discussed below, and then for each sentence, we found that cluster to which the sentence was closest. After filling the clusters, we checked again to see if each sentence was in its best cluster. We kept doing this until equilibrium was reached (usually no more than 6 cycles).
For our similarity metric we used the cosine measure with inverse document frequency (IDF), inverse sentence frequency (ISF) (following Neto et al. (2000) and no term-weighting. We ran all of these permutations twice, once ignoring sentences with 9 words or fewer (as is MEAD’s default) and once ignoring sentences with 2 words or just 1. We did not use stop words, stemming, or syntactic parsing. Further, we did not factor in the location of the sentences in their original documents, although both MEAD and SimFinder do this.
Initially, we used a method of randomly seeding the clusters, but we found this method extremely unstable. We then devised the following method: 1) for the first cluster, find the sentence which is closest to the centroid of the document cluster, 2) for each sentence after that, find the sentence which is maximally different from those sentences already picked as seeds.
9.2 Automatic Extraction
After creating the clusters by this method, we extracted sentences with the same three methods of interest, HSA, SAS, and RR. For this experiment, we also added a simple Centroid policy. Under this policy, a centroid vector was created for all of the sentences, and then for each sentence the cosine measure was computed against the centroid. The sentences were then sorted by their cosine scores with the centroid. The top 10% or 20% were selected for the summary.
For all policies, the extraction algorithm would not select a sentence which had a cosine of 0.99 or higher with any sentence already in the summary. For comparison, MEAD’s default is 0.7. In the future, we would like to study the effect of this parameter on information diversity.
10. Results for Automatic Clustering
In Table 4, we report our findings from the second experiment. This table presents the average of the performances across all of the clustering options (2 clusters to 20 clusters) for the specified parameters. In general for a 10% summary, the SAS method outperforms the other methods, leading Centroid by only a small amount. At the 20% level, the Centroid policy beats all other algorithms, although SAS with ISF and a 2-word sentence minimum comes close.SAS RR HSA Centroid SAS RR HSA Centroid
min. 2 word IDF 0.602 0.560 0.481 0.546 0.639 0.570 0.533 0.617
min. 2 word ISF 0.672 0.485 0.453 0.669 0.650 0.520 0.522 0.656
min. 2 word none 0.531 0.550 0.528 0.515 0.581 0.557 0.576 0.588
min. 9 word IDF 0.608 0.488 0.472 0.546 0.634 0.535 0.523 0.616
min. 9 word ISF 0.609 0.501 0.460 0.670 0.630 0.529 0.525 0.656
min. 9 word none 0.528 0.511 0.498 0.517 0.588 0.558 0.562 0.582
[image:7.612.141.499.72.192.2]10% 20%
Table 4: Results from our automatic, cluster-based summarizer
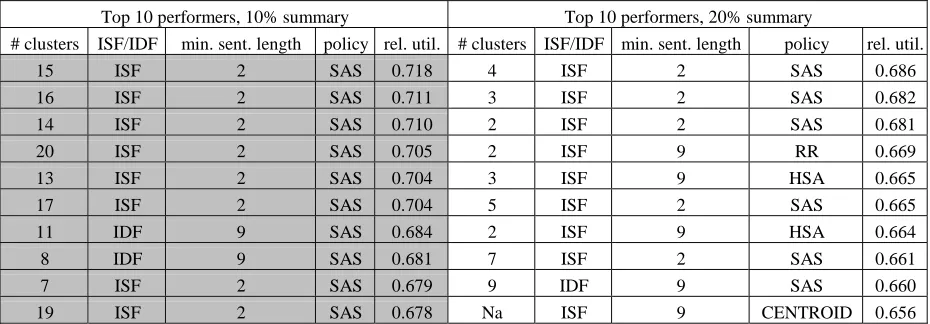
Table 4 is unable to capture, however, the marked variation in results depending on how many clusters were initially selected. In Table 5, we present our findings for the overall best parameters. As can be seen,
SAS is the most common policy. In fact, SAS appears in the top 22 out 25 combinations at the 10% level and 20 out of 25 at the 20% compression level.
Top 10 performers, 10% summary Top 10 performers, 20% summary
# clusters ISF/IDF min. sent. length policy rel. util. # clusters ISF/IDF min. sent. length policy rel. util.
15 ISF 2 SAS 0.718 4 ISF 2 SAS 0.686
16 ISF 2 SAS 0.711 3 ISF 2 SAS 0.682
14 ISF 2 SAS 0.710 2 ISF 2 SAS 0.681
20 ISF 2 SAS 0.705 2 ISF 9 RR 0.669
13 ISF 2 SAS 0.704 3 ISF 9 HSA 0.665
17 ISF 2 SAS 0.704 5 ISF 2 SAS 0.665
11 IDF 9 SAS 0.684 2 ISF 9 HSA 0.664
8 IDF 9 SAS 0.681 7 ISF 2 SAS 0.661
7 ISF 2 SAS 0.679 9 IDF 9 SAS 0.660
[image:7.612.71.536.296.458.2]19 ISF 2 SAS 0.678 Na ISF 9 CENTROID 0.656
Table 5: Top 10 parameters for the both rates of summarization
Tables 4 and Tables 5, taken together, suggest that SAS should be leveraged to improve performance over the pure centroid method. More work needs to be done to determine the appropriate number of clusters to begin with, but it is interesting that there appears to be an inverse relationship, namely, the smaller summary seems to benefit from small, tightly packed clusters, while the larger summary benefits from a few noisy clusters.
11. Conclusions
While the Lead-based policy from our first experiment still outperforms all of our automatic cluster-based summaries at the 10% and 20% levels, our findings about SAS are important for future efforts to summarize by partitioning. As discussed, the pyramid structure of news articles may have boosted the scores of the lead-based policy. In applications of summarizers, where the information is not presorted, we believe that clustering and then extraction with SAS could offer the best results.
We conclude that multi-document summarization is improved by two specific elements. Firstly, taking into account varying degrees of relevancy, as opposed to a polarized relevant/non-relevant metric. Secondly, recognizing the sub-events that comprise a single news event is essential.
12. Future
Work
clusters to find which parameter settings work best for each type of cluster. We suspect that the optimal number of original clusters, and the choice of ISF or IDF, could be determined by the amount of redundancy in the cluster and the desired size of the extract, but more work remains to be done on this. Finally, we need to test the best clustering method against other methods -- centroid-based, MMR, lexical-chain, key-word to name a few.
12. Acknowledgements
This work was partially supported by the National Science Foundation's Information Technology Research program (ITR) under grant IIS-0082884. Our thanks go to the anonymous reviewers for their very helpful comments.
The version of MEAD that we used was developed at the Johns Hopkins summer workshop in 2001 under the direction of Dragomir Radev and later upgraded at the University of Michigan. We want to thank the following individuals for their work on MEAD: Sasha Blair-Goldensohn, Simone Teufel, Arda Celebi, Wai Lam, Hong Qi, John Blitzer, Horacio Saggion, Elliott Drabek, Danyu Liu, Michael Topper, and Adam Winkel.
13
. References
[1] Allan, J. et al., 1998. “On-line New Event Detection
and Tracking.” In Proceedings of the 21st annual
international ACM SIGIR conference on Research and development in information retrieval. Melbourne, Australia.
[2] Allan, J. et al., 2001a. “Temporal summaries of news
topics.” In Proceedings of the 24th annual international
ACM SIGIR conference on Research and development in information retrieval.
[3] Allan, J. et al., 2001b. “Topic models for summarizing novelty.” ARDA Workshop on Language Modeling and Information Retrieval. Pittsburgh, Pennsylvania.
[4] Boros, E. et al. 2001. “A Clustering Based Approach
to Creating Multi-Document Summaries.” In Proceedings of
the 24th Annual International ACM SIGIR Conference on
Research and Development in Information Retrieval, New
Orleans, LA, 2001.
[5] Carbonell, J. and J.G. Goldstein, 1998. “The use of MMR, diversity-based reranking for reordering documents
and producing summaries.” In Proceedings of the 21st
annual international ACM SIGIR conference on Research and development in information retrieval. Melbourne, Australia.
[6] Goldstein, J.G., 1999. “Automatic text summarization of multiple documents.” Carnegie Mellon University.
[7] Hatzivassiloglou et al., 2001. “SimFinder: A Flexible
Clustering Tool for Summarization.” NAACL, Workshop on Automatic Summarization. Pittsburgh, PA.
[8] Mani, I., 2001. “Automatic summarization.” Natural
Language Processing, ed. Ruslan Mitkov. Philadelphia, PA: John Benjamins Publishing.
[9] Marcu, D., 2000. The theory and practice of discourse
parsing and summarization. Cambridge, MA: MIT Press.
[10] McKeown, K. and J. Klavans, V. Hatzivassiloglou, R. Barzilay, E. Eskin, 1999. “Towards multidocument summarization by reformulation: Progress and prospects.” In Proceedings of AAAI-99, Orlando, Fl., pp. 453-60.
[11] Neto, Joel et al., 2000. “Document Clustering and
Text Summarization.” In N. Mackin, editor, Proc. 4th
International Conference Practical Applications of Knowledge Discovery and Data Mining (PADD-2000), pages 41-55, London, January. The Practical Application Company.
[12] Radev D., H. Jing and M. Budzikowska, 2000. “Centroid-based summarization of multiple documents: sentence extraction, utility-based evaluation, and user studies.” ANLP/NAACL Workshop on Summarization. Seattle, WA.
[13] Radev, D., S. Blair-Goldensohn and Z. Zhang, 2001. “Experiments in single and multi-document summarization using MEAD.” First Document Understanding