Computational Linguistics and Chinese Language Processing
Vol. 13, No. 4, December 2008, pp. 421-442 421
© The Association for Computational Linguistics and Chinese Language Processing
[Received September 12, 2008; Revised December 11, 2008; Accepted February 19, 2009]
Hierarchical Taxonomy Integration Using Semantic
Feature Expansion on Category-Specific Terms
Cheng-Zen Yang*, Ing-Xiang Chen*, Cheng-Tse Hung*, and
Ping-Jung Wu*
Abstract
In recent years, the hierarchical taxonomy integration problem has obtained considerable attention in many research studies. Many types of implicit information embedded in the source taxonomy are explored to improve the integration performance. The semantic information embedded in the source taxonomy, however, has not been discussed in previous research. In this paper, an enhanced integration approach called SFE (Semantic Feature Expansion) is proposed to exploit the semantic information of the category-specific terms. From our experiments on two hierarchical Web taxonomies, the results show that the integration performance can be further improved with the SFE scheme.
Keywords: Hierarchical Taxonomy Integration, Semantic Feature Expansion, Category-Specific Terms, Hierarchical Thesauri Information
1.
Introduction
In many daily information processing tasks, merging two classified information sources to create a larger taxonomy with abundant information is in great demand. For example, an e-commerce service provider may merge various catalogs from other vendors into its local catalog to provide customers with versatile contents. A Web user may also want to integrate different blog catalogs from Web 2.0 portals to organize a personal information management library. In these examples, people may need an efficient automatic integration approach to process the huge amount of information.
In recent years, the taxonomy integration problem has obtained much attention in many research studies (e.g. Agrawal & Srikan, 2001; Sarawagi, Chakrabarti, & Godbole, 2003;
*
Dept. of Computer Sci. and Eng., Yuan Ze University, 135 Yuan-Tung Rd., Chungli, 320, Taiwan. Tel.: +886-3-4638800 ext: 2361 Fax: +886-3-4638850.
422 Cheng-Zen Yang et al.
Zhang & Lee, 2004a; Zhang & Lee, 2004b; Zhu, Yang, & Lam, 2004; Chen, Ho, & Yang, 2005; Wu, Tsai, & Hsu, 2005; Ho, Chen, & Yang, 2006; Chen, Ho, & Yang, 2007; Cheng & Wei, 2008; Wu, Tsai, Lee, & Hsu, 2008). As pointed out in these studies, the integration work is more subtle than traditional classification work because the integration accuracy can be further improved with different kinds of implicit information embedded in the source or destination taxonomy. A taxonomy, or catalog, usually contains a set of objects divided into several categories according to some classified characteristics. In the taxonomy integration problem, the objects in a taxonomy, the source taxonomy S, are integrated into another taxonomy, the destination taxonomy D. As shown in earlier research, this problem is more than a traditional document classification problem because different kinds of implicit information in the source taxonomy are explored to greatly help integrate source documents into the destination taxonomy. For example, a Naive Bayes classification approach (Agrawal & Srikan, 2001) with the classification relationship information implicitly existing in the source catalog can achieve integration accuracy improvement. Several SVM (Support Vector Machines) approaches (Chen, Ho, & Yang, 2005) can also have similar improvement with other implicit source information.
The implicit source information studied in previous enhanced approaches generally includes the following features: (1) co-occurrence relationships of source objects (Agrawal & Srikan, 2001; Zhu, Yang, & Lam, 2004; Chen, Ho, & Yang, 2005), (2) latent source-destination mappings (Sarawagi, Chakrabarti, & Godbole, 2003; Zhang & Lee, 2004b; Cheng & Wei, 2008), (3) inter-category centroid information (Zhang & Lee, 2004a), and (4) parent-children relationships in the source hierarchy (Wu, Tsai, & Hsu, 2005; Ho, Chen, & Yang, 2006; Wu, Tsai, Lee, & Hsu, 2008). In our survey, however, the semantic information embedded in the source taxonomy has not been discussed. Since different applications have shown that the semantic information can benefit the task performance (Krikos, Stamou, Kokosis, Ntoulas, & Christodoulakis, 2005; Hsu, Tsai, & Chen, 2006), such information should be able to achieve similar improvements for taxonomy integration. In addition, we further study the hierarchical taxonomy integration problem because many taxonomies, such as Web catalogs, existing in the real world are hierarchical.
424 Cheng-Zen Yang et al.
in D for each document dx in S. In this study, we allow that dx can be integrated into multiple
destination categories because a document commonly appears in several different directories in a real-world taxonomy.
Figure 1 depicts a typical scenario of the integration process on two hierarchical taxonomies. For illustration, we assume that the source category S1,1 has a significant number of overlapped documents with the destination categories D1,1 and D2,2. This means that the documents appearing in S1,1 should have similar descriptive information as the documents in
D1,1 and D2,2. Therefore, a non-overlapped document d1x in category S1,1 should be intensively integrated into both two destination categories D1,1 and D2,2.
3.
Previous Work
3.1
Integration Techniques
In previous studies, different sorts of implicit information embedded in the source taxonomy are explored to help the integration process. These implicit source features can be mainly categorized into four types: (1) co-occurrence relationships of source objects, (2) latent source-destination mappings, (3) inter-category centroid information, and (4) parent-children relationships in the source hierarchy. The co-occurrence relationships of source objects are first studied to enhance a Naive Bayes classifier based on the concept that if two documents are in the same source category, they are more likely to be in the same destination category (Agrawal & Srikan, 2001). The enhanced Naïve Bayes classifier (ENB) is shown to have more than 14% accuracy improvement on average. The work in Chen et al. (2005) also has the similar concept in its iterative pseudo relevance feedback approach. As reported in Chen et al. (2005), the enhanced SVM classifiers consistently achieve improvement.
Latent source-destination mappings are explored in Sarawagi et al. (2003) and Zhang and Lee (2004b). The cross-training (CT) approach (Sarawagi, Chakrabarti, & Godbole, 2003) extracts the mappings from the first semi-supervised classification phase using the source documents as the training sets. Then, the destination documents are augmented with the latent mappings for the second semi-supervised classification phase to complete the integration. The co-bootstrapping (CB) approach (Zhang & Lee, 2004b) exploits the predicted source-destination mappings to repeatedly refine the classifiers. The experimental results show that both CT and CB outperform ENB (Sarawagi, Chakrabarti, & Godbole, 2003; Zhang & Lee, 2004b).
Hierarchical Taxonomy Integration Using 431 Semantic Feature Expansion on Category-Specific Terms
5.1 Data Sets
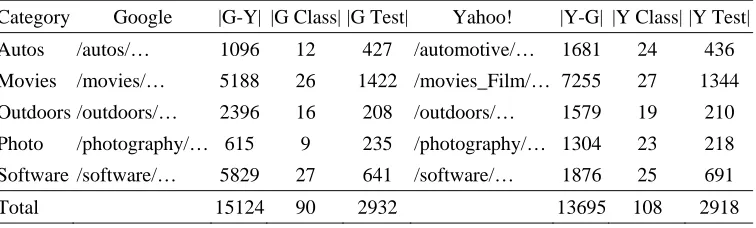
In the experiments, five directories from Yahoo! and Google were extracted to form two experimental taxonomies (Y and G). Table 2 shows these directories and the number of the extracted documents after ignoring the documents that could not be retrieved. As in previous studies (Agrawal & Srikan, 2001; Sarawagi, Chakrabarti, & Godbole, 2003; Ho, Chen, & Yang, 2006), the documents appearing in only one category were used as the training data (|Y-G| and |G-Y|), and the common documents were used as the testing data (|Y Test| and |G Test|). Since some documents may appear in more than one category in a taxonomy, |Y Test| is slightly different from |G Test|. For simplicity consideration, the level of each hierarchy was controlled to be at most three in the experiments. If the number of the documents of a certain subcategory was less than 10, the subcategory would be merged upward to its parent category.
Table 2. The experimental categories and the numbers of documents.
Category Google |G-Y| |G Class| |G Test| Yahoo! |Y-G| |Y Class| |Y Test| Autos /autos/… 1096 12 427 /automotive/… 1681 24 436 Movies /movies/… 5188 26 1422 /movies_Film/… 7255 27 1344 Outdoors /outdoors/… 2396 16 208 /outdoors/… 1579 19 210 Photo /photography/… 615 9 235 /photography/… 1304 23 218 Software /software/… 5829 27 641 /software/… 1876 25 691
Total 15124 90 2932 13695 108 2918
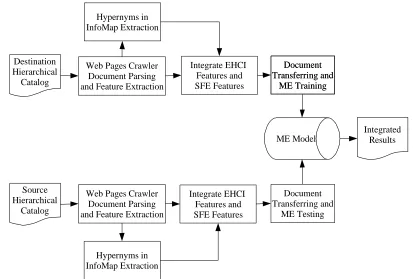
Before the integration, we used the stopword list in Frakes and Baeza-Yates (1992) to remove the stopwords, and the Porter algorithm (Porter, 1980) for stemming. In the integration process, we allow that each source document dxcan be integrated into multiple destination categories (one-to-many) as we find in real-world taxonomies. Different
λ
values from 0.1 to 1.0 were applied to the source taxonomy (λ
s) and the destination taxonomy (λ
d). To both taxonomies, the same α value ranging from 0.1 to 1.0 was applied for semantic feature expansion. The lexical dictionary used in the experiments was InfoMap to get hypernyms. As reported in Tseng et al. (2006), we believe that WordNet will result in similar hypernym performance.In the experiments, we measured the integration performance of EHCI-ME and SFE-ME in six scores: macro-averaged recall (MaR), micro-averaged recall (MiR), macro-averaged precision (MaP), micro-averaged precision (MiP), macro-averaged F1 measure (MaF), and micro-averaged F1 measure (MiF). The standard F1 measure is defined as the harmonic mean of recall and precision: F1=2rp r p+ , where recall is computed as
correctly integrated documents all test documents
r= and precision is computed as correctly integrated documents
all predicted positive documents
432 Cheng-Zen Yang et al.
computing the scores globally over all categories in five directories. The macro-averaged scores were measured by first computing the scores for each individual category, then averaging these scores. The recall measures are used to reflect the traditional performance measurements on integration accuracy. The precision measures show the degrees of false integration. The standard F1 measures show the compromised scores between recall and precision.
5.2
Experimental Results and Discussion
Although we have measured the integration performance with different
λ
values, this paper only lists part of the results in five differentλ
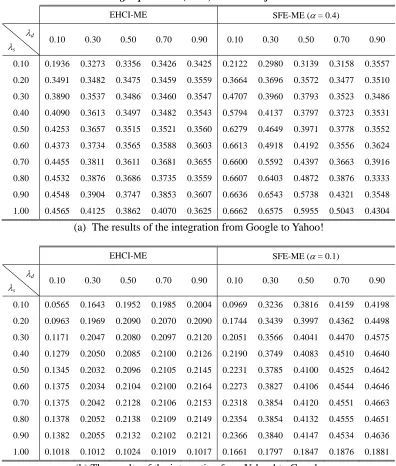
dvalues, which are 0.1, 0.3, 0.5, 0.7, and 0.9. Considering α, we have also measured the integration performance with different values ranging from 0.1 to 1.0. When α is between 0.1 and 0.4, SFE-ME is superior to EHCI-ME. For different integration directions, we found that the optimal αvaluemay be also different. Here, we only report two cases, α = 0.4 for integrating documents from Google to Yahoo! and α = 0.1 for integrating documents from Yahoo! to Google, in which the SFE approach can show its effectiveness.Table 3 and Table 4 show the macro-averaged and micro-averaged recall results of EHCI-ME and SFE-ME. The macro-averaged and micro-averaged precision results of EHCI-ME and SFE-ME are listed in Table 5 and Table 6. In Table 7 and Table 8, the macro-averaged and micro-averaged F1 measure results of EHCI-ME and SFE-ME are listed, respectively.
From Table 3 (a), we can notice that SFE-ME is superior to EHCI-ME in more than 75% of all MaR scores for the integrations from Google to Yahoo!. Although Table 3 (b) shows that SFE-ME can only achieve nearly 40% improvements for the integration from Yahoo! to Google, SFE-ME has consistent MaR performance. Two reasons cause this lower-than-average MaR performance. First, the recall performance of SFE-ME is not as good as EHCI-ME for categories with few positive examples in the Y→G integration process. This can be justified from the superior MiR performance of SFE-ME. Second, the
λ
d weight increasingly mitigates the improvements of SFE in the MaR measures of SFE-ME in a consistent way in the Y→G integration process. The MiR performance of SFE-ME also has the similar mitigation.From Table 3, we can also notice that SFE-ME achieves the best MaR of 0.8935 when
s
Hierarchical Taxonomy Integration Using 433 Semantic Feature Expansion on Category-Specific Terms
Table 3. The macro-averaged recall (MaR) measures of EHCI-ME and SFE-ME.
EHCI-ME SFE-ME (α= 0.4)
λd
λs
0.10 0.30 0.50 0.70 0.90 0.10 0.30 0.50 0.70 0.90
0.10 0.8023 0.7419 0.7320 0.7334 0.7175 0.8935 0.8618 0.8500 0.8489 0.8678
0.20 0.7636 0.7342 0.7274 0.7331 0.7192 0.7867 0.7845 0.7769 0.7742 0.7950
0.30 0.7481 0.7336 0.7315 0.7333 0.7210 0.7347 0.7501 0.7511 0.7476 0.7539
0.40 0.7422 0.7329 0.7283 0.7313 0.7197 0.7185 0.7367 0.7403 0.7374 0.7398
0.50 0.7362 0.7299 0.7272 0.7301 0.7204 0.7085 0.7310 0.7340 0.7337 0.7346
0.60 0.7317 0.7261 0.7262 0.7292 0.7207 0.7081 0.7284 0.7338 0.7338 0.7338
0.70 0.7262 0.7242 0.7233 0.7263 0.7191 0.6941 0.7227 0.7333 0.7338 0.7338
0.80 0.7231 0.7205 0.7232 0.7253 0.7235 0.6922 0.7208 0.7277 0.7304 0.7338
0.90 0.7192 0.7205 0.7191 0.7262 0.7243 0.6922 0.7146 0.7224 0.7275 0.7304
1.00 0.7186 0.7200 0.7181 0.7216 0.7211 0.7020 0.7138 0.7214 0.7223 0.7243
(a) The results of the integration from Google to Yahoo!
EHCI-ME SFE-ME (α= 0.1)
λd
λs
0.10 0.30 0.50 0.70 0.90 0.10 0.30 0.50 0.70 0.90
0.10 0.9022 0.7937 0.8287 0.8312 0.8290 0.8833 0.8285 0.8165 0.8079 0.8059
0.20 0.8798 0.7817 0.8205 0.8258 0.8242 0.8514 0.8261 0.8138 0.8124 0.8069
0.30 0.8294 0.7787 0.8185 0.8254 0.8228 0.8394 0.8240 0.8138 0.8117 0.8059
0.40 0.8256 0.7777 0.8177 0.8269 0.8214 0.8357 0.8237 0.8144 0.8121 0.8079
0.50 0.8200 0.7769 0.8169 0.8226 0.8201 0.8350 0.8237 0.8141 0.8124 0.8090
0.60 0.8180 0.7761 0.8169 0.8223 0.8217 0.8357 0.8233 0.8141 0.8127 0.8097
0.70 0.8165 0.7771 0.8198 0.8212 0.8204 0.8350 0.8233 0.8144 0.8127 0.8100
0.80 0.8162 0.7768 0.8157 0.8205 0.8189 0.8350 0.8233 0.8151 0.8131 0.8107
0.90 0.8161 0.7735 0.8103 0.8184 0.8157 0.8340 0.8230 0.8151 0.8138 0.8117
1.00 0.8202 0.8585 0.8640 0.8638 0.8633 0.8449 0.8425 0.8367 0.8367 0.8360
(b) The results of the integration from Yahoo! to Google
434 Cheng-Zen Yang et al.
and
λ
s≥
0.3, EHCI-ME outperforms SFE-ME for both MaR and MiR in the G→Y integration process. Considering theλ
d influences of Google’s hierarchical thesaurus information shown in Table 3 (b), the experimental results suggest that over-emphasizing the weight of Google’s hierarchical thesaurus information will impair the effectiveness of SFE. Table 4. The micro-averaged recall (MiR) measures of EHCI-ME and SFE-ME.EHCI-ME SFE-ME (α= 0.4)
λd
λs
0.10 0.30 0.50 0.70 0.90 0.10 0.30 0.50 0.70 0.90
0.10 0.8561 0.7999 0.7873 0.7945 0.7718 0.9301 0.9096 0.8972 0.8969 0.9109
0.20 0.8174 0.7807 0.7770 0.7934 0.7732 0.8369 0.8400 0.8325 0.8133 0.8284
0.30 0.7989 0.7797 0.7787 0.7907 0.7746 0.7838 0.8030 0.8058 0.7921 0.7962
0.40 0.7921 0.7797 0.7777 0.7873 0.7742 0.7698 0.7831 0.7917 0.7835 0.7849
0.50 0.7866 0.7787 0.7773 0.7862 0.7746 0.7640 0.7804 0.7821 0.7814 0.7825
0.60 0.7801 0.7773 0.7770 0.7859 0.7742 0.7650 0.7790 0.7818 0.7818 0.7818
0.70 0.7780 0.7766 0.7760 0.7831 0.7739 0.7585 0.7756 0.7814 0.7818 0.7818
0.80 0.7763 0.7739 0.7760 0.7828 0.7763 0.7575 0.7746 0.7780 0.7790 0.7818
0.90 0.7736 0.7739 0.7732 0.7831 0.7766 0.7575 0.7715 0.7760 0.7777 0.7790
1.00 0.7729 0.7736 0.7725 0.7801 0.7749 0.7619 0.7715 0.7753 0.7753 0.7766
(a) The results of the integration from Google to Yahoo!
EHCI-ME SFE-ME (α= 0.1)
λd
λs
0.10 0.30 0.50 0.70 0.90 0.10 0.30 0.50 0.70 0.90
0.10 0.8952 0.8620 0.8535 0.8559 0.8545 0.9055 0.8713 0.8699 0.8696 0.8679
0.20 0.8709 0.8504 0.8490 0.8535 0.8538 0.8768 0.8590 0.8572 0.8613 0.8610
0.30 0.8613 0.8480 0.8487 0.8538 0.8535 0.8651 0.8555 0.8538 0.8579 0.8548
0.40 0.8583 0.8473 0.8477 0.8545 0.8531 0.8610 0.8552 0.8542 0.8572 0.8528
0.50 0.8524 0.8470 0.8473 0.8528 0.8528 0.8596 0.8548 0.8528 0.8552 0.8446
0.60 0.8501 0.8466 0.8473 0.8531 0.8535 0.8593 0.8559 0.8524 0.8531 0.8442
0.70 0.8473 0.8473 0.8504 0.8524 0.8531 0.8579 0.8555 0.8514 0.8453 0.8439
0.80 0.8470 0.8470 0.8483 0.8521 0.8524 0.8572 0.8552 0.8483 0.8432 0.8425
0.90 0.8466 0.8459 0.8442 0.8514 0.8511 0.8562 0.8548 0.8473 0.8429 0.8425
1.00 0.8518 0.8562 0.8624 0.8627 0.8620 0.8552 0.8545 0.8463 0.8425 0.8418
Hierarchical Taxonomy Integration Using 435 Semantic Feature Expansion on Category-Specific Terms
From Table 5, we can notice that SFE-ME is superior to EHCI-ME in more than 80% of all MaP for the G→Y integration process, and in all cases for the Y→G integration process. In addition, SFE-ME achieves the best G→Y MaP of 0.6662 when
λ
s = 1.0 andλ
d = 0.1, and the best Y→G MaP of 0.4663 whenλ
s = 0.7 andλ
d = 0.9.Table 5. The macro-averaged precision (MaP) measures of EHCI-ME and SFE-ME.
EHCI-ME SFE-ME (α= 0.4)
λd
λs
0.10 0.30 0.50 0.70 0.90 0.10 0.30 0.50 0.70 0.90
0.10 0.1936 0.3273 0.3356 0.3426 0.3425 0.2122 0.2980 0.3139 0.3158 0.3557
0.20 0.3491 0.3482 0.3475 0.3459 0.3559 0.3664 0.3696 0.3572 0.3477 0.3510
0.30 0.3890 0.3537 0.3486 0.3460 0.3547 0.4707 0.3960 0.3793 0.3523 0.3486
0.40 0.4090 0.3613 0.3497 0.3482 0.3543 0.5794 0.4137 0.3797 0.3723 0.3531
0.50 0.4253 0.3657 0.3515 0.3521 0.3560 0.6279 0.4649 0.3971 0.3778 0.3552
0.60 0.4373 0.3734 0.3565 0.3588 0.3603 0.6613 0.4918 0.4192 0.3556 0.3624
0.70 0.4455 0.3811 0.3611 0.3681 0.3655 0.6600 0.5592 0.4397 0.3663 0.3916
0.80 0.4532 0.3876 0.3686 0.3735 0.3559 0.6607 0.6403 0.4872 0.3876 0.3333
0.90 0.4548 0.3904 0.3747 0.3853 0.3607 0.6636 0.6543 0.5738 0.4321 0.3548
1.00 0.4565 0.4125 0.3862 0.4070 0.3625 0.6662 0.6575 0.5955 0.5043 0.4304
(a) The results of the integration from Google to Yahoo!
EHCI-ME SFE-ME (α= 0.1)
λd
λs
0.10 0.30 0.50 0.70 0.90 0.10 0.30 0.50 0.70 0.90
0.10 0.0565 0.1643 0.1952 0.1985 0.2004 0.0969 0.3236 0.3816 0.4159 0.4198
0.20 0.0963 0.1969 0.2090 0.2070 0.2090 0.1744 0.3439 0.3997 0.4362 0.4498
0.30 0.1171 0.2047 0.2080 0.2097 0.2120 0.2051 0.3566 0.4041 0.4470 0.4575
0.40 0.1279 0.2050 0.2085 0.2100 0.2126 0.2190 0.3749 0.4083 0.4510 0.4640
0.50 0.1345 0.2032 0.2096 0.2105 0.2145 0.2231 0.3785 0.4100 0.4525 0.4642
0.60 0.1375 0.2034 0.2104 0.2100 0.2164 0.2273 0.3827 0.4106 0.4544 0.4646
0.70 0.1375 0.2042 0.2128 0.2106 0.2153 0.2318 0.3854 0.4120 0.4551 0.4663
0.80 0.1378 0.2052 0.2138 0.2109 0.2149 0.2354 0.3854 0.4132 0.4555 0.4651
0.90 0.1382 0.2055 0.2132 0.2102 0.2121 0.2366 0.3840 0.4147 0.4534 0.4636
1.00 0.1018 0.1012 0.1024 0.1019 0.1017 0.1661 0.1797 0.1847 0.1876 0.1881
436 Cheng-Zen Yang et al.
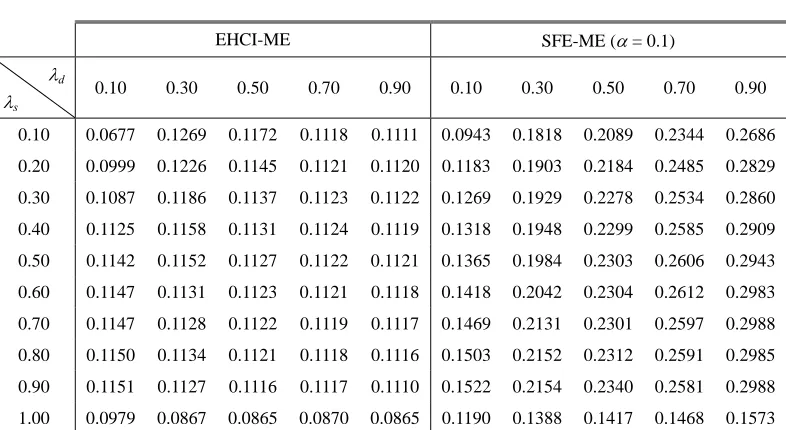
From Table 6, SFE-ME achieves the best G→Y MiP of 0.6078 when
λ
s= 0.9 andλ
d = 0.1, and the best Y→G MiP of 0.2988 whenλ
s = 0.7 andλ
d = 0.9. In addition, SFE-ME achieves MiP improvements in 90% of all cases for the G→Y integration process and in all cases for the Y→G integration process. These results show that the number of incorrectly integrated documents in SFE-ME is much lower. With high precision performance, SFE-ME may reduce a lot of time for users in manually verifying the integration correctness. Table 6. The micro-averaged precision (MiP) measures of EHCI-ME and SFE-ME.EHCI-ME SFE-ME (α= 0.4)
λd
λs
0.10 0.30 0.50 0.70 0.90 0.10 0.30 0.50 0.70 0.90
0.10 0.1156 0.2504 0.2715 0.2740 0.2817 0.1205 0.2835 0.3099 0.2782 0.3687
0.20 0.2253 0.3018 0.2947 0.2822 0.3080 0.1569 0.3661 0.3570 0.3504 0.3629
0.30 0.2741 0.3170 0.2984 0.2858 0.3107 0.2737 0.3777 0.3946 0.3515 0.3642
0.40 0.3136 0.3329 0.3002 0.2897 0.3115 0.4721 0.3834 0.3776 0.3866 0.3688
0.50 0.3494 0.3390 0.3033 0.2695 0.3135 0.5581 0.4556 0.3862 0.3879 0.3666
0.60 0.3763 0.3475 0.3101 0.3101 0.3199 0.6061 0.4663 0.4032 0.3147 0.3700
0.70 0.3906 0.3583 0.3192 0.3336 0.3317 0.6041 0.4924 0.3952 0.3180 0.4151
0.80 0.3966 0.3759 0.3334 0.3485 0.3414 0.6016 0.5824 0.4335 0.3229 0.3452
0.90 0.3987 0.3826 0.3402 0.3734 0.3540 0.6078 0.5871 0.4726 0.3509 0.3800
1.00 0.3992 0.4332 0.3772 0.4198 0.3568 0.5999 0.5894 0.4937 0.3879 0.3974
(a) The results of the integration from Google to Yahoo!
EHCI-ME SFE-ME (α= 0.1)
λd
λs
0.10 0.30 0.50 0.70 0.90 0.10 0.30 0.50 0.70 0.90
0.10 0.0677 0.1269 0.1172 0.1118 0.1111 0.0943 0.1818 0.2089 0.2344 0.2686
0.20 0.0999 0.1226 0.1145 0.1121 0.1120 0.1183 0.1903 0.2184 0.2485 0.2829
0.30 0.1087 0.1186 0.1137 0.1123 0.1122 0.1269 0.1929 0.2278 0.2534 0.2860
0.40 0.1125 0.1158 0.1131 0.1124 0.1119 0.1318 0.1948 0.2299 0.2585 0.2909
0.50 0.1142 0.1152 0.1127 0.1122 0.1121 0.1365 0.1984 0.2303 0.2606 0.2943
0.60 0.1147 0.1131 0.1123 0.1121 0.1118 0.1418 0.2042 0.2304 0.2612 0.2983
0.70 0.1147 0.1128 0.1122 0.1119 0.1117 0.1469 0.2131 0.2301 0.2597 0.2988
0.80 0.1150 0.1134 0.1121 0.1118 0.1116 0.1503 0.2152 0.2312 0.2591 0.2985
0.90 0.1151 0.1127 0.1116 0.1117 0.1110 0.1522 0.2154 0.2340 0.2581 0.2988
1.00 0.0979 0.0867 0.0865 0.0870 0.0865 0.1190 0.1388 0.1417 0.1468 0.1573
Hierarchical Taxonomy Integration Using 437 Semantic Feature Expansion on Category-Specific Terms
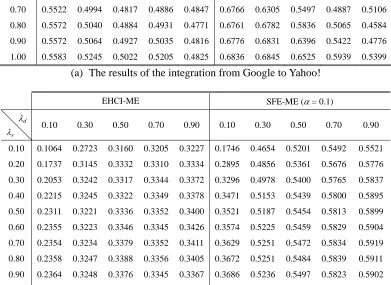
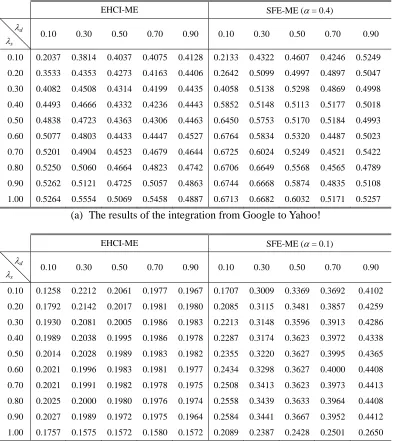
For many applications, a compromised performance may be required with a high F1 score. From Table 7 and Table 8, we can notice that SFE-ME is superior to EHCI-ME in nearly 90% of all MaF and MiF scores for the G→Y integration process, and it has consistent improvements in all cases for the Y→G integration process. In our experiments with α = 0.4, SFE-ME achieves the highest MaF (0.6839) and the highest MiF (0.6764) when
λ
s = 0.6 andλ
d = 0.1 for the G→Y integration process. For the Y→G integration process, SFE-ME achieves the highest MaF (0.5919) and the highest MiF (0.4413) when α = 0.1,λ
s = 0.7, andd
λ
= 0.9. These two tables show that the SFE scheme can mostly get more balanced improvements in both recall and precision considerations.Table 7. The macro-averaged F1 (MaF) measures of EHCI-ME and SFE-ME.
EHCI-ME SFE-ME (α= 0.4)
λd
λs
0.10 0.30 0.50 0.70 0.90 0.10 0.30 0.50 0.70 0.90
0.10 0.3119 0.4556 0.4602 0.4670 0.4637 0.3430 0.4428 0.4585 0.4603 0.5046
0.20 0.4792 0.4724 0.4703 0.4700 0.4761 0.5000 0.5025 0.4894 0.4799 0.4870
0.30 0.5118 0.4773 0.4722 0.4702 0.4755 0.5738 0.5184 0.5041 0.4789 0.4767
0.40 0.5274 0.4840 0.4725 0.4718 0.4748 0.6415 0.5299 0.5020 0.4948 0.4780
0.50 0.5391 0.4872 0.4739 0.4751 0.4765 0.6658 0.5684 0.5154 0.4988 0.4789
0.60 0.5475 0.4932 0.4782 0.4810 0.4804 0.6839 0.5871 0.5336 0.4790 0.4852
0.70 0.5522 0.4994 0.4817 0.4886 0.4847 0.6766 0.6305 0.5497 0.4887 0.5106
0.80 0.5572 0.5040 0.4884 0.4931 0.4771 0.6761 0.6782 0.5836 0.5065 0.4584
0.90 0.5572 0.5064 0.4927 0.5035 0.4816 0.6776 0.6831 0.6396 0.5422 0.4776
1.00 0.5583 0.5245 0.5022 0.5205 0.4825 0.6836 0.6845 0.6525 0.5939 0.5399
(a) The results of the integration from Google to Yahoo!
EHCI-ME SFE-ME (α= 0.1)
λd
λs
0.10 0.30 0.50 0.70 0.90 0.10 0.30 0.50 0.70 0.90
0.10 0.1064 0.2723 0.3160 0.3205 0.3227 0.1746 0.4654 0.5201 0.5492 0.5521
0.20 0.1737 0.3145 0.3332 0.3310 0.3334 0.2895 0.4856 0.5361 0.5676 0.5776
0.30 0.2053 0.3242 0.3317 0.3344 0.3372 0.3296 0.4978 0.5400 0.5765 0.5837
0.40 0.2215 0.3245 0.3322 0.3349 0.3378 0.3471 0.5153 0.5439 0.5800 0.5895
0.50 0.2311 0.3221 0.3336 0.3352 0.3400 0.3521 0.5187 0.5454 0.5813 0.5899
0.60 0.2355 0.3223 0.3346 0.3345 0.3426 0.3574 0.5225 0.5459 0.5829 0.5904
0.70 0.2354 0.3234 0.3379 0.3352 0.3411 0.3629 0.5251 0.5472 0.5834 0.5919
0.80 0.2358 0.3247 0.3388 0.3356 0.3405 0.3672 0.5251 0.5484 0.5839 0.5911
0.90 0.2364 0.3248 0.3376 0.3345 0.3367 0.3686 0.5236 0.5497 0.5823 0.5902
1.00 0.1811 0.1810 0.1831 0.1823 0.1820 0.2776 0.2962 0.3026 0.3064 0.3071
438 Cheng-Zen Yang et al.
We have also measured these six scores for the
λ
s = 0.0,λ
d = 0.0, and α = 0.0 cases, which means that the integration is performed by only ME without EHCI and SFE enhancements. In this configuration, for the G→Y integration process, ME can achieve very prominent recall performance in MaR (0.9578) and MiR (0.9616) but with poor precision performance in MaP (0.0111) and MiP (0.0111). Its MaF and MiF are 0.022 and 0.0219, respectively. For the Y→G integration process, ME has similar performance. Although ME can attain the best recall performance, these results show that it allows many documents of other categories to be incorrectly integrated.Table 8. The micro-averaged F1 (MiF) measures of EHCI-ME and SFE-ME.
EHCI-ME SFE-ME (α= 0.4)
λd
λs
0.10 0.30 0.50 0.70 0.90 0.10 0.30 0.50 0.70 0.90
0.10 0.2037 0.3814 0.4037 0.4075 0.4128 0.2133 0.4322 0.4607 0.4246 0.5249
0.20 0.3533 0.4353 0.4273 0.4163 0.4406 0.2642 0.5099 0.4997 0.4897 0.5047
0.30 0.4082 0.4508 0.4314 0.4199 0.4435 0.4058 0.5138 0.5298 0.4869 0.4998
0.40 0.4493 0.4666 0.4332 0.4236 0.4443 0.5852 0.5148 0.5113 0.5177 0.5018
0.50 0.4838 0.4723 0.4363 0.4306 0.4463 0.6450 0.5753 0.5170 0.5184 0.4993
0.60 0.5077 0.4803 0.4433 0.4447 0.4527 0.6764 0.5834 0.5320 0.4487 0.5023
0.70 0.5201 0.4904 0.4523 0.4679 0.4644 0.6725 0.6024 0.5249 0.4521 0.5422
0.80 0.5250 0.5060 0.4664 0.4823 0.4742 0.6706 0.6649 0.5568 0.4565 0.4789
0.90 0.5262 0.5121 0.4725 0.5057 0.4863 0.6744 0.6668 0.5874 0.4835 0.5108
1.00 0.5264 0.5554 0.5069 0.5458 0.4887 0.6713 0.6682 0.6032 0.5171 0.5257
(a) The results of the integration from Google to Yahoo!
EHCI-ME SFE-ME (α= 0.1)
λd
λs
0.10 0.30 0.50 0.70 0.90 0.10 0.30 0.50 0.70 0.90
0.10 0.1258 0.2212 0.2061 0.1977 0.1967 0.1707 0.3009 0.3369 0.3692 0.4102
0.20 0.1792 0.2142 0.2017 0.1981 0.1980 0.2085 0.3115 0.3481 0.3857 0.4259
0.30 0.1930 0.2081 0.2005 0.1986 0.1983 0.2213 0.3148 0.3596 0.3913 0.4286
0.40 0.1989 0.2038 0.1995 0.1986 0.1978 0.2287 0.3174 0.3623 0.3972 0.4338
0.50 0.2014 0.2028 0.1989 0.1983 0.1982 0.2355 0.3220 0.3627 0.3995 0.4365
0.60 0.2021 0.1996 0.1983 0.1981 0.1977 0.2434 0.3298 0.3627 0.4000 0.4408
0.70 0.2021 0.1991 0.1982 0.1978 0.1975 0.2508 0.3413 0.3623 0.3973 0.4413
0.80 0.2025 0.2000 0.1980 0.1976 0.1974 0.2558 0.3439 0.3633 0.3964 0.4408
0.90 0.2027 0.1989 0.1972 0.1975 0.1964 0.2584 0.3441 0.3667 0.3952 0.4412
1.00 0.1757 0.1575 0.1572 0.1580 0.1572 0.2089 0.2387 0.2428 0.2501 0.2650
Hierarchical Taxonomy Integration Using 439 Semantic Feature Expansion on Category-Specific Terms
The experimental results show that SFE-ME can get more improved integration performance with the SFE scheme. Compared with EHCI-ME, SFE-ME shows that the semantic information of the hypernyms of the category-specific terms can be used to facilitate the integration process between two hierarchical taxonomies.
6.
Conclusion
In recent years, the taxonomy integration problem has been progressively studied for integrating two homogeneous hierarchical taxonomies. Many types of implicit information embedded in the source taxonomy are explored to improve the integration performance. The semantic information embedded in the source taxonomy, however, has not been discussed in previous research.
In this paper, an enhanced integration approach (SFE) is proposed to exploit the semantic information of the hypernyms of the category-specific terms. Augmented with these additional semantic category features, the source documents can be more precisely integrated into the correct destination category in the experiments. The experimental results show that SFE-ME can achieve the best macro-averaged F1 score and the best micro-averaged F1 score. The results also show that the SFE scheme can get precision and recall enhancements in a significant portion of all cases.
There are still some issues left for future study. For example, the effectiveness of SFE on other classification schemes, such as SVM and NB, may need to be investigated to decide which one has the best integration performance. In addition, deciding the optimal parameter configuration is a classical classification problem which is also important to the taxonomy integration problem. Although mining more valuable implicit information can be a tough challenge, we believe that the integration performance can be further improved with appropriate assistance of more effective auxiliary information and advanced classifiers.
Acknowledgement
This work was supported in part by National Science Council of R.O.C. under grant NSC 96-2422-H-006-002 and NSC 96-2221-E-155-067. The authors would also like to express their gratitude to the anonymous reviewers for their precious comments.
References
Agrawal, R., & Srikan, R. (2001). On Integrating Catalogs. in Proceedings of the 10th International Conference on World Wide Web, 603-612.
440 Cheng-Zen Yang et al.
Chen, I.-X., Ho, J.-C., & Yang, C.-Z. (2005). An Iterative Approach for Web Catalog Integration with Support Vector Machines. in Proceedings of the 2nd Asia Information Retrieval Symposium(AIRS 2005), 703-708.
Chen, I.-X., Ho, J.-C., & Yang, C.-Z. (2007). Hierarchical Web Catalog Integration with Conceptual Relationships in a Thesaurus. International Journal of Computational Linguistics and Chinese Language Processing, 12(2), 155-174.
Cheng, T.-H., & Wei, C.-P. (2008). A Clustering-based Approach for Integrating Document-Category Hierarchies. IEEE Transactions on Systems, Man, and Cybernetics – Part A: Systems and Humans, 38(2), 410-424.
Darroch, J. N., & Ratcliff, D. (1972). Generalized Iterative Scaling for Log-linear Models. Annals of Mathematical Statistics, 43, 1470-1480.
Frakes, W., & Baeza-Yates, R. (1992). Information Retrieval: Data Structures and Algorithms, 1st edition, Prentice Hall, PTR.
Ho, J.-C., Chen, I.-X., & Yang, C.-Z. (2006). Learning to Integrate Web Catalogs with Conceptual Relationships in Hierarchical Thesaurus. in Proceedings of the 3rd Asia Information Retrieval Symposium(AIRS 2006), 217-229.
Hsu, M.-H., Tsai, M.-F., & Chen, H.-H. (2006). Query Expansion with ConceptNet and WordNet: an Intrinsic Comparison. in Proceedings of the 3rd Asia Information Retrieval Symposium (AIRS 2006), 1-13.
Krikos, V., Stamou, S., Kokosis, P., Ntoulas, A., & Christodoulakis, D. (2005). DirectoryRank: Ordering Pages in Web Directories. in Proceedings of the 7th ACM International Workshop on Web Information and Data Management(WIDM 2005), 17-22.
Ng, H.-T., Goh, W.-B., & Low, K.-L. (1997). Feature selection, Perception Learning, and a Usability Case Study for Text Categorization. in Proceedings of the 20th Annual International ACM SIGIR Conference on Research and Development in Information Retrieval, 67-73.
Sarawagi, S., Chakrabarti, S., & Godbole, S. (2003). Cross-training: Learning Probabilistic Mappings between Topics. in Proceedings of the 9th ACM SIGKDD International Conference on Knowledge Discovery and Data Mining, 177-186.
Tseng, Y.-H., Lin, C.-J., Chen, H.-H., & Lin, Y.-I. (2006). Toward Generic Title Generation for Clustered Documents. in Proceedings of the 3rd Asia Information Retrieval Symposium(AIRS 2006), 145-157.
Wu, C.-W., Tsai, T.-H., & Hsu, W.-L. (2005). Learning to Integrate Web Taxonomies with Fine-Grained Relations: A Case Study Using Maximum Entropy Model. in Proceedings of the 2nd Asia Information Retrieval Symposium(AIRS 2005)
, 190-205.
Hierarchical Taxonomy Integration Using 441 Semantic Feature Expansion on Category-Specific Terms
Yang, Y., & Pedersen, J. O. (1997). A Comparative Study on Feature Selection in Text Categorization. in Proceedings of the 14th International Conference on Machine Learning(ICML’97), 412-420.
Zhang, D., & Lee, W.-S. (2004a). Web Taxonomy Integration using Support Vector Machines. in Proceedings of the 13th International Conference on World Wide Web, 472-481. Zhang, D., & Lee, W.-S. (2004b). Web Taxonomy Integration Through Co-Bootstrapping. in
Proceedings of the 27th Annual International ACM SIGIR Conference on Research and
Development in Information Retrieval, 410–417.
Zhu, S., Yang, C. C., & Lam, W. (2004). CatRelate: A New Hierarchical Document Category Integration Algorithm by learning Category Relationships. in Proceedings of the 7th International Conference on Asian Digital Libraries (ICADL 2004), Shanghai, China, 280-289.
Online Resources
Information Mapping Project, Computational Semantics Laboratory, Stanford University. http://infomap.stanford.edu/.
The Porter Stemming Algorithm., http://tartarus.org/˜martin/PorterStemmer.
WordNet, A lexical database for the English language: Cognitive Science Laboratory, Princeton University, http://wordnet.princeton.edu/.
442 Cheng-Zen Yang et al.