Computational Linguistics and Chinese Language Processing
Vol. 12, No. 2, June 2007, pp. 217-238 217
© The Association for Computational Linguistics and Chinese Language Processing
[Received March 2, 2007; Revised July 4, 2007; Accepted July 12, 2007]
A Comparative Study of Histogram Equalization (HEQ)
for Robust Speech Recognition
Shih-Hsiang Lin
∗, Yao-Ming Yeh
∗, and Berlin Chen
∗Abstract
The performance of current automatic speech recognition (ASR) systems often deteriorates radically when the input speech is corrupted by various kinds of noise sources. Quite a few techniques have been proposed to improve ASR robustness over the past several years. Histogram equalization (HEQ) is one of the most efficient techniques that have been used to reduce the mismatch between training and test acoustic conditions. This paper presents a comparative study of various HEQ approaches for robust ASR. Two representative HEQ approaches, namely, the table-based histogram equalization (THEQ) and the quantile-based histogram equalization (QHEQ), were first investigated. Then, a polynomial-fit histogram equalization (PHEQ) approach, exploring the use of the data fitting scheme to efficiently approximate the inverse of the cumulative density function of training speech for HEQ, was proposed. Moreover, the temporal average (TA) operation was also performed on the feature vector components to alleviate the influence of sharp peaks and valleys caused by non-stationary noises. All the experiments were carried out on the Aurora 2 database and task. Very encouraging results were initially demonstrated. The best recognition performance was achieved by combing PHEQ with TA. Relative word error rate reductions of 68% and 40% over the MFCC-based baseline system, respectively, for clean- and multi- condition training, were obtained.
Keywords: Automatic Speech Recognition, Robustness, Histogram Equalization, Data Fitting, Temporal Average
1.
INTRODUCTION
With the successful development of much smaller electronic devices and the popularity of wireless communication and networking, it is widely believed that speech will play a more
∗
Department of Computer Science & Information Engineering, National Taiwan Normal University, Taipei, Taiwan
218 Shih-Hsiang Lin et al.
active role and will serve as the major human machine interface (HMI) for the interaction between people and different kinds of smart devices in the near future [Lee and Chen 2005]. Therefore, automatic speech recognition (ASR) has long been one of the major preoccupations of research in the speech and language processing community. Nevertheless, varying environmental effects, such as ambient noise, noises caused by the recording equipment and transmission channels, etc., often lead to a severe mismatch between the acoustic conditions for training and test. Such a mismatch will no doubt cause substantial degradation in the performance of an ASR system. Substantial effort has been made and a large number of techniques have been presented in the last few decades to cope with this issue for improving ASR performance [Gong 1995; Junqua et al. 1996; Huang et al. 2001]. In general, they fall into three main categories [Gong 1995]:
z Speech enhancement, which removes the noise from the observed speech signal. z Robust speech features extraction, which searches for noise resistant and robust features. z Acoustic model adaptation, which transforms acoustic models from the training (clean)
space to the test (noisy) space.
A Comparative Study of Histogram Equalization (HEQ) for 219 Robust Speech Recognition
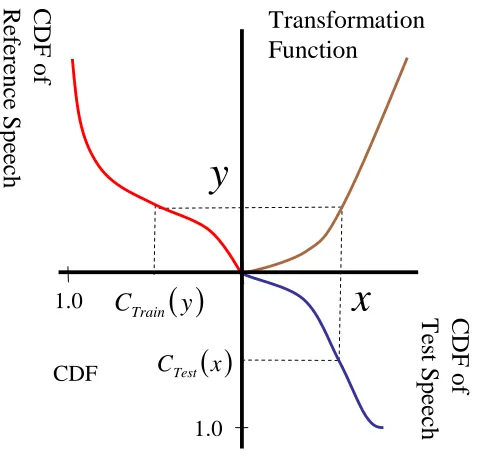
Feature space normalization is believed to be a simpler and more effective way to compensate for the mismatch caused by noise, and it has also demonstrated the capability to prevent the degradation of ASR performance under various noisy environments. Several attractive techniques have been successfully developed and integrated into the state-of-the-art ASR systems. As an example, the cepstral mean subtraction (CMS) [Furui 1981] is a simple but effective technique for removing the time-invariant distortion introduced by the transmission channel; while a natural extension of CMS, called the cepstral mean and variance normalization (CMVN) [Vikki and Laurila 1998], attempts to normalize not only the means of speech features but also their variances. Although these two techniques have already shown their capabilities in compensating for channel distortions and some side effects resulting from additive noises, their linear properties still make them inadequate in tackling the nonlinear distortions caused by various noisy environments [Torre et al. 2005]. Accordingly, a considerable amount of work on seeking more general solutions for feature space normalization has been done over the past several years. For example, not content with using either CMN or CMVN merely to normalize the first or the first two moments of the probability distributions of speech features, some researchers have extended the principal idea of CMN and CMVN to the normalization of the third [Suk et al. 1999] or even more higher order moments of the probability distributions of speech features [Hsu and Lee 2004, 2006]. On the other hand, the histogram equalization (HEQ) techniques also have gained much attention, and have been widely investigated in recent years [Dharanipragada and Padmanabhan 2000; Molau et al. 2005; Torre et al. 2005; Hilger and Ney 2006; Lin et al. 2006]. HEQ seeks for a transformation mechanism that can map the distribution of the test speech onto a predefined (or reference) distribution utilizing the relationship between the cumulative distribution functions (CDFs) of the test speech and those of the training (or reference) speech. Therefore, HEQ not only attempts to match the means and variances of speech features but also completely match the distributions of speech features between training and test. More specifically, HEQ normalizes all moments of the probability distributions of test speech features to those of the reference ones. However, most of the current HEQ techniques still have some inherent drawbacks for practical usage. For example, they require either large storage consumption or considerable online computational overhead, which might make them infeasible when being applied to the ASR systems built on devices with limited resources, such as personal digital assistants (PDAs), smart phones and embedded systems, etc.
220 Shih-Hsiang Lin et al.
approach, exploring the use of the data fitting scheme to efficiently approximate the inverse of the cumulative density function of training speech for HEQ, was proposed. Moreover, the temporal average (TA) operation was also performed on the feature vector components to alleviate the influence of sharp peaks and valleys that were caused by non-stationary noises.
The remainder of this paper is organized as follows. Section 2 describes the basic concept of HEQ and reviews two representative HEQ approaches, namely, THEQ and QHEQ. Section 3 elucidates our proposed HEQ approach, namely, PHEQ, and also briefly introduces several standard temporal average operations. Section 4 gives an overview of the Aurora 2 database as well as a description of the experimental setup, while the corresponding experimental results and discussions are also presented in this section. Finally, conclusions are drawn in Section 5.
2.
HISTOGRAM EQUALIZATION (HEQ)
2.1
Theoretical Foundation of HEQ
Histogram equalization is a popular feature compensation technique that has been well studied and practiced in the field of image processing for normalizing the visual features of digital images, such as the brightness, grey-level scale, contrast, and so forth. It has also been introduced to the field of speech processing for normalizing the speech features for robust ASR, and many good approaches have been continuously proposed and reported in the literature [Dharanipragada and Padmanabhan 2000; Molau et al. 2003; Torre et al. 2005; Hilger and Ney 2006; Lin et al. 2006]. Meanwhile, HEQ has shown its superiority over the conventional linear normalization techniques, such as CMN and CMVN, for robust ASR. One additional advantage of HEQ is that it can be easily incorporated with most feature representations and other robustness techniques without the need of any prior knowledge of the actual distortions caused by different kinds of noises.
222 Shih-Hsiang Lin et al.
where CTest
( )
x and CTrain( )
y are the CDFs for the test and training speech, respectively; y′ is the corresponding output of the transformation function F x( )
′ ; and the transformation function F x( )
has the following property:( )
1(
( )
)
,Train Test
F x =C− C x
(3)
where 1
Train
C− is the inverse function of CTrain.
It is worth noting that the reliability of CDF estimation will have a significant influence on the performance of HEQ. Due to the finite number of speech features being considered, the CDFs of speech features are usually approximated by the cumulative histograms of speech features for practical implementation. The CDFs of speech features can be accurately and reliably approximated when there is a large amount of data available. On the contrary, such approximation will probably not be accurate enough when the (test) speech utterance becomes much shorter. Several studies have shown that the order-statistics based method tends to be more accurate than the cumulative-histogram based when the amount of speech data is insufficient for reliable approximation of CDFs [Segura et al. 2004; Torre et al. 2005].
2.2
Table-Based Histogram Equalization (THEQ)
The table-based histogram equalization (THEQ) was first proposed by Dharanipragada and Padmanabhan [Dharanipragada and Padmanabhan 2000] and is a non-parametric method to let the distributions of the test speech match those of the training speech. THEQ uses a cumulative histogram to estimate the corresponding CDF value of each feature vector component y. During the training phase, the cumulative histogram of each feature vector component y of the training data is constructed as follows. The range of values of each feature vector dimension over the entire training data is first determined by finding the feature vector components ymax and ymin that have the maximum and minimum values, respectively. Let K be the total number of histogram bins and the range ⎡⎣ymin,ymax⎤⎦ is then divided into K non-overlapped bins of equal size,
{
B B0, 1,"BK−1}
. Next, the entire training data is scanned once and each individual feature vector component falls exactly into one bin. Thus, if we let N be the total number of training feature vector components of one specific dimension and ni be the number of feature vector components of that dimension belonging to Bi, the probability of feature vector components of that dimension being in Biis approximated by:
( )
i.Train i
n
p B
N
226 Shih-Hsiang Lin et al.
has moderate flexibility in controlling the shape of the function. Though the polynomial function is efficient in delineating the transformation function, it is worth mentioning that the polynomial function to some extent has its inherent limitations. For example, high order polynomial functions might lead to over-fitting of the training data. Moreover, the polynomial function provides good fits for input data points that are located within the range of values of the training data, but would also probably have rapid deterioration when the input data points are located outside the range of values of the training data.
3.2
Temporal Average (TA)
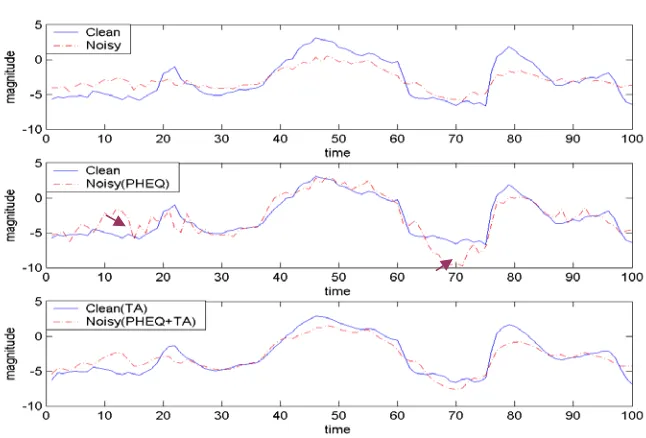
Though the above HEQ approaches are very effective in matching the global feature statistics of the test (or noisy) speech to that of the training (or reference) set, we found that some undesired sharp peaks or valleys of the feature vector component sequence caused by the non-stationary noises often occurring during the equalization process. This phenomenon is illustrated in the upper and middle parts of Figure 2. Therefore, we believe that a rigorous smoothing operation further performed on the time trajectory of the HEQ restored feature vector component sequence will be helpful for suppressing the extraordinary changes of component values. From the other perspective, temporal average can be treated as a low-pass filter. The basic idea of TA is quite similar to RelAtive SpecTrA (RASTA) [Hermansky and Morgan 1994] which aims to filter out the slow-varying or fast-varying artifacts (or noises) based on the evidence of human auditory perception. The main differences between TA and RASTA are the target (or feature domain) where the smoothing operation is performed and the
228 Shih-Hsiang Lin et al.
babble noise, etc.) in a wide range of SNRs (-5 dB, 0 dB, 5 dB, 10 dB, 15 dB, 20 dB and Clean) and Test Set C additionally includes channel distortions. For the baseline system, the training and recognition tests used the HTK recognition toolkit [Young et al. 2005], following the original setup defined for the ETSI AURORA evaluations [Hirsch and Pearce 2002].
More specifically, each digit was modeled as a left-to-right continuous density hidden Markov model (CDHMM) with 16 states and three diagonal Gaussian mixtures per state. Two additional CDHMMs were defined for the silence. The first one had three states with six diagonal Gaussian mixtures per state for modeling the silence at the beginning and at the end of each utterance. The other one had one state with 6 diagonal Gaussian mixtures for modeling the inter-word short pause. In the front-end speech analysis, the frame length is 25 ms and the corresponding frame shift is 10 ms. Speech frames are pre-emphasized using a factor of 0.97, and the Hamming window is then applied. From a set of 23 Mel-scaled log filter banks outputs a 39-dimensional feature vector, consisting of 12 Mel-frequency cepstral coefficients (MFCCs), the 0-th cepstral coefficient, and the corresponding delta and acceleration coefficients, is extracted at each speech frame. The average word error rate (WER) results obtained by the MFCC-based baseline system are 45.44% and 14.65%, respectively, for clean- and multi-condition training, each of which is an average of the WER results of the test utterances respectively contaminated with eight types of noises under different SNR levels (0 dB to 20 dB) for the three sets (Sets A, B and C).
4.2
Experiments on HEQ Approached
Table 1. Average WER results (%) of THEQ for clean-condition training, with respect to different numbers of histogram bins and different sizes of table.
Table Size
10 50 100 500 1000 5000 10000 50000
100 41.32 45.65 46.39 44.59 44.55 44.65 44.67 44.65
500 33.21 28.60 25.44 22.42 22.42 22.41 22.45 22.41
1000 29.63 24.19 22.12 19.19 19.04 19.46 19.88 19.87
5000 28.13 23.72 20.68 18.22 18.02 18.18 18.19 18.10
10000 27.64 23.50 20.50 18.33 18.10 18.13 18.30 18.32
50000 27.46 23.30 20.29 18.58 18.41 18.46 18.47 18.45
H
istog
ra
m Bin Nu
mb
er
230 Shih-Hsiang Lin et al.
( )
H x might instead degrade the recognition performance [Hilger and Ney 2001]. However, the optimum number of quantiles is found to be four for the Aurora 2 task studied here, and the corresponding relative WER improvements over the MFCC-based baseline system are 50% and 30% for clean- and multi-condition training, respectively.
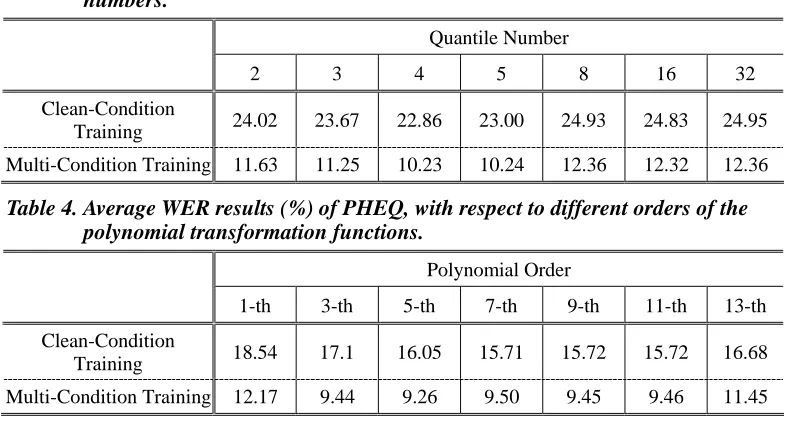
In the third set of experiments, we evaluate the performance of PHEQ with respect to different polynomial orders and the associated results are presented in Table 4. Due to the end behavior property of polynomial functions, even order polynomials are either “up” on both ends or “down” on both ends which is not appropriate to characterize the behavior of a cumulative distribution [Lial et al. 2006]. Therefore, only odd-order polynomials are utilized in this paper for PHEQ. As evidenced by the results shown in Table 4, the average WER results of PHEQ are slightly improved when the order of the polynomial function becomes higher. However, as the order increases, the polynomial function might sometimes tend to over-fit of the training data. The improvement of PHEQ seems to saturate when the order is set to seven. As is indicated, PHEQ yields about a relative WER improvement of 65% for clean-condition training, and 35% for multi-conditions training, as compared to the MFCC-based baseline system.
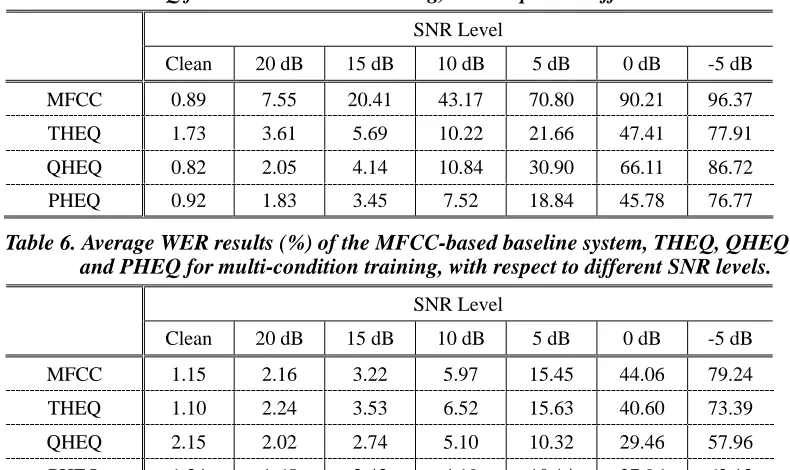
To go a step further, the average WER results under different SNR levels for the MFCC baseline, THEQ, QHEQ and PHEQ are shown in Tables 5 and 6, for clean- and multi-condition training, respectively. In the case of clean-condition training, these three HEQ approaches all yield significant improvement over the MFCC-based baseline, especially when the SNR level becomes much lower (e.g., 10 dB, 5 dB or 0 dB). The average WERs for
Table 3. Average WER results (%) of QHEQ, with respect to different quantile numbers.
Quantile Number
2 3 4 5 8 16 32
Clean-Condition
Training 24.02 23.67 22.86 23.00 24.93 24.83 24.95
Multi-Condition Training 11.63 11.25 10.23 10.24 12.36 12.32 12.36
Table 4. Average WER results (%) of PHEQ, with respect to different orders of the polynomial transformation functions.
Polynomial Order
1-th 3-th 5-th 7-th 9-th 11-th 13-th
Clean-Condition
Training 18.54 17.1 16.05 15.71 15.72 15.72 16.68
A Comparative Study of Histogram Equalization (HEQ) for 231 Robust Speech Recognition
clean-condition training are 18.02%, 15.71% and 22.86% for THEQ, PHEQ and QHEQ, respectively. In the case of multi-condition training, the average WER results for these three HEQ approaches are slightly better than that of the MFCC-based baseline system (average WERs of 12.30%, 9.5% and 10.23% for THEQ, PHEQ and QHEQ, respectively) which might mainly be due to the fact that with multi-condition training, the mismatch between the training and test conditions can be reduced to a great extent.
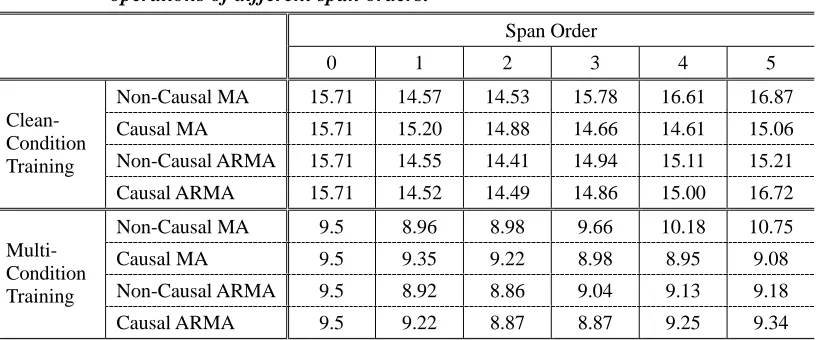
On the other hand, Table 7 shows the average WER results obtained by combining PHEQ with different temporal average (TA) operations of different span orders. When the span order is set to 0, it denotes that only PHEQ was applied to the feature vector components. The results in Table 7 demonstrate that combining PHEQ with anyone of the TA operations can further provide an additional relative WER reduction of about 5% to 8%. In a word, the TA operations conducted after HEQ indeed provide a good compensation for non-stationary noises. Nevertheless, TA operations with much higher span orders may instead result in the degradation of the recognition performance.
Table 5. Average WER results (%) of the MFCC-based baseline system, THEQ, QHEQ and PHEQ for clean-condition training, with respect to different SNR levels.
SNR Level
Clean 20 dB 15 dB 10 dB 5 dB 0 dB -5 dB
MFCC 0.89 7.55 20.41 43.17 70.80 90.21 96.37
THEQ 1.73 3.61 5.69 10.22 21.66 47.41 77.91
QHEQ 0.82 2.05 4.14 10.84 30.90 66.11 86.72
PHEQ 0.92 1.83 3.45 7.52 18.84 45.78 76.77
Table 6. Average WER results (%) of the MFCC-based baseline system, THEQ, QHEQ and PHEQ for multi-condition training, with respect to different SNR levels.
SNR Level
Clean 20 dB 15 dB 10 dB 5 dB 0 dB -5 dB
MFCC 1.15 2.16 3.22 5.97 15.45 44.06 79.24
THEQ 1.10 2.24 3.53 6.52 15.63 40.60 73.39
QHEQ 2.15 2.02 2.74 5.10 10.32 29.46 57.96
232 Shih-Hsiang Lin et al.
4.3
Comparison with Other Normalization Approaches
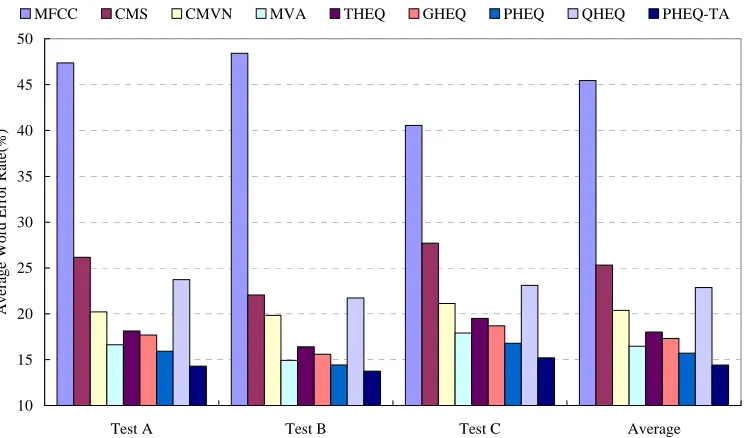
Finally, we compare the above HEQ approaches with the conventional normalization approaches. The average WER results for the MFCC-based baseline system, as well as for CMS and CMVN, for both clean- and multi-condition training, are shown in Table 8 and presented graphically in Figures 3 and 4, respectively. Notice that the results for THEQ, PHEQ and PHEQ-TA were obtained with the best settings from the above experiments. GHEQ is the recognition results obtained using a Gaussian probability distribution with zero mean and unity variance as the reference distribution rather than using the probability distributions of the entire training data as the reference distributions [Torre et al. 2005]. In other words, each feature space dimension is normalized to a standard normal distribution. It can be found that all the HEQ approaches provide significant performance boosts over the MFCC-based baseline system, and they are also better than CMS and CMVN for both clean- and multi-condition training. If TA is further applied after CMVN (i.e., MVA) or PHEQ (i.e., PHEQ-TA), the recognition results of MVA or PHEQ-TA will be considerably better than those obtained by using CMVN or PHEQ alone.
The experimental results shown in this and the previous sections suggest the following observations:
z The estimation of CDF can have a significant influence on the performance of HEQ. The cumulative-histogram method can give a reliable estimation if there is a large amount of speech feature vectors available; otherwise, the order-statistics based method is recommended.
Table 7. Average WER results (%) obtained by combining PHEQ with different TA operations of different span orders.
Span Order
0 1 2 3 4 5
Non-Causal MA 15.71 14.57 14.53 15.78 16.61 16.87
Causal MA 15.71 15.20 14.88 14.66 14.61 15.06
Non-Causal ARMA 15.71 14.55 14.41 14.94 15.11 15.21
Clean- Condition Training
Causal ARMA 15.71 14.52 14.49 14.86 15.00 16.72
Non-Causal MA 9.5 8.96 8.98 9.66 10.18 10.75
Causal MA 9.5 9.35 9.22 8.98 8.95 9.08
Non-Causal ARMA 9.5 8.92 8.86 9.04 9.13 9.18
Multi- Condition Training
A Comparative Study of Histogram Equalization (HEQ) for 233 Robust Speech Recognition
z The full cumulative distribution function matching approach, such as THEQ, GHEQ, or PHEQ, gives better recognition performance than the quantile-corrective approach, such as QHEQ.
z In contrast, assuming that the probability distributions of speech feature vectors will follow Gaussian distributions (e.g., GHEQ), the transformation functions used in PHEQ are directly learned from the observed distributions of speech feature vectors. As the results show in Table 8, PHEQ outperforms all the other equalization approaches in most cases for clean-condition training.
z The performance of GHEQ appears slightly better than PHEQ for multi-condition training. This result is probably explained by the fact that multi-condition training can substantially reduce environmental mismatch. Consequently, normalizing the speech feature vectors into a standard normal distribution or normalizing a distribution learned from the training speech seems to make no significant difference in multi-condition training.
z Performing TA after HEQ is necessary, because TA can alleviate the influence of sharp peaks and valleys that were caused by some non-stationary noises or occurred during the equalization process.
Table 8. Comparison of the average WER results (%) obtained by the MFCC-based baseline system and various normalization approaches for clean- and multi-condition training.
Clean-Condition Training Multi-Condition Training
Test A Test B Test C Average Test A Test B Test C Average MFCC 47.37 48.42 40.55 45.45 13.56 13.34 17.06 14.65
CMS 26.17 22.06 27.72 25.32 13.27 12.99 13.77 13.34 CMVN 20.21 19.84 21.13 20.39 12.18 11.23 13.21 12.21 MVA 16.63 14.92 17.90 16.48 8.86 8.82 9.69 9.12 THEQ 18.13 16.41 19.51 18.02 11.97 11.47 13.44 12.30 GHEQ 17.69 15.59 18.70 17.32 9.00 8.73 9.60 9.11 PHEQ 15.91 14.43 16.80 15.71 9.23 8.89 10.38 9.50 QHEQ 23.74 21.73 23.11 22.86 8.91 10.03 11.75 10.23
236 Shih-Hsiang Lin et al.
in the test phase, its computational complexity is the highest when compared to the other two HEQ approaches (THEQ and PHEQ), which is due to the fact that an exhaustive online grid search is required for finding the optimum transformation parameters α and γ. The search process is completely dominated by the value ranges of α and γ , and the resolutions, i.e., the step sizes for updating the values, of α and γ. In contrast to the above two approaches, the computational complexity of PHEQ is almost negligible. It requires only a few mathematical operations, which will result in a tremendous saving in the computational cost. A summary of storage requirement and computational complexity is shown in Table 9.
5.
CONCLUSIONS
In this paper, we have given a detailed review of various histogram equalization (HEQ) approaches for improving ASR robustness. Three approaches, namely, the table-based histogram equalization (THEQ), the quantile-based histogram equalization (QHEQ) and the polynomial-fit histogram equalization (PHEQ), were extensively compared and analyzed, in terms of the recognition performance, storage requirement and computational complexity. Moreover, the usage of temporal average (TA) operations also has been investigated for alleviating the influence of sharp peaks and valleys caused by some non-stationary noises or noises occurring during equalization. It has been found that PHEQ outperforms the other equalization approaches and it only requires a small amount of storage consumption and computational cost. The best results were obtained by combing PHEQ with TA that was in the form of non-causal auto-regression moving average. Relative word error rate reductions of 68% and 40% over the MFCC-based baseline system have been obtained for clean- and multi-condition training, respectively.
Acknowledgements
This work was supported in part by the National Science Council, Taiwan, under Grants: NSC 96-2628-E-003-015-MY3 and NSC95-2221-E-003-014-MY3.
REFERENCES
Acharya T. and A. K. Ray,“Image Processing: Principles and Applications, " Wiley-Interscience, 2005.
Buera, L., E. Lleida, A. Miguel, A. Ortega and O. Saz,“Cepstral Vector Normalization Based on Stereo Data for Robust Speech Recognition,"IEEE Transaction on Audio, Speech and Language Processing, 15(3), 2007, pp. 1098-1113.
A Comparative Study of Histogram Equalization (HEQ) for 237 Robust Speech Recognition
Dharanipragada, S. and M. Padmanabhan,“A Nonlinear Unsupervised Adaptation Technique for Speech Recognition,"In Proceedings of the 6th International Conference on Spoken Language Processing(ICSLP 2000), Beijing, China, 2000.
Ephraim, Y. and D. Malah,“Speech Enhancement Using a Minimum Mean-Square Log-Spectral Amplitude Estimator,"IEEE Transaction on Acoustic, Speech and Signal Processing, 33(2), 1985, pp. 443-445.
Furui, S.,“Cepstral Analysis Techniques for Automatic Speaker Verification,"IEEE Transaction on Acoustic, Speech and Signal Processing, 29(2), 1981, pp. 254-272. Gales, M. J. F.,“Maximum Likelihood Linear Transformations for HMM-based Speech
Recognition,"Computer Speech and Language, 12(2), 1998, pp. 75-98.
Gauvain, J.-L. and C.-H. Lee,“Maximum a Posteriori Estimation for Multivariate Gaussian Mixture Observations of Markov Chains,"IEEE Transaction on Speech and Audio Processing, 2(2), 1994, pp. 291-297.
Gong, Y.,“Speech Recognition in Noisy Environments: A Survey,"Speech Communication, 16(3), 1995, pp. 261-291.
Hermansky, H and N. Morgan,“RASTA Processing of Speech, " IEEE Transaction on Speech and Audio Processing, 2(4), 1994, pp. 578-589.
Hilger, F. and H. Ney,“Quantile Based Histogram Equalization for Noise Robust Speech Recognition, " In Proceedings of the 7th European Conference on Speech Communication and Technology (Eurospeech 2001), Aalborg, Denmark, 2001.
Hilger, F. and H. Ney,“Quantile Based Histogram Equalization for Noise Robust Large Vocabulary Speech Recognition,"IEEE Transactions on Audio, Speech and Language Processing, 14(3), 2006, pp. 845-854.
Hirsch, H. G. and D. Pearce,“The AURORA Experimental Framework for the Performance Evaluations of Speech Recognition Systems under Noisy Conditions,"In Proceedings of the 6th International Conference on Spoken Language Processing(ICSLP 2002), Beijing, China, 2002.
Hsu, C.-W. and L.-S. Lee,“Higher Order Cepstral Moment Normalization (HOCMN) for Robust Speech Recognition,"In Proceedings of the IEEE International Conference on Acoustic, Speech and Signal Processing (ICASSP 2004), Quebec, Canada, 2004.
Hsu, C.-W. and L.-S. Lee,“Extension and Further Analysis of Higher Order Cepstral Moment Normalization (HOCMN) for Robust Features in Speech Recognition,"In Proceedings of the 9th International Conference on Spoken Language Processing (ICSLP 2006), Pittsburgh, Pennsylvania, 2006.
Huang X., A. Acero, H. Hon,“Spoken Language Processing: A Guide to Theory, Algorithm and System Development,"Prentice Hall, 2001
238 Shih-Hsiang Lin et al.
Junqua, J. C., J. P. Haton and H. Wakita,“Robustness in Automatic Speech Recognition," Kluwer, 1996.
Lee, L.-S. and B. Chen,“Spoken Document Understanding and Organization,"IEEE Signal Processing Magazine, 22(5), 2005, pp. 42-60.
Leggeter, C. J. and P. C. Woodland,“Maximum Likelihood Linear Regression for Speaker Adaptation of Continuous Density Hidden Markov Models,"Computer Speech and Language, 9, 1995, pp. 171-185.
Lial M., R. N. Greenwell and N. P. Ritchey,“Calculus with Applications," Addison Wesley, 2005.
Lin, S.-H., Y.-M. Yeh and B. Chen,“Exploiting Polynomial-Fit Histogram Equalization and Temporal Average for Robust Speech Recognition,"In Proceedings of the 9th International Conference on Spoken Language Processing (ICSLP 2006), Pittsburgh, Pennsylvania, 2006.
Molau, S., D. Keysers and H. Ney,“Matching Training and Test Data Distributions for Robust Speech Recognition,"Speech Communication, 41(4), 2003, pp. 579-601.
Molau, S., “Normalization in the Acoustic Feature Space for Improved Speech Recognition,"Ph.D. Dissertation, Computer Science Department, RWTH Aachen University, Aachen, Germany, 2003.
Molau, S., F. Hilger and H. Ney,“Feature Space Normalization in Adverse Acoustic Conditions,"In Proceedings of IEEE International Conference on Acoustics, Speech, and Signal Processing (ICASSP 2003), Hong Kong, 2003.
Moreno, P.,“Speech Recognition in Noisy Environment,"Ph.D. Dissertation, ECE Department, Carnegie Mellon University, Pittsburgh, PA, 1996.
Segura, J. C., C. Benitez, A. Torre, A. J. Rubio and J. Ramirez,“Cepstral Domain Segmental Nonlinear Feature Transformations for Robust Speech Recognition,"IEEE Signal Processing Letters, 11(5), 2004, pp. 517-520.
Suk, Y. H., S. H. Choi and H. S. Lee,“Cepstrum Third-Order Normalisation Method for Noisy Speech Recognition,"Electronics Letters, 35(7), 1999, pp. 527-528.
Torre, A., A. M. Peinado, J. C. Segura, J. L. Perez-Cordoba, M. C. Bentez and A. J. Rubio, “Histogram Equalization of Speech Representation for Robust Speech Recognition," IEEE Transactions on Speech and Audio Processing, 13(3), 2005, pp. 355-366.
Vikki, A. and K. Laurila,“Segmental Feature Vector Normalization for Noise Robust Speech Recognition,"Speech Communication, 25, 1998, pp. 133-147.
Wu, J. and Q. Huo,“An Environment-Compensated Minimum Classification Error Training Approach Based on Stochastic Vector Mapping,"IEEE Transactions on Audio, Speech and Language Processing, 14(6), 2006, pp. 2147-2155.