University of South Carolina
Scholar Commons
Theses and Dissertations
5-8-2015
Metals on Titania/HOPG as Models for
Heterogeneous Catalysts
Randima Piyumalie Galhenage
University of South Carolina - Columbia
Follow this and additional works at:https://scholarcommons.sc.edu/etd
Part of theChemistry Commons
This Open Access Dissertation is brought to you by Scholar Commons. It has been accepted for inclusion in Theses and Dissertations by an authorized administrator of Scholar Commons. For more information, please [email protected].
Recommended Citation
Galhenage, R. P.(2015).Metals on Titania/HOPG as Models for Heterogeneous Catalysts.(Doctoral dissertation). Retrieved from
METALS ON TITANIA/HOPG AS MODELS FOR HETEROGENEOUS CATALYSTS
by
Randima Piyumalie Galhenage
Bachelor of Science
Institute of Chemistry, Sri Lanka, 2008
Bachelor of Science
University of Colombo, Sri Lanka, 2009
Submitted in Partial Fulfillment of the Requirements
For the Degree of Doctor of Philosophy in
Chemistry
College of Arts and Sciences
University of South Carolina
2015
Accepted by:
Donna A. Chen, Major Professor
Michael L. Myrick , Chairman, Examining Committee
Ken D. Shimizu, Committee Member
John W. Weidner, Committee Member
ii
iii
Dedication
This work is dedicated to my mother and father, Indrani Jinananda and Galhenage
iv
Acknowledgements
I would like to express my gratitude to the people who were a great help to me
throughout my Ph.D. First and foremost I would like to thank my research advisor, Prof.
Donna Chen, for being such a wonderful mentor to me. All that time you spent to give me
advice, to make everything a little bit better, for the effort you put to bring the best out of
me are all really appreciated. I could not have asked for more and do not have enough
words to express my gratitude, but I will promise to do my best at my next stop to protect
the confidence you had in me. Then I would like to thank my committee members, Prof
Michael Myrick, Prof. Ken Shimizu and Prof. John Weidner for all their advice for my
graduate work.
Next, I would like to thank all the members of Chen group, past and present, Dr.
Samuel Tenney, Dr. Hui Yan, Audrey Duke, Kangmin Xie, Mara Levine, Brett Cagg,
Grant Seuser, Nhat Nagyun, Thathsara Maddumapatabandi, Amy Brandt and Tyler
Hernandez. I am truly blessed to have such a wonderful group of people to work with. Then
I want to acknowledge all the help given by Arthur Illingworth and Allen Frye in Machine
Shop. They do miracles. Matt Roberts, Alex Skripnik and Dave Wynia from Omicron for
all their support given to troubleshoot the problems I had with my UHV chamber. All the
support I received from the wonderful faculty/staff members in the chemistry department
is greatly appreciated. I acknowledge the funding agencies, DOE, NSF and USC for the
v
Then I want to thank all my friends here in US and back in Sri Lanka, for their
constant love and support which helped me to get through difficult times. I thank Sahan for
all his efforts and support given to me. Last but not least I thank my family for being there
for me no matter what. I specially thank my parents for their unconditional love and support
and for encouraging me to do what I am passionate about and keep having faith in me to
vi
Abstract
The work done in this thesis is mainly focused on understanding the nanoscale
morphology and activity of model heterogeneous catalysts. In order to do this we design
and prepare model catalytic surfaces in ultrahigh vacuum (UHV) and study these surfaces
using electron and ion based microscopies and spectroscopies. The nucleation, growth and
chemical activity of mono and bimetallic clusters on TiO2(110) were investigated in order
to understand how activity is influenced by cluster sizes, interactions with the oxide support
and surface compositions of the bimetallic clusters. For example, Au-based and Pt-based
bimetallic clusters such as Co-Au, Co-Pt, and Pt-Re were grown on titania and their activity
for CO adsorption as well as methanol reaction were investigated. The nucleation and
growth of these metals were found to be dependent upon the mobility of each metal on the
titania surface. Furthermore, bimetallic clusters can be grown on the surface by taking
advantage of the relative surface mobilities; when clusters of the less mobile metal are
deposited first, the subsequent deposition of the second, more mobile metal results in
nucleation exclusively at the existing seed clusters. Furthermore, bimetallic Pt-Ru clusters
on highly oriented pyrolytic graphite (HOPG) have been studied as model systems for
understanding direct methanol fuel cell catalysts. For Pt-Ru clusters deposited on powdered
carbon supports, the novel electroless deposition (ED) method produces exclusively
bimetallic clusters in contrast to the existing wet impregnation methods. The ED grown
vii
of Pt on Ru seed clusters. For both ED and vapor deposition, exclusively bimetallic clusters
were produced since the deposition of Pt did not result in the formation of new clusters. In
addition to bimetallic clusters, we have also successfully synthesized MoS2 clusters on
titania to understand the structural changes that occurs in the presence of different reactant
molecules since the activity of MoS2 towards hydrodesulphurization type reactions is very
sensitive to the structure of the clusters. What we have discovered was that these structures
viii
Table of contents
Dedication ... iii
Acknowledgements ... iv
Abstract ... vi
List of figures ... xi
List of tables ... xviii
Chapter 1. Introduction ... 1
1.1 Introduction to catalysis ... 2
1.2 Motivations and objectives... 3
1.3 References ... 9
Chapter 2. Experimental section ... 15
2.1 UHV chamber ... 16
2.2 Scanning Tunneling Microscopy (STM)... 18
2.3 X-ray Photoelectron Spectroscopy (XPS) ... 20
2.4 Low Energy Ion Scattering (LEIS) ... 22
2.5 Temperature Programmed Desorption (TPD) ... 23
2.6 Model system ... 24
2.7. References ... 28
Chapter 3. Understanding the nucleation and growth of metals on TiO2: Co compared to Au, Ni and Pt... 29
3.1 Introduction ... 30
3.2 Experimental methods ... 32
3.3 Results ... 34
3.4 Discussion ... 50
3.5 Conclusions ... 53
ix
Chapter 4. Nucleation, growth and adsorbate-induced changes in composition for Co-Au
bimetallic clusters on TiO2... 70
4.1 Introduction ... 71
4.2 Experimental ... 74
4.3 Results ... 78
4.4 Discussion ... 98
4.5 Conclusions ... 104
4.7 References ... 105
Chapter 5. Understanding the growth and chemical activity of Co-Pt bimetallic Clusters on TiO2(110): CO adsorption and methanol reaction ... 116
5.1 Introduction ... 117
5.2 Experimental ... 119
5.3 Results ... 122
5.4 Discussion ... 142
5.5 Conclusions ... 149
5.6 References: ... 150
Chapter 6. Characterization of Pt-Re bimetallic clusters on TiO2(110) ... 161
6.1 Introduction ... 162
6.2 Experimental section ... 164
6.3 Results ... 167
6.4 Discussion ... 181
6.5 Conclusions ... 186
6.6 References ... 186
Chapter 7. Platinum-Ruthenium bimetallic clusters on graphite: A comparison of vapor deposition and electroless deposition methods ... 194
7.1 Introduction ... 195
7.2 Experimental ... 197
7.3 Results ... 200
7.4 Discussion ... 214
7.5 Conclusions ... 218
7.6 References ... 219
Chapter 8. Adsorbate-induced changes in MoS2 clusters on TiO2(110) ... 226
x
8.2 Experimental section ... 228
8.3 Results ... 231
8.4 Discussion ... 241
8.5 Conclusions ... 243
8.6 References ... 244
Appendix A. Supplemental figures for chapter 4 ... 249
Appendix B. Supplemental figures for chapter 7... 252
Appendix C. Permission to reprint: chapter 3 ... 253
Appendix D. Permission to reprint: chapter 4 ... 255
xi
List of figures
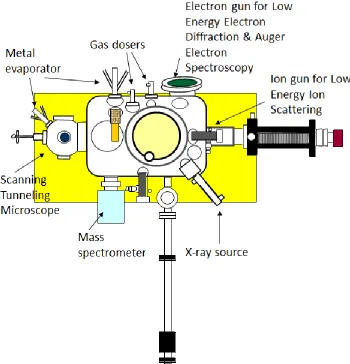
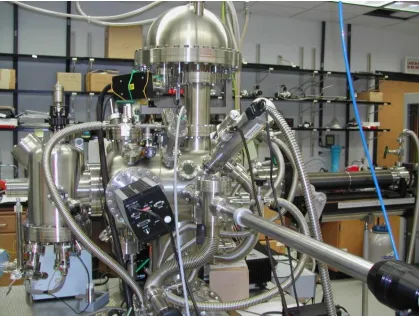
Figure 2.1.a) A Schematic of the Ultra High Vacuum Chamber b) Ultra High Vacuum
Chamber ………....16
Figure 2.2 Concept of Scanning Tunneling Microscope ………..18
Figure 2.3. Concept of X-ray Photoelectron Spectroscopy ………..…21
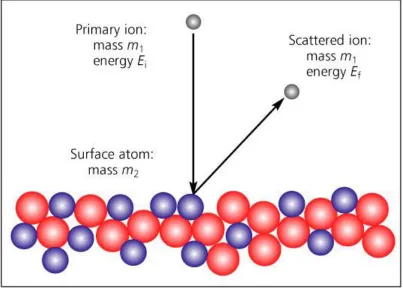
Figure 2.4. Scattering process of low energy ion scattering spectroscopy ……...23
Figure 2.5. Temperature Programmed Desorption set up……….24
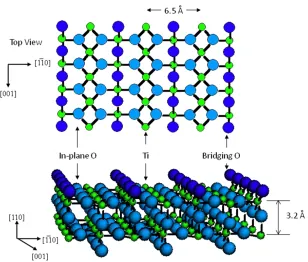
Figure 2.6. a) Stick and ball model of the TiO2(110) b) STM image of TiO2(110). Size of the image is 300 Å x 300 Å………26
Figure 3.1: STM images of the following coverages of Co deposited on TiO2(110) at room temperature: a) 0.02 ML; b) 0.06 ML; c) 0.13 ML; d) 0.19 ML and e) 0.25 ML. All images are 1000 Åx1000 Å………35
Figure 3.2: Cluster densities (a) and average cluster heights (b) as a function of increasing Co coverage on TiO2(110). The error bars for the cluster densities are the standard deviations from counting the clusters in three 1000Åx1000Å images from the same experiment except for the 0.19 ML clusters, where only two images were counted…….36
Figure 3.3: Cluster height distributions for various coverages of Co deposited on TiO2 at room temperature. Heights were determined from STM images using an in-house cluster measurement program, and the following image sizes were used for the analysis: 1000Åx1000Å for 0.02 ML, 500Åx1000Å for 0.13 and 0.25 ML………37
Figure 3.4: STM images of 0.25 ML of the following metals deposited at room temperature on TiO2(110): a) Au; b) Ni; c) Pt; and d) Co. All images are 1000 Åx1000Å………38
Figure 3.5: Calculated binding energies of metal atoms on vacuum-annealed (reduced) TiO2 and oxidized TiO2 (O-TiO2) surfaces………41
xii
Figure 3.7: Correlation between the ΔEb values of metal atoms on TiO2 with their electronegativities………..45
Figure 3.8: Soft X-ray photoelectron spectroscopy data for the Ti(2p3/2) region for: a) clean TiO2(110); and 2 ML of Co deposited on TiO2(110) after room temperature deposition (b) and after heating to 800 K for 1 min (c). The incident photon energy was 600 eV……..47
Figure 3.9: XPS data for the Co(2p) region for 0.25 ML of Co deposited on TiO2(110) at room temperature: a) as deposited; b) exposed to O2 at room temperature; c) exposed to air for 24 hours; d) annealed to 800 K for one minute; and e) annealed to 800 K for one minute and exposed to O2 at room temperature. The O2 was dosed in UHV at a pressure rise of 1x10⁻⁷ Torr for 5 minutes via a directed dosing tube……….48
Figure 4.1: STM images of the following metal coverages deposited at room temperature on TiO2(110): a) 0.02 ML of Co; b) 0.02 ML of Co + 0.1 ML of Au; and c) 0.1 ML of Au; d) 0.1 ML Au + 0.02 ML of Co; e) 0.05 ML of Co; and f) 0.05 ML of Co + 0.1 ML of Au. All images are 1000 Å x1000 Å………79
Figure 4.2: STM images of the following metal coverages deposited at room temperature on TiO2(110): a) 0.25 ML of Au; b) 0.06 ML of Co + 0.19 ML of Au; c) 0.13 ML of Co + 0.13 ML of Au; d) 0.19 ML Co + 0.06 ML of Au; and e) 0.25 ML of Co. All images are 1000Å x1000Å………...81
Figure 4.3: Average cluster heights (a) and cluster densities (b) as a function of bulk Co fraction at room temperature and after annealing at 500 K and 800 K for one minute at each temperature. All surfaces have a total metal coverage of 0.25 ML. The error bars shown for the room temperature heights are the standard deviations from the cluster height distributions. Standard deviations for the heights of clusters annealed to 500 K and 800 K are not shown for the sake of clarity but are given in Table S1 of the supporting information……….82
Figure 4.4: STM images of the following metal coverages deposited at room temperature on TiO2(110) and annealed to 800 K for one minute: a) 0.25 ML of Au; b) 0.06 ML of Co + 0.19 ML of Au; c) 0.13 ML of Co + 0.13 ML of Au; d) 0.19 ML Co + 0.06 ML of Au; and e) 0.25 ML of Co. All images are 1000 Å x1000 Å………..83
Figure 4.5: The surface % Au from LEIS experiments vs. bulk % Au deposited on the surface for Co-Au clusters of varying compositions. The total coverage of all surfaces was 0.25 ML, and Au was deposited on existing Co seed clusters in order to form bimetallic clusters. The error bars shown are the standard deviations from: 2 experiments at 75% Au, 3 experiments at 25% Au and 4 experiments at 50% Au. In the case of 75% Au, the error bar is smaller than the plot symbol……….85
xiii
Figure 4.7: LEIS signals as a function of annealing for 1 minute at various temperatures for pure Co, pure Au and Co-Au clusters on TiO2: a) normalized Co signal; and b) normalized Au signal. Signals are normalized to the initial values at 295 K. Au was deposited on Co clusters at room temperature for various compositions at a total metal coverage of 0.25 ML. The error bars shown are the standard deviations from: 2 experiments at 75% Au and 100% Co, 3 experiments at 25% Au and 4 experiments at 50% Au. For each composition, the maximum standard deviation in the temperature set was used………...……….89
Figure 4.8: TPD experiments for CO adsorbed at room temperature on TiO2 itself and on clusters ranging from 0-100% Co with a total metal coverage of 0.25 ML. In all cases, the Co was deposited on the surface first, and the heating rate during the TPD experiment was 2 K/s………..………92
Figure 4.9: Normalized CO desorption yields from TPD experiments and surface % metal from LEIS experiments as a function of bulk % metal deposited on the surface for: a) Co-Au; b) Ni-Au and c) Pt-Au. The CO desorption is normalized to the value on the pure Pt, Ni or Co clusters. The total coverage of all surfaces was 0.25 ML, and Au was deposited on existing metal seed clusters in order to form bimetallic clusters. The error bars for the CO yields on Co are the standard deviations from: 3 experiments on 0.25 ML Co and the 25% Co clusters; 2 experiments on the 75% Co clusters; and 4 experiments on the 50% Co clusters………...93
Figure 4.10: Model structures of 50% Co/50% Au surfaces where the bottom Au layer is fixed in bulk Au position: a) Au-Co-Co-Au; b) Co-Co-Au-Au; c) Co-Au-Co-Au; d) structure (a) with one Co atom exchanged from the third layer; and e) CO adsorbed on structure (d)………93
Figure 4.11: Phase diagrams for 50% M/50% Au model surfaces in the presence of CO calculated by constrained ab initio thermodynamics, where M=Co (a), Ni (b), and Pt (c). The most stable structure in the absence of CO is shown in the inset. All other structures are displayed in the supporting information………..97
Figure 5.1: Scanning tunneling microscopy images for the following metal coverages deposited on TiO2(110) at room temperature: a) 0.13 ML of Co; b) 0.13 ML of Co+0.13 ML of Pt; c) 0.13 ML of Pt; and d) 0.13 ML Pt+0.13 ML Co. All images are 1000 Å x 1000 Å…...123
Figure 5.2: Scanning tunneling microscopy images for the following clusters deposited on TiO2(110) at room temperature at a total metal coverage of 0.25 ML: a) 100% Pt; b) 30% Co+70% Pt; c) 55% Co+ 45% Pt; d) 80% Co+20% Pt and e) 100 % Co. All images are 1000 Å x1000 Å………...………124
xiv
Figure 5.4: Histograms of cluster heights measured from scanning tunneling microscopy images (Figure 5.3) of the pure and bimetallic clusters deposited at room temperature and annealed to 800 K for one minute. For each surface, all clusters in 1000 Åx1000 Å images were measured………..127
Figure 5.5: Cluster densities for various surfaces at room temperature and after heating to 500 K and 800 K for one minute at each temperature……….128
Figure 5.6: A plot of surface Co composition determined from low energy ion scattering experiments as a function of bulk Co composition, which is the ratio of deposited metals………...130
Figure 5.7: Pt (a) and Co (b) low energy ion scattering signals as a function of annealing temperature for various cluster compositions. For each cluster composition, signals are normalized to the initial value at room temperature………131
Figure 5.8: Temperature programmed desorption data for a saturation exposure of CO at room temperature on various surfaces. The bimetallic surfaces have a total metal coverage of 0.25 ML. Co deposition was followed by Pt deposition except for the dotted trace for 55% Co, in which the order of deposition was reversed……….135
Figure 5.9: Temperature programmed desorption data for a saturation exposure of methanol dosed at 100 K on: a) 0.25 ML Co and b) 0.25 ML Pt clusters. The dotted traces are profiles for the desorption of CO itself after adsorption at room temperature………137
Figure 5.10: Temperature programmed desorption data (28 amu, CO) for a saturation exposure of methanol dosed at 100 K on bimetallic clusters of varying compositions with a total metal coverage of 0.25 ML………138
Figure 5.11: Temperature programmed desorption data for a saturation exposure of methanol dosed at 100 K on bimetallic clusters of varying compositions with a total metal coverage of 0.25 ML: a) 2 amu (H2) and b) 16 amu (CH4)………..140
Figure 6.1. a) STM images of a) 0.25 ML Pt, b) 0.13 ML Pt, c) 0.13 ML Pt + 0.11 ML Re, d) 0.22 ML Re, e) 0.11 ML Re f) 0.11 ML Re + 0.13 ML Pt, deposited at room temperature. All images are 1000 Å x 1000 Å………...…...168
Figure 6.2. Histograms of cluster heights for the STM images in figure 1: a) 0.25 ML Pt, b) 0.13 ML Pt,and c) 0.13 ML Pt + 0.11 ML Re d) 0.22 ML Re, e) 0.12 ML Re, and f) 0.11 ML Re + 0.13 ML Pt. For each surface, all clusters in 500 Å x 500 Å region were measured……….169
xv
Figure 6.4. Histograms for the STM images in figure 3: a) 0.25 ML Pt, b) 0.13 ML Pt+0.11ML Re, c) 0.11 ML Re+0.13 ML Pt and d) 0.22 ML Re. All clusters in a 500 Å x 500 Å region were measured………171
Figure 6.5. Low energy ion scattering spectroscopy studies of different compositions of Pt-Re; a) Pt-Re region at room temperature and b) Pt-Re signal (normalized to the room temperature value) at different temperatures………172
Figure 6.6. STM data for a) 1.7 ML Re, b) 1.7 ML Re + 2ML Pt, c) 2ML Pt, d) 2ML Pt + 1.7 ML Re, all images are 1000 Å x 1000 Å………...174
Figure 6.7. Low energy ion scattering spectroscopy studies of different compositions of Pt-Re. a) Pt-Re signal intensity at room temperature………175
Figure 6.8. a) XPS data for Ti(2p3/2) peak for TiO2 itself and Re and Pt clusters on TiO2 and b) LEIS data for thick layers of Re on titania………176
Figure 6.9. XPS data for different compositions of Pt-Re. a) Re(4f) and b) Pt(4f)…....177
Figure 6.10. TPD data for CO adsorption on different compositions of Pt-Re clusters on
TiO2 ……….178
Figure 6.11. TPD data for CO absorption on different compositions of Pt-Re clusters on titania as a function of a) Pt coverage and b) Re coverage………..179
Figure 7.1. Scanning tunneling microscopy images of: a) a freshly cleaved HOPG surface; b) 0.25 ML Pt on HOPG; c) modified HOPG (m-HOPG) prepared by Ar+ sputtering for 30 s; and d) 0.25 ML Pt on m-HOPG. All images are 4000 Å x 4000 Å………201
Figure 7.2. Scanning tunneling microscopy images of: a) 0.25 ML Pt on m-HOPG (sputtered 30 s); b) 0.50 ML Pt on m-HOPG; c) 0.50 ML Pt on hm-HOPG (sputtered 5 min); and d) 0.50 ML Pt + 0.43 ML Ru on m-HOPG. All images are 1000 Å x 1000 Å………..203
Figure 7.3. Scanning tunneling microscopy images of: 0.22 ML Ru on unmodified HOPG: a) 4000 Åx4000Å and b) 1000 Å x 1000 Å; c) 0.22 ML Ru on modified HOPG (30 s); d) 0.43 ML Ru on m-HOPG; and e) 0.43 ML Ru + 0.50 ML Pt on m-HOPG. Images c-e are 1000 Å x1000 Å………..205
Figure 7.4. Low energy ion scattering data for the following clusters on m-HOPG: a) 0.50 ML Pt+0.43 ML Ru; b) 0.50 ML Pt+0.43 ML Ru heated to 130 °C for 3 min; c) 0.43ML Ru+0.50 ML Pt; and d) 0.43 ML Ru+0.50 ML Pt heated to 130 °C for 3 min………..207
xvi
to the same electroless deposition conditions in (c) without Pt+2. All surfaces were heated to 130 °C for 3 min, and images are 1000 Å x 1000 Å………209
Figure 7.6. X-ray photoelectron spectroscopy data for the Pt(4f) region for 0.43 ML Ru on m-HOPG after the following treatments: a) vapor deposition of 0.50 ML Pt; b) Pt electroless deposition (50 ppm, 70 °C); c) Pt electroless deposition (20 ppm, 70 °C); and d) Pt electroless deposition (60 ppm, 40 °C). All of the surfaces exposed to the ED baths (b-d) were annealed at 130 °C for 3 min……….210
Figure 7.7. X-ray photoelectron spectroscopy data for the Ru(3d)/C(1s) region for 0.43 ML Ru on m-HOPG after the following treatments: a) vapor deposition of 0.50 ML Pt; b) Pt electroless deposition (50 ppm, 70 °C); c) Pt electroless deposition (20 ppm, 70 °C); d) Pt electroless deposition (60 ppm, 40 °C); and e) 0.43 ML Ru exposed to ED bath in (d) without Pt+2. All of the surfaces exposed to the ED baths (b-e) were annealed at 130 °C for 3 min………...211
Figure 7.8. X-ray photoelectron spectroscopy data for the: a) Ru(3d)/C(1s); b) Pt(4f); and c) Ag(3d) regions for 0.50 ML Pt on hm-HOPG after exposure to the Ru ED bath. The surface was annealed at 130 °C for 3 min………213
Figure 8.1. STM images ofa) 0.1 ML Mo on titania deposited at 400 K and subsequently annealed to 950 K for 15 minutes , b) 0.1 ML MoS2: prepared by depositing 0.1 ML Mo on titania at 400 K in 5 x 10⁻⁶ Torr H2S and subsequently annealed to 950 K for 15 minutes in the same H2S environment. All images are 100 nm x 100 nm……….231
Figure 8.2. Histograms for length, width and height of clusters in figure 1b (0.1 ML MoS2) in nm………....232
Figure 8.3. STM images ofa) 0.1 ML MoS2, heated to b) 400 K, c) 600 K and d) 800 K. All images are 100 nm x 100 nm……….234
Figure 8.4. STM images of, A 0.1 ML MoS2 was exposed to different gas molecules at 1 x 10⁻⁷ Torr for 5 min a) D2, b) CO, c) CH3OH, d) H2O, e) O2. All images are 100 nm x 100 nm………235
Figure 8.5. STM: A 0.13 ML coverage of MoS2 surface was exposed to different gas molecules at 10 Torr for 2.5 hours a) CH3OH b) H2O, c) O2. All images are 100 nm x100 nm………..236
Figure 8.6. STM: A 0.1 ML coverage of MoS2 was exposed to a) O2 at 250 Torr for 2.5 hours and b) Air for 2.5 hours. All images are 100 nm x 100 nm………..236
Figure 8.7. Comparison of the Mo(3d) peak of Mo and MoS2 on titania with MoS2 single crystal……….……….237
xvii
Figure 8.9. XPS data for the Mo(3d) region a) Mo clusters and b) MoS2 cluster on TiO2 before and after oxidation of 1 x10⁻⁷ Torr O2 for 5 min at room temperature………….238
Figure 8.10. XPS data for the Mo(3d) region for MoS2 on TiO2 exposed to different gases at a pressure of 10 Torr………239
Figure 8.11. XPS data for the Mo(3d) region for MoS2 on titania exposed to O2 and air for 2.5 hours………..……….240
xviii
List of tables
Table 3.1. Average cluster heights and densities for 0.25 ML of metal deposited on vacuum-annealed TiO2(110) at room temperature. These statistics are based on measurements of all clusters in 1000x1000 Å2 images, which contained a minimum of 300 clusters………...39
Table 3.2. Calculated metal binding energy on the vacuum-annealed (reduced) and the oxidized TiO2 (110) surface. Also reported is the oxygen binding energy to the metal(111) surface for Au, Ni and Pt, and to (0001) for Co………42
Table 3.3. Average cluster heights and densities for 0.05 ML of metal deposited at room temperature on vacuum-annealed (reduced) TiO2(110) and TiO2(110) exposed to O2 at 295 K (oxidized, O-TiO2). These statistics are based on measurements of all clusters in 500x1000 Å2 or 1000x1000 Å2 images, which included 180-940 clusters………45
Table 4.1. Computed relative energies (Erel) of the 50% Co/50% Au structures in the presence and absence of CO, and calculated adsorption energies (Eads) of CO on these structures………94
Table 5.1. Average Cluster Heights for Pt-Co Bimetallic Clusters……….126
Table 5.2. Average Cluster Densities for Pt-Co Bimetallic Clusters………129
Table 6.1: Binding energy data obtained from XPS for different compositions of Pt-Re prepared at room temperature………..………179
Table 7.1. Average cluster heights and cluster densities for metals on HOPG. All of the surfaces exposed to the Pt ED bath were heated to 130 C………..204
Table 8.1. Cluster size analysis of MoS2 at different temperatures……….233
1
2
1.1 Introduction to catalysis
“There is probably no chemical reaction which cannot be influenced
catalytically” - Wilhelm Ostwald
Catalysis is an action of a chemical substance (a catalyst) to increase the rate of a
reaction towards a desired product. Homogeneous and heterogeneous catalysis are the two
primary forms of catalysis. In homogeneous catalysis, the catalyst is in the same physical
state as the reactants, and in heterogeneous catalysis, the catalyst and the reactants are in
different physical states. Initial evidence of catalysis appeared when mankind began to
produce alcohol by fermentation. In 1835, J. J. Berzelius introduced the term “catalysis”
by systematic investigations of recorded observations.1,2 Catalysts were used widely
during World War I and World War II in producing materials like explosives and synthetic
fuels. Since those early times catalysis has had major turning points and success including
Nobel prizes and other significant achievements.2
In chemical industries reactions mainly occur at the surfaces of heterogeneous
catalysts. There is a great deal of ongoing scientific research on heterogeneous catalysts in
order to study the surfaces and thereby to gain a fundamental understanding of the nature
of the reaction occuring at the surface. Understanding the basic aspects of complex
industrial catalysts is rather difficult due to the nature of the complexity. For example, most
industrial catalysts are supported metal clusters. A clear understanding of active sites,
metal-support interfaces, and metal-metal interactions are therefore, harder to decouple to
obtain a better structure-activity relationship. Financial benefits that can be gained by being
able to design catalysts rationally are tremendous. Industrial catalytic materials most often
3
wasted due to the fact that the surfaces are not well-engineered to gain the best surface to
volume ratio. To this date, the fundamental knowledge of catalysts is limited in order to
rationally design catalysts with the knowledge of structure-activity relationship. Studying
models of the complex catalytic systems is one approach to help the rational design of
smarter catalysts.
1.2 Motivations and objectives
The research conducted in our laboratory is mainly focused on understanding bimetallic
clusters on single crystal supports as models for heterogeneous catalysts. Bimetallic
catalysts are known to exhibit enhanced activity compared to their monometallic
counterparts.3-10 Enhanced activity of bimetallic catalysts can be explained by bimetallic
effects, namely bi-functional effects, electronic effects and ensemble effects. Bi-functional
effects are present when the catalyst demonstrates the activity of both metals in the
bimetallic form with no significant modification in activity. Bimetallic clusters that show
different activity and selectivity compared to their monometallic counterparts due to
electronic interactions are termed electronic effects. In some bimetallic systems geometric
differences in the bimetallic forms act as altered active sites that either enhance the activity
or change the selectivity. Most of the catalysts used today for energy generation type of
reactions are bimetallic clusters on oxide supports. They are designed by trial and error
fashion rather than by rational design. Most often therefore materials are wasted without
having been used effectively. Our motivation is to design model systems in extremely
controlled environments to understand the fundamental aspects such as structure-activity
4
We have studied the growth of catalytically relevant metals such as Au, Ni, Co, Pt, Re
and Ru on rutile TiO2(110) and HOPG. The Co-Au bimetallic system is known to exhibit
interesting catalytic properties, such as in Fisher-Tropsch reaction.11,12 The Co-Au system
has been studied as a part of larger study where Pt-Au and Ni-Au were also investigated as
model catalysts for steam reforming type reactions.13-15 An extended study of Au-based
bimetallic systems was done with the motivation of designing model bimetallic catalysts
for conversion of alcohols to H2. In comparison to bulk immiscible bimetallic systems, i.e.
Co-Au, the Co-Pt system, which is a bulk miscible bimetallic system, was studied. Co-Pt
is known to have catalytic activity towards electro-oxidation of methanol in fuel cells.16-19
The conventional Pt catalyst becomes poisoned by CO, which is a byproduct of the
reaction.20-23 Co is known to modify Pt sites so that Pt sites are less susceptible to poisoning
by CO.24,25 Similar effects have been seen in Pt-Re bimetallic systems as well. Pt-Re
bimetallic clusters on titania were also studied as a model catalytic system for the aqueous
reforming of alcohols. Addition of Re to Pt is believed to suppress poisoning by the CO
byproduct, and the presence of Re oxides is also reported to play a role in enhanced activity
for oxidation reactions.26-30 The role of the second metal in these bimetallic systems on
titania is not precisely known. Studying models of these catalytic systems could shed light
on why these enhanced activity is observed in bimetallic catalysts. A Pt-Ru model system
was prepared via electroless deposition (ED) method as a proof of principle study to
investigate the design of models using industrially relevant methods. Carbon supported
Pt-Ru catalysts have shown superior activity as anode catalysts compared to pure Pt for
electro-oxidation of methanol in direct methanol fuel cells.31-34 Similar to the bimetallic
5
the Pt sites by CO.35-38 In addition to bimetallic clusters, we have also successfully
synthesized MoS2 clusters on titania to understand the structural changes that occur in the
presence of different reactant molecules. MoS2 is use to catalyze hydrodesulphurization
reactions.39,40
The nucleation, growth and chemical activity of mono and bimetallic clusters were
investigated to understand how activity is influenced by cluster sizes, interactions with the
oxide support and surface compositions of the bimetallic clusters. The metal-titania bond
strength dictates how metals such as Co, Au, Pt, Ni and Re grow on titania. When the
metal-titania bond strength is weak, the mobility of metals on titania is high. Au-titania has
the lowest bond strength followed by Ni, Pt, Co, and Re. Therefore, Re shows the lowest
mobility on titania, with smaller cluster sizes and higher cluster densities compared to more
mobile metals such as Au, Ni, Pt and Co. Furthermore, we have discovered that the
metal-titania bond strengths follow the same trend as the metal-oxygen bond strengths. Therefore,
if metal-oxygen bond strengths are known, one can predict the growth of metals on titania.
Exclusive formation of bimetallic clusters was achieved for Co-Au, Co-Pt, and Pt-Re on
titania. Bimetallic clusters can be designed by taking advantage of the relative mobilities
of metals, which involves deposition of the low mobile metal first followed by deposition
of the more mobile metal second. For metals such as Pt and Co, where the relative
mobilities are not drastically different, bimetallic clusters can be prepared in either order
of deposition as long as the first deposition provides enough seed clusters to act as
nucleation sites for the second metal. Sintering of clusters at higher temperatures was
6
Unlike titania, HOPG is an inert carbon support therefore, defect sites govern the
nucleation density of metals on HOPG. Defect density was controlled by Ar+ ion
sputtering. Exclusive formation of Pt-Ru bimetallic clusters was achieved by depositing
the first metal on modified HOPG followed by the deposition of the second metal. Both
orders of deposition resulted in bimetallic clusters, provided that the initial deposition
created enough seed clusters. Significant sintering takes place when mono/bimetallic
clusters on HOPG are heated to temperatures as low as 400 K, due to very weak
metal-support interactions. Pt-Ru bimetallic clusters were successfully prepared via ED of Pt on
Ru seed clusters on lightly modified HOPG.
Growth of MoS2 on titania was successfully achieved by previously developed
synthesis method. Sulfiding conditions and the temperature at which the synthesis was
done dictate the size distribution of MoS2 nanostructures. MoS2 did not show sintering
unlike the other metallic systems that we studied on titania.
The surface composition of bimetallic clusters was determined by low energy ion
scattering spectroscopy. For bimetallic clusters such as Co-Au, where metals are bulk
immiscible, the surface composition is governed by the surface free energies. The surface
of Co-Au bimetallic clusters were Au rich, and therefore, a core-shell type structure with
Au at the shell was observed. For bulk miscible metals such as Co and Pt, the surfaces were
composed of a mixture of two metals. In contrast, even though Pt and Re are bulk miscible,
the surfaces of the bimetallic clusters were found to be Pt rich. In this system, Re-TiO2
interactions play a vital role in determining the surface composition. Re shows very strong
metal support interactions; therefore, there it is likely that Re migrate onto the support.
7
surface free energy of Pt. Similar behavior was observed for the Pt-Ru bimetallic clusters
even though Pt and Ru are bulk miscible. Bimetallic Pt-Ru clusters were Pt rich, core-shell
type structures which can be explained by the lower surface free energy of Pt compared to
Ru and Pt has very weak interactions with the support compared to Ru. Determining the
surface composition of Pt-Ru bimetallic clusters are prepared via ED was not achievable
using LEIS studies because the clusters are exposed to solution and air therefore, the first
atomic layer is contaminated.
Encapsulation of metals with titania was observed at higher temperatures for metals
such as Pt and Co but not on Au. Encapsulation, segregation of the support on metals, is
an indication of the presence of strong metal-support interactions. Pt and Co become
encapsulated in both Co-Pt and Co-Au bimetallic clusters. Metals, being in bimetallic form
did not prevent the individual metals from being encapsulated by the support. Re was
encapsulated even at room temperature due to strong metal-support interactions. The titania
became reduced upon the deposition of Re, which was not observed for Au, Pt or Co, which
is further evidence of strong support interactions with Re. Metal-metal interactions, were
not studied in Co-Au, Co-Pt and Pt-Ru systems where the bimetallic clusters were made in
submonolayer coverages. At these coverages, it is difficult to decouple the cluster size
effects and metal-metal interactions using XPS. For higher coverages of Pt-Re bimetallic
clusters, Pt-Re interactions were present when Re was deposited on Pt. When Re was
deposited first, Re-support interactions dominated over Pt-Re interactions.
Active sites of Pt-Co, Co-Au, Pt-Re and MoS2 on titania were studied using TPD.
The presence of probe molecule, such as CO, induced changes in the surface composition
8
Co sites was observed due to adsorbate-induced metal segregation. This phenomenon has
previously been observed in other bulk immiscible bimetallic systems such as Pt-Au and
Ni-Au. Whereas for metals that are miscible in bulk such as Pt and Co, CO desorption was
observed from both Pt and Co sites. Significant changes in the surface composition, after
reaction, were not observed. Furthermore, bimetallic effects were more evident in the
Co-Pt system. The selectivity of the methanol reaction was different for Co-Co-Pt bimetallic
clusters in comparison to that of pure Co and pure Pt. There was also stabilization of the
C-H bond in the methanol reaction that is preferable in a catalyst for methanol oxidation
reactions. Such effects can be anticipated to be seen in a system where the metals ae known
to mix in bulk, which can lead to more electronic interactions as opposed to a system like
Co-Au, where the metals do not mix in the bulk. In the Pt-Re system, even though Pt-Re
is known to mix in the bulk, CO desorption was mostly dominated by Pt sites, which is
consistent with the LEIS data. CO desorption from Pt sites can be structure sensitive, but
in this work, the structure of the Pt was not investigated.
The activity and stability of MoS2 were investigated using TPD and XPS. MoS2
structures were remarkably stable upon adsorption of gases in UHV. MoS2 disintegrates
upon exposure to extreme oxidation conditions. Adsorption of CO confirms the presence
9
1.3 References
(1) Lindstrom, B.; Pettersson, L. J. A Brief History of Catalysis Cattech 2003,
7, 130-138.
(2) Wisniak, J. The HIstory of Catalysis. From Begining to Nobel Prizes
Educ.Quim 2010, 21, 60-69.
(3) Rodriguez, J. A.; Kuhn, M. Chemical and electronic properties of Pt in
bimetallic surfaces: Photoemission and CO-chemisorption studies for Zn/Pt(111). The
Journal of chemical physics 1995, 102, 4279.
(4) Lee, Y.; Rhee, J.; Whang, C.; Lee, Y. Electronic structure of Co-Pt alloys:
X-ray spectroscopy and density-functional calculations. Physical Review B 2003, 68.
(5) Chui, Y. H.; Chan, K.-Y. Structures and Energetics of Platinum–Cobalt
Bimetallic Clusters. Molecular Simulation 2004, 30, 679-690.
(6) Galhenage, R. P.; Ammal, S. C.; Yan, H.; Duke, A. S.; Tenney, S. A.;
Heyden, A.; Chen, D. A. Nucleation, Growth, and Adsorbate-Induced Changes in
Composition for Co–Au Bimetallic Clusters on TiO2. The Journal of Physical Chemistry
C 2012, 116, 24616-24629.
(7) Tenney, S. A.; Shah, S. I.; Yan, H.; Cagg, B. A.; Levine, M. S.; Rahman, T.
S.; Chen, D. A. Methanol Reaction on Pt-Au Clusters on TiO2 (110): Methoxy-induced
Diffusion of Pt. J.Phys.Chem.C 2013, 117, 26998–27006.
(8) Cheng, D.; Wang, W.; Huang, S. Core–shell-structured bimetallic clusters
10
(9) Kiss, J.; Óvári, L.; Bugyi, L.; Berkó, A. Characterization Of Au-Rh And
Au-Mo Bimetallic Nanoclusters On TiO2(110): A Comparative Study.
React.Kinet.Catal.Lett. 2009, 96.
(10) Rodriguez, J. A.; Goodman, W. W. Surface Sclence Studies of the
Electronic and Chemlcai Properties of Bimetallic
Systems. Journal of Physical Chemistry, 95.
(11) Jalama, K.; Coville, N. J.; Xiong, H. F.; Hildebrandt, D.; Glasser, D.;
Taylor, S.; Carley, A.; Anderson, J. A.; Hutchings, G. J. A comparison of Au/Co/Al2O3
and Au/Co/SiO2 catalysts in the Fischer-Tropsch reaction. Appl. Catal. A-Gen. 2011, 395,
1-9.
(12) Jalama, K.; Coville, N. J.; Hildebrandt, D.; Glasser, D.; Jewell, L. L.;
Anderson, J. A.; Taylor, S.; Enache, D.; Hutchings, G. J. Effect of the addition of Au on
Co/TiO2 catalyst for the Fischer-Tropsch reaction. Top. Catal. 2007, 44, 129-136.
(13) Tenney, S. A.; Ratliff, J. S.; He, W.; Roberts, C. C.; Ammal, S. C.; Heyden,
A.; Chen, D. A. Adsorbate-induced Changes in the Surface Composition of Bimetallic
Clusters: Au-Pt on TiO2(110). Journal of Physical Chemistry C 2010, 114, 21652-21663.
(14) Tenney, S. A.; He, W.; Ratliff, J. S.; Mullins, D. R.; Chen, D. A.
Characterization of Pt–Au and Ni–Au Clusters on TiO2(110). Topics in Catalysis 2011,
54, 42-55.
(15) Tenney, S. A.; He, W.; Roberts, C. C.; Ratliff, J. S.; Shah, S. I.; Shafai, G.
11
Surface of Ni–Au Clusters on TiO2(110). The Journal of Physical Chemistry C 2011, 115,
11112-11123.
(16) Antolini, E.; Salgado, J. R. C.; Gonzalez, E. R. The methanol oxidation
reaction on platinum alloys with the first row transition metals - The case of Pt-Co and -Ni
alloy electrocatalysts for DMFCs: A short review. Appl. Catal. B 2006, 63, 137-149.
(17) Stamenkovic, V.; Schmidt, T. J.; Ross, P. N.; Markovic, N. M. Surface
composition effects in electrocatalysis: Kinetics of oxygen reduction on well-defined Pt3Ni
and Pt3Co alloy surfaces. Journal of Physical Chemistry B 2002, 106, 11970-11979.
(18) Stamenkovic, V. R.; Mun, B. S.; Mayrhofer, K. J. J.; Ross, P. N.; Markovic,
N. M. Effect of surface composition on electronic structure, stability, and electrocatalytic
properties of Pt-transition metal alloys: Pt-skin versus Pt-skeleton surfaces. J. Am. Chem.
Soc. 2006, 128, 8813-8819.
(19) Stamenkovic, V. R.; Mun, B. S.; Arenz, M.; Mayrhofer, K. J. J.; Lucas, C.
A.; Wang, G. F.; Ross, P. N.; Markovic, N. M. Trends in electrocatalysis on extended and
nanoscale Pt-bimetallic alloy surfaces. Nat. Mater. 2007, 6, 241-247.
(20) Urban, P. M.; Funke, A.; Muller, J. T.; Himmen, M.; Docter, A. Catalytic
processes in solid polymer electrolyte fuel cell systems. Appl. Catal. A-Gen. 2001, 221,
459-470.
(21) Sun, S. G.; Clavilier, J. ELECTROCHEMICAL STUDY ON THE
POISONING INTERMEDIATE FORMED FROM METHANOL DISSOCIATION AT
LOW INDEX AND STEPPED PLATINUM SURFACES. J. Electroanal. Chem. 1987,
12
(22) Wilhelm, S.; Iwasita, T.; Vielstich, W. COH AND CO AS ADSORBED
INTERMEDIATES DURING METHANOL OXIDATION ON PLATINUM. J.
Electroanal. Chem. 1987, 238, 383-391.
(23) Markovic, N. M.; Gasteiger, H. A.; Ross, P. N.; Jiang, X. D.; Villegas, I.;
Weaver, M. J. ELECTROOXIDATION MECHANISMS OF METHANOL AND
FORMIC-ACID ON PT-RU ALLOY SURFACES. Electrochim. Acta 1995, 40, 91-98.
(24) Xu, Y.; Ruban, A. V.; Mavrikakis, M. Adsorption and Dissociation of O2
on Pt-Co and Pt-Fe
Alloys. JACS 2004, 126, 4717-4725.
(25) Neergat, M.; Shukla, A. K.; Gandhi, K. S. Platinum-based alloys as
oxygen-reduction catalysts for solid-polymer-electrolyte direct methanol fuel cells. J. Appl.
Electrochem. 2001, 31, 373-378.
(26) Querini, C. A.; Fung, S. C. Coke and Product Profiles Formed along the
Catalyst Bed during n-Heptane Reforming
i. Nonsulfided Pt/Al2O3 and Pt-Re/Al2O3. Journal of Catalysis 1993, 141, 389-406.
(27) Biswas, J.; Bickle, G. M.; Gray, P. G.; Do, D. D.; Barbier, J. The Role of
Deposited Poisons and Crystallite Surface Structure in the Activity and Selectivity of
Reforming Catalysts. Catal.Rev.-Sci.Eng 1988, 30, 161-247.
(28) Azzam, K. G.; Babich, I. V.; Seshan, K.; Mojet, B. L.; Lefferts, L. Stable
and Effecient Pt-Re/TiO2 cata;yts for Water Gas Shift: On the Effect of Rhenium.
13
(29) Azzam, K. G.; Babich, I. V.; Sehan, K.; Lefferts, L. Role of Re in
Pt-Re/TiO2 catalyts for water gas shift reaction: A mechanistic and Kinetic Study. Applied
Catalysis B: Environmental 2008, 80, 129-140.
(30) Azzam, K.; Babich, I.; Seshan, K.; Lefferts, L. A bifunctional catalyst for
the single-stage water–gas shift reaction in fuel cell applications. Part 2. Roles of the
support and promoter on catalyst activity and stability. Journal of Catalysis 2007, 251,
163-171.
(31) Arico, A. S.; Srinivasan, S.; Antonucci, V. DMFCs: From Fundamental
Aspects to Technology Development. Fuel Cells 2001, 1, 133-161.
(32) Liu, H. S.; Song, C. J.; Zhang, L.; Zhang, J. J.; Wang, H. J.; Wilkinson, D.
P. A review of anode catalysis in the direct methanol fuel cell. J. Power Sources 2006, 155,
95-110.
(33) Lamy, C.; Leger, J. M.; Srinivasan, S.: Direct Methanol Fuel Cells: From a
Twentieth Centry Electrochemist's Dream to a Twenty-first Century Emerging
Technology. In Modern Aspects of Electrochemistry; Bockris, O. M., Conway, B. E.,
White, R. E., Eds.; Plenum Press: New York, 2000; Vol. 34; pp 53-115.
(34) Roth, C.; Papworth, A. J.; Hussain, I.; Nichols, R. J.; Schiffrin, D. J. A Pt/Ru
nanoparticulate system to study the bifunctional mechanism of electrocatalysis. J.
Electroanal. Chem. 2005, 581, 79-85.
(35) Watanabe, M.; Motoo, S. ELECTROCATALYSIS BY AD-ATOMS .2.
ENHANCEMENT OF OXIDATION OF METHANOL ON PLATINUM BY
14
(36) Liu, P.; Norskov, J. K. Kinetics of the Anode Processes in PEM Fuel Cells
- The Promoting Effect of Ru in PtRu Anodes. Fuel Cells 2001, 1, 192-201.
(37) Waszczuk, P.; Lu, G. Q.; Wieckowski, A.; Lu, C.; Rice, C.; Masel, R. I.
UHV and electrochemical studies of CO and methanol adsorbed at platinum/ruthenium
surfaces, and reference to fuel cell catalysis. Electrochim. Acta 2002, 47, 3637-3652.
(38) Christoffersen, E.; Liu, P.; Ruban, A.; Skriver, H. L.; Norskov, J. K. Anode
materials for low-temperature fuel cells: A density functional theory study. Journal of
Catalysis 2001, 199, 123-131.
(39) Lauritsen, J. V.; Nyberg, M.; Nørskov, J. K.; Clausen, B. S.; Topsøe, H.;
Lægsgaard, E.; Besenbacher, F. Hydrodesulfurization reaction pathways on MoS2
nanoclusters revealed by scanning tunneling microscopy. Journal of Catalysis 2004, 224,
94-106.
(40) Bollinger, M.; Lauritsen, J.; Jacobsen, K.; Nørskov, J.; Helveg, S.;
Besenbacher, F. One-Dimensional Metallic Edge States in MoS2. Physical Review Letters
15
16
2.1 UHV chamber
Preparation and characterization of the model catalytic system are done in an
ultra-high vacuum (UHV) Chamber. The base pressure of this chamber is below 1 x 10⁻¹⁰ Torr.
Figure 2.1 a) shows a schematic of the UHV chamber and b) shows an image of the
chamber.
17
The chamber is equipped with a manipulator arm to hold the sample and move it to different
positions. The sample holder is capable of heating samples via electron beam bombardment
of a back plate where the sample has been mounted. The main chamber is connected to a
load lock chamber that is isolated with a gate valve in order to provide the ability to
introduce a sample without opening the entire chamber. Inside the chamber, there is a
carrousel that can retain six different samples. The chamber is equipped with an ion gun
for sputtering, metal dosers for the physical vapor deposition of metals and gas dosers, to
allow insitu preparation of model surfaces. UHV chamber is also equipped with an ion gun
for Low Energy Ion Scattering spectroscopy (LEIS), an electron gun for low energy
electron diffraction (LEIS) and Auger Electron Spectroscopy (AES), an X-ray source for
18
X-ray Photoelectron Spectroscopy (XPS), a mass spectrometer for Temperature
Programmed Desorption (TPD) and a Scanning Tunneling Microscope (STM) .
2.2 Scanning Tunneling Microscopy (STM)
The concept of STM was first introduced by Binnig and Rohrer, who won the Nobel
Prize in physics in 1986. STM can be used to image with atomic resolution. Figure 2.2
shows the working principle of STM.
The technique is based on the quantum tunneling effects. As shown in the figure 2.2, when
a sharp metallic tip is rastered across a conductive sample, to which a positive or a negative
bias is applied, electrons tunnel across the vacuum gap from the sample to tip or tip to
sample, respectively. The applied voltage determines the direction of the tunneling
electrons. If the sample is negatively biased with respect to the tip (figure 2.2a) electrons
tunnel from the occupied states of the sample to the unoccupied states of the tip; when the
sample is biased positively with respect to the tip ( figure 2.2b) then the electrons tunnel
from the tip to the sample. Even though, STM does not provide direct chemical
19
information; it is a powerful tool for determining the morphology of a surface. Morphology
of the surface is generated by the movement of the tip in z-direction. Resolution down to
the atomic level allow for identification of specific sites on the surface. STM experiments
that have been done in the work described here was done by applying a positive voltage to
the sample. Furthermore, there are two modes in which STM can be operated, constant
current mode and constant height mode. Constant current mode or constant height mode
control the movement along the z-axis. Constant current mode maintains a constant current
between the sample and the tip, to give the morphology of the surface. In constant height
mode, the height is kept constant so that the change in the current develop the morphology
of the surface. In our lab, we use constant current mode. Changing parameters such as a
bias voltage and current helps to tune the quality of the image.
It is of vital importance that a very sharp tip is used in STM experiments. Imaging
with a tip that does not have close to a single atom apex can result in the contribution to
the tunneling current from multiple atoms at the tip, and, therefore, the lateral resolution is
diminished. The tips that were used for these experiments were prepared by
electrochemical etching of a 0.38 mm tungsten wire in 8 M sodium hydroxide solution.
Tips are conditioned for better quality by sputtering with a 8 uA, Ar+ ion beam at 3 kV
and applying high voltages (pulsing) while scanning a cleaned support such as TiO2 inside
the UHV chamber (figure 2.1.b).
Surfaces were imaged by STM, and cluster sizes for the mono/bimetallic clusters
on the model support were analyzed either using the SCALA 4.1 software from Omicron
20
growth and cluster distribution, which are essential factors in determining surface
morphology and activity relationship.
2.3 X-ray Photoelectron Spectroscopy (XPS)
XPS measurements are obtained by irradiating the surface to be analyzed with
x-rays. The irradiated atoms eject core level electrons (photoelectrons) and are collected by
an electrostatic analyzer. Photoelectrons are separated according to their binding energies
that are fingerprints of the elements from which the electrons are ejected, and the number
of electrons is proportional to the concentration of that element. Figure 2.3 shows the basic
concept of XPS. When atoms are irradiated with x-rays, one of three phenomena can take
place. 1) photons can pass without any interactions 2) photons can scattered by atomic
orbitals that lead to an energy loss and 3) photons can interact with atom with total transfer
of energy to an electron leading to the electron emission. Third process is the process that
gives chemical information about the elements in an XPS experiment.
When the photon energy is equal or greater to the threshold energy required to
remove an electron from an atom, energy is transferred to the electron and eject from the
atom. Excess energy gives rise to the kinetic energy (KE) of that ejected electrons. Binding
energy of the ejected electron is calculated by the equation 1.
EB = hʋ -KE --- (1)
EB is the binding energy of the electron to the atom, h is the Plank’s constant, ʋ is the
frequency of the photon and KE is the kinetic energy of the electron. An electrostatic
21
information binding energies can be calculated. Each element has a set of characteristic
binding energies, which serve as atomic "fingerprints".
Furthermore binding energy of an ejected electron provides information about the chemical
environment of a particular element on the surface. For example, Fe2+ and Fe3+ can be
distinguished by differences in their binding energies; Fe(3+) has a higher binding energy
because the effective nuclear charge experienced by the core level electrons is greater in
the +3 valency. Not only the oxidation states, but significant differences in the chemical
environments also can be identified by XPS.
X-rays for the XPS experiment are generated by a dual anode that consists of an Al
anode and a Mg anode. To generate X-rays, thoria-coated iridium filament is heated to emit
electrons, and the emitted electrons are accelerated to the anode which has a voltage of 15
kV. Electron bombardment of the anode surface generates x-rays. This process creates
significant thermal energy, and, therefore, the anode needs to be water cooled. The excited
22
Mg or Al targets emit x-rays with an energy of 1253.6 eV or 1486.6 eV, respectively. The
probe depth of the XPS experiments is about 10 nm into the bulk due to the mean free path
of the ejected electrons.
2.4 Low Energy Ion Scattering (LEIS)
LEIS is a technique in which the first atomic layer of a surface can be probed. In
the LEIS experiment, the surface is exposed to a stream of noble gas ions of low energy
(>600 eV) (He+, Ne+, Ar+), and the back scattered ions are collected by an electrostatic
analyzer to measure the kinetic energy. The kinetic energy of the backscattered ion depends
on the mass of the surface atom with which the ion collides. To a first approximation, the
scattering event can be treated as a classical two-body elastic collision. The mass of the
element on the surface is calculated by conservation of momentum and energy for the
system. Figure 2.4 shows a simple schematic of the scattering process occurring in a LEIS
experiment.
Surface sensitivity of a LEIS experiment arises from the neutralization of ions that
penetrate beyond the first atomic layer. Ions that penetrate deeper into the surface get
neutralized before they escape the surface, therefore, are not detected by the electrostatic
analyzer. The relative sensitivity of LEIS to different elements is different. Therefore, a
sensitivity correction factor must be applied to quantitative analysis of the elemental
composition at the surface. Unlike XPS, which probes around 10 nm into the surface, LEIS
23
2.5 Temperature Programmed Desorption (TPD)
TPD is used to understand the active sites of the model surface. The experiment is
performed by, first preparing the model catalyst surface, exposing the surface to a
gas-phase probe molecule, and heating the surface in front of a quadrupole mass spectrometer.
The desorbing products are detected by the mass spectrometer. From the mass
fragmentation pattern, the products can be identified, and from the integration of the peaks,
the product yield can be estimated. Figure 2.5 shows the TPD setup that is being used in
our lab. The mass spectrometer is shielded with a Au-covered flag that has a ~2mm
diameter, hole in the center of the flag. The sample is placed approximately 3 mm from the
aperture, which helps to eliminate any contribution from molecules that desorb from the
24
rest of the sample holder or manipulator. The sample is biased at -100 V to prevent
electron-induced chemistry on the surface.
2.6 Model system
The model system is prepared in a highly controlled environment, i.e. inside the
UHV chamber. The insitu preparation of metal clusters are done using physical vapor
deposition. Physical vapor deposition is achieved by electron beam heating of a metal rod
or a crucible which filled with the metal. Electron beam heating is achieved by accelerating
electrons from a thoriated tungsten wire to a positively biased metal rod or a crucible.
Characterization of these systems has been done using following characterization methods.
In an industrial catalyst, active metal component which is responsible to catalyze
the reaction is supported on oxides or carbon. Single crystal supports of these oxide
surfaces or carbon supports such as rutile TiO2 (110) and HOPG respectively serve as
model supports due to their simplicity and the order. There are other methods of preparing
these oxide supports such as preparing thin films on conductive supports. The workd done
25
in this thesis, was done using TiO2 (110) single crystal as a model oxide support and Highly
Ordered Pyrolytic Graphite (HOPG) as a model carbon support.
Titania crystal structure has been studied extensively in literature.1-5 Furthermore
titania is a reducible oxide which could effectively participate in a reaction and, therefore,
catalytically relevant. For these reasons rutile TiO2(110) serve as a good model support.
Structure of the titania in stick and ball model is shown in figure 2.6 a) and 2.6 b) shows
an STM image of TiO2 (110) single crystal. The rutile titania crystal structure consists of
octahedral titanium atoms bonded to 6 oxygen atoms with the octahedra alternating their
orientation between the rows. The (110) surface of the crystal (Figure 2.6.b) results in the
cleavage of one of these oxygen-titania bonds yielding two different types of titanium
atoms with 5-fold and 6-fold coordination in addition to two types of oxygen atoms, in
plane and out of plane.1 In figure 2.6.b) an STM image of cleaned titania is shown. We use
Ar+ ion sputtering to remove the contaminants from the support. This sputtering process
make a rough surface therefore, the surface is heated to ~1000 K for 3 minutes to create
large enough flat terraces. Sputtering annealing process drive the lattice oxygen off making
the support an n-type semiconductor. The support after the preparation procedure is
conductive enough for ion and electron based spectroscopies and microscopies. In the STM
image bright rows correspond to Ti atoms and the dark rows correspond to oxygen atoms.
There always is an uncertainty between whether STM probe the geometric structure or the
electronic structure. In this case clearly STM has probed the electronic structure because
otherwise the bright rows are supposed to be oxygen because geometrically oxygen lies a
layer above Ti atoms. This has been the case for STM images on titania, where unoccupied
26
Figure 2.6. b) STM image of TiO2(110)
27
Cleanliness and the order of the support has been determined using surface characterization
techniques such as XPS, STM, LEED and LEIS.
Metal deposition in order to make metal cluster on supports was achieved either by
physical vapor deposition of metals or electroless deposition of metals. Model catalytic
systems are prepared in a very controlled environment such as in Ultra High Vacuum
conditions. Unlike in real catalytic conditions surface can be analyzed with minimum
28
2.7. References
(1) Diebold, U. The Surface Science of Titanium Dioxide Surface Science
Reports 2003, 48, 53-229.
(2) Du, Y.; Deskins, N. A.; Zhang, Z.; Dohnalek, Z.; Dupuisb, M.;
Lyubinetsky, I. Formation of O Adatom Pairs and Charge Transfer Upon O2 Dissociation
on Reduced TiO2(110). PCCP 2010, 12, 6337-6344.
(3) Li, M.; Hebenstreit, W.; Gross, L.; Diebold, U.; Henderson, M. A.;
Jennison, D. R.; Schultz, P. A.; c, M. P. S. Oxygen-Induced Restructuring of the TiO2(110)
Surface: a Comprehensive Study. Surface Science 1999, 437, 173-190.
(4) Zhang, Z.; Lee, J.; John T. Yates, J.; Bechstein, R.; Lira, S.; Hansen, J. Ø.;
Wendt, S.; Besenbacher, F. Unraveling the Diffusion of Bulk Ti Interstitials in Rutile
TiO2(110) by Monitoring Their
Reaction with O Adatoms. J Phys Chem C 2010, 114, 3059-3062.
(5) Wang, Y.; Sun, H.; Tan, S.; Feng, H.; Cheng, Z.; Zhao, J.; Zhao, A.; Wang,
B.; Luo, Y.; Yang, J.; Hou, J. G. Role of point defects on the reactivity of reconstructed
29
Chapter 3. Understanding the nucleation and growth of metals on TiO
2:
Co compared to Au, Ni and Pt
Reprinted with permission from (R. P. Galhenage, H. Yan, S. A. Tenney, N. Park, G.
Henkelman, P. Albrecht, D.R. Mullins, and D.A. Chen, “ Understanding the Nucleation
and Growth of Metals on TiO2 : Co Compared to Au, Ni and Pt” J.Phys.Chem.C, 2013,
30
3.1 Introduction
Understanding the growth of metals on oxide surfaces is of critical importance for
a wide variety of applications, including those involving heterogeneous catalysis,
electronic devices and gas sensors.1-4 In catalysis, the number of active sites depends on
the exposed surface area of the supported metal clusters, and therefore the growth mode of
the metal clusters is crucial for determining the activity of the supported clusters.2,5,6 In
the fabrication of gas sensors and other electronic devices, the ability of metal films to
adhere to the oxide substrate depends on the nature of bonding at the metal-oxide
interface.3,7-9
Co is an important Fischer-Tropsch catalyst for the synthesis of hydrocarbons from
CO and H2 (syngas).10,11 The attractiveness of Co as a catalyst for the Fischer-Tropsch
reaction stems from its high activity,10-12 high selectivity for longer chain hydrocarbons,13
and low activity for the undesired water-gas shift side reaction.11,14 Furthermore, titania is
a preferred support for the Co-based Fischer-Tropsch catalysts,12,15-22 due to its excellent
thermal stability under reaction conditions and good mechanical properties.23 The Co-TiO 2
system has also been used for other industrially relevant catalytic processes, including the
steam reforming of ethanol,24 preferential oxidation of CO in hydrogen25 and oxidative
dehydrogenation of ethane.26 The nature of the Co-titania interface is believed to influence
the chemical activity of the supported Co clusters. For example, the number of active sites
is altered by the extent of sintering or agglomeration of the clusters during heating as well
as the initial wetting ability of the Co on titania. While strong Co-titania interactions favor
higher activity through greater dispersion, the formation of a Co-titanate compound is
31
which occurs during reduction with H2, inhibits the reduction of Co.27 Previous studies of
Co on titania catalysts report strong metal support interaction (SMSI) effects, such as the
decreased adsorption of CO and H2 after heating the system in a reducing
environment.19,20,28,29 Recent investigations of Co on TiO2(110) from our group show that
the Co clusters become partially encapsulated by titania upon heating in vacuum,30 and
other investigations of Co on TiO2(110) observe decreased Co photoemission upon
annealing,29 which is also consistent with encapsulation.
In order to better understand the growth of Co on titania and the nature of the
Co-titania interfacial interactions, we have studied vapor-deposited Co clusters on rutile
TiO2(110) using techniques such as scanning tunneling microscopy (STM) and X-ray
photoelectron spectroscopy (XPS) under ultrahigh vacuum (UHV) conditions. The
deposition of Co on titania at room temperature results in greater cluster densities and
smaller cluster sizes compared to other transition metals grown on TiO2(110). Co remains
predominantly metallic and does not induce significant reduction of the titania support.
Upon heating the surface, the Co clusters undergo sintering to form larger clusters. Density
functional theory (DFT) studies were carried out to calculate the binding energy of a single
metal atom on vacuum-annealed (reduced) TiO2 for Co as well as other transition metals
like Au, Ni and Pt. This binding energy scales with the strength of oxygen metal bonds
formed on close-packed single crystal surfaces of the metals. The relative cluster sizes and
densities for various metals on TiO2 are successfully predicted based on the metal-titania
binding energies: stronger metal-titania binding results in slower diffusion rates and
32
deposited on oxidized TiO2 were lower than on reduced TiO2 for all four metals (Au, Ni,
Pt, Co) due to the formation of strong admetal-oxygen bonds.
3.2 Experimental methods
All experiments were conducted in two ultrahigh vacuum chambers. The first
chamber has a base pressure of <5x10-11 Torr and is equipped with a variable-temperature
scanning tunneling microscope (Omicron, VT-25), hemispherical analyzer (Omicron,
EA125) for X-ray photoelectron and low energy ion scattering experiments, low energy
electron diffraction optics (Omicron SPEC3), and a quadrupole mass spectrometer
(Leybold-Inficon Transpector 2). A more detailed description of the chamber, as well as
sample heating and metal deposition procedures, can be found elsewhere.31-36 The second
chamber has a base pressure of <2x10⁻¹⁰ Torr and was used to conduct soft X-ray
photoelectron spectroscopy (sXPS) experiments on the U12a beamline at the National
Synchrotron Light Source.37-40 The rutile TiO2(110) crystals (Princeton Scientific) were
cleaned by several cycles of Ar ion sputtering at 1 kV for 20 min followed by annealing to
950-1000 K for 1-3 min. Preferential loss of oxygen from the crystals through this
treatment resulted in crystals that were reduced and sufficiently conductive for STM and
XPS experiments. All TiO2(110) surfaces were subjected to this treatment unless otherwise
specified, and these surfaces are referred to as vacuum-annealed or reduced TiO2(110).
Surface cleanliness and order were confirmed by a combination of XPS, STM and LEED.
Temperatures were measured by type K or C thermocouples spotwelded to the backplate
of the crystal and independently calibrated with an infrared pyrometer.31
In the first chamber, metals were deposited via a commercial metal evaporator