STABILITY-INDICATING HIGH-PERFORMANCE THIN-LAYER CHROMATOGRAPHY METHOD
FOR SIMULTANEOUS ESTIMATION OF FORMOTEROL FUMARATE DIHYDRATE AND
FLUTICASONE PROPIONATE IN BULK DRUG AND PHARMACEUTICAL DOSAGE FORM
RAJASHI B PHARATE
1, SUNEELA S DHANESHWAR
2*
1Department of Quality Assurance, Bharati Vidyapeeth University, Poona College of Pharmacy, Pune, Maharashtra, India. 2Department
ofPharmaceutical Chemistry, Amity Institute of Pharmacy, Amity University Uttar Pradesh, Lucknow, Uttar Pradesh, India. Email: [email protected]
Received: 07 January 2019, Revised and Accepted: 25 February 2019 ABSTRACT
Objective: The objective of the present work was to develop validated stability-indicating high-performance thin-layer chromatographic method for simultaneous estimation of formoterol fumarate dihydrate (FFD) and fluticasone propionate (FP) in bulk drug and pharmaceutical dosage form. Methods: Pre-coated silica gel aluminum plates 60 F-254 were used as stationary phase. The mixture of toluene:ethyl acetate:formic acid (98%) (6:4:0.1; v/v/v) was used as a mobile phase. The densitometric quantification was carried out at 233 nm. The method was validated according to the ICH guidelines. The specificity and stability indicating the capability of the method were proven though degradation studies. Both drugs were subjected to acid (0.1N HCl) and base (0.1N NaOH) hydrolysis, oxidation (3% v/v H2O2), photolytic, and neutral degradation conditions.
Results: The selected mobile phase resolved peaks of FFD and FP with Rf values 0.27±0.10 and 0.64±0.10, respectively. Determination coefficients of calibration curves were found to be 0.998 and 0.999 in the range of 1–3.5 µg/spot and 10–60 µg/spot for FFD and FP with an accuracy of 99.09% for FFD and 99.20% for FP. The degradation products of FFD and FP were resolved from the pure drug with significant differences in their retention factor values. Conclusion: The developed method is simple, accurate and can be successfully applied for quantification of FFD and FP in bulk drug and pharmaceutical dosage form, contributing to improve the quality control and assure the therapeutic efficacy.
Keywords: Formoterol fumarate dihydrate, Fluticasone propionate, High-performance thin-layer chromatography, Stability-indicating method, Validation.
INTRODUCTION
Inhalation is currently the preferred route of drug delivery in asthma in accordance with a global initiative for asthma guideline [1], as it allows the release of drug directly to the site where the action is needed, thus minimizing systemic side effect. Inhaled corticosteroid in combination
with a long-acting β2-agonist is the gold standard for the management
of persistent asthma, with maximal local targeting and minimal systemic side effects. Formoterol fumarate dihydrate (FFD) is a
long-acting selective β-2 agonist used as a bronchodilator in the treatment
of asthma. Chemically, FFD is a (E)-but-2-enedioic acid; N-[2-hydroxy-5-[(1S)-1-hydroxy-2-[[(2S)-1-(4-methoxyphenyl) propan-2-yl] amino] ethyl] phenyl]formamide [2,3].
Fluticasone propionate (FP) is chemically 6α,
9-Difluoro-17-[[(fluoromethyl) sulphanyl]
carbonyl]-11β-hydroxy-16α-methyl-3-oxoandrosta-1, 4-dien-17α-ylpropanoate. FP is a tri-fluorinated
glucocorticoid specifically designed to provide enhanced anti-inflammatory effect [2,4]. Both drugs are official in IP, BP, EP, and USP [5-8]. The chemical structures of FFD and FP [8] are shown in Fig. 1a and b, respectively.
Literature survey for FFD and FP revealed that various analytical methods using techniques such as high-performance liquid chromatography [9-20], spectrophotometry [18,21-25], and high-performance thin-layer chromatography (HPTLC) [19,26] were reported for quantitative determination of single or multi-component systems. Gowekar and Wadher reported HPTLC method for simultaneous estimation of FFD and FP, but no degradation profile has
been stated in the literature [27]. To the best of our knowledge, there is no stability indicating HPTLC method reported for the simultaneous estimation of FFD and FP in bulk drug and pharmaceutical dosage form.
Hence, the objective of the present work was to develop and validate the stability indicating HPTLC method for simultaneous estimation of FFD and FP in bulk drug and pharmaceutical dosage form.
METHODS
Chemicals and reagents
Gift samples of FFD and FP were procured from Vamsi Laboratories Pvt. Ltd. Solapur, Maharashtra, India. The pharmaceutical formulation
of capsule Maxiflo-100 Rotacaps containing 6 μg of FFD and 100 μg
of FP manufactured by Cipla Ltd. was procured from the market. All analytical grade chemicals and reagents used for the analysis were purchased from Merck, Mumbai, India.
Instrumentation
Pre-coated silica gel aluminum plates 60F-254 (20 cm×10 cm, 250 μm
thickness, E. Merck, Darmstadt, Germany) supplied by Anchrom, Mumbai were used. The sampling was done by automated TLC sampler Linomat V applicator (Camag, Muttenz, Switzerland) which was controlled by Win-Cats software (V 3.15, Camag, Muttenz, Switzerland). The standard and sample solutions were spotted in the form of bands of width 6 mm
with a Camag 100 μL sample (Hamilton, Bonaduz, Switzerland) syringe.
Linear ascending development was carried out in a twin trough glass chamber (20 cm×10 cm, 10 cm×10 cm Camag, Muttenz, Switzerland). The mobile phase consisted of toluene:ethyl acetate:formic acid (98%) © 2019 The Authors. Published by Innovare Academic Sciences Pvt Ltd. This is an open access article under the CC BY license (http://creativecommons. org/licenses/by/4. 0/) DOI: http://dx.doi.org/10.22159/ajpcr.2019.v12i4.31279
(6:4:0.1; v/v/v). The developing solvent was run up to 80 mm and development was performed at room temperature (25°C±2°C) at a relative humidity of 60%±5%. The development time was 20 min. Plates were scanned at 233 nm with CAMAG TLC scanner 3. Deuterium lamp emitting a continuous UV spectrum between 200 and 400 nm was used as a source of radiation.
HPTLC method and chromatographic conditions
Preparation of standard stock solutions
Accurately weighed 10 mg of FFD was transferred to 10 ml volumetric flask, dissolved and diluted up to the mark with methanol (1 mg/ml).
Accurately weighed 10 mg of FP was transferred to 10 ml volumetric flask, dissolved and diluted up to the mark with chloroform (1 mg/ml).
Preparation of sample solution
Powder from 20 capsules (Maxiflo-100 Rotacaps containing 6 μg of FFD and 100 μg of FP per capsule) were weighed, their average weight
determined (3.038 mg) and crushed to fine powder. The quantity of powder equivalent to 10 mg of FP and 0.6 mg of FFD was transferred into a 10 ml volumetric flask containing 5 ml of methanol and mixed well. The solution was ultrasonicated for 20 min, and then diluted to 10 ml with methanol. The solution was filtered through Whatman filter paper (0.45 µm). The amount of each drug present in the sample was determined by comparing mean peak areas with that of the standard.
Prewashing of plates
Densitometric estimation was carried out on 20 cm×10 cm pre-coated silica gel 60F–254 plates from E. Merck. The plates were pre-washed with methanol, dried and activated for 15 min at 110°C before chromatography.
Selection of the solvent
Methanol and chloroform were selected as solvents for preparing sample solutions.
Selection of stationary phase
Identification and separation of FFD and FP were carried out on 20 cm×10 cm, 10 cm×10 cm, pre-coated silica gel aluminum plates 60
F-254 (250 μm thickness E. Merck, Darmstadt, Germany).
Sample application
The standard and formulation solution of FFD and FP was spotted on pre-coated TLC plates in the form of narrow bands of length 6 mm, at 8 mm from the bottom, and 10 mm distance between two bands. Samples were applied under continuous drying stream of nitrogen gas at constant application rate of150 nl/s.
Selection of wavelength
An evaluation was performed by linear regression of peak areas determined by UV absorption as a function of sample analysis at 233 nm using methanol as a blank solution. The selection of detection wavelength is shown in Fig. 2.
Optimization of the mobile phase
Various solvent systems such as mixtures of (1) n-hexane:ethyl acetate:methanol:acetic acid (2.0:2.5:2.0:0.2; v/v/v/v), (2) n-hexane:ethyl acetate:methanol:formic acid (2.0:2.5:2.0:0.2; v/v/v/v), (3) n-hexane:ethyl acetate:acetic acid (5:10:0.2; v/v/v), and (4) toluene:ethyl acetate:formic acid (7:3:0.1; v/v/v) were tried to separate and resolve spots of FFD and FP from each other and other excipients of formulation. The mixture of n-hexane:ethyl acetate:methanol:acetic acid (2.0:2.5:2.0:0.2; v/v/v/v) and n-hexane:ethyl acetate:methanol:formic acid (2.0:2.5:2.0:0.2; v/v/v/v) provided well-resolved peaks but tailing was observed. Good peak shape was observed with a mixture of toluene:ethyl acetate:formic acid (7:3:0.1; v/v/v), but the FFD did not resolve from FP. Finally, the mixture of toluene:ethyl acetate:formic acid (6:4:0.1; v/v/v) showed well-resolved peaks with better peak shape. FFD and FP were satisfactorily resolved with Rf value 0.27±0.10 and 0.64±0.10, respectively. Pre-saturation of TLC chamber with the mobile phase for 20 min assured better reproducibility in the migration of FFD and FP with better resolution which is shown in Fig. 3.
Method validation
The developed HPTLC method was validated as per the ICH guidelines Q1A (R2), Q1B, Q2 (R1) for linearity, precision, accuracy, limit of detection (LOD), limit of quantification (LOQ), and specificity [28-33].
Linearity
The linearity of the method was evaluated by constructing calibration curves at six concentration levels. Aliquots of standard working solution of FFD (1, 1.5, 2, 2.5, 3, and 3.5 µL) and (10, 20, 30, 40, 50, and 60 µL) of FP were applied on the plate, to obtain concentrations of 1, 1.5, 2,
2.5, 3, and 3.5 μg/spot for FFD and 10, 20, 30, 40, 50, and 60 μg/spot
for FP. The calibration curves were constructed by plotting peak area versusconcentration with the help of Win-CATS software. The plate was developed in a twin trough glass chamber, using 20 min chamber saturation time. The length of the run was 80 mm. The developed plates were air-dried. Scanning was performed in UV mode at 233 nm. The slit dimension was kept at 5×0.45 mm at a scanning speed of 100 nm/s.
Fig. 2: Overlay spectra for selection of detection wavelength (233 nm)
Fig. 1: (a) Chemical structure of formoterol fumarate dihydrate. (b) Chemical structure of fluticasone propionate b
Slope, intercept, and coefficient of determination (r2) of the calibration curves were calculated to ascertain linearity of the method.
Precision
To evaluate intraday precision, three samples at three different concentrations were analyzed on the same day. The interday precision was studied by comparing assays performed on three different days.
The precision of an analytical method expresses the degree of scatter between a series of measurements obtained from multiple samples of the same homogeneous sample under prescribed conditions.
The intraday and interday variation for determination of FFD and FP were carried out at three different concentration levels 1.5, 2, and 2.5 µg/spot for FFD and 20, 30, and 40 µg/spot for FP.
Repeatability
Repeatability of sample application was assessed by spotting 2 μg/ spot for FFD and 30 μg/spot FP of standard drug solution 6 times on
a TLC plate at different times on the same day by sample applicator, followed by the development of plate and recording of the peak areas for six spots.
Accuracy
Accuracy studies were carried out at 80–120% levels, by mixing a known quantity of standard drug (0.5, 0.6, and 0.7 µg for FFD and 8, 10, and 12 µg for FP) with the sample formulation and the contents were analyzed by the proposed method.
Specificity
The specificity of the method was ascertained by analysis of drug standards and samples. The identities of the peaks for FFD and FP were confirmed by comparing the Rf with those of standards. The peak purity of FFD and FP was assessed by comparing their respective spectra at peak start, peak apex, and peak end positions of the spot.
Robustness
The proposed HPTLC method was tested for robustness. The parameters selected for the robustness study were, change in the amount of toluene in mobile phase composition, change in time from spotting to chromatography and time from chromatography to scanning, and change in saturation time. By introducing small changes in these parameters, the effect on the results was examined.
Limit of detection (LOD) and limit of quantitation (LOQ)
LOD and LOQ values represent the sensitivity of the proposed analytical method. To estimate the LOD and LOQ, blank methanol was spotted 6 times. Different concentrations 0.1, 0.3, 0.5, 0.8, and 1 µg/spot for FFD
Fig. 3: Typical densitogram of standard formoterol fumarate dihydrate peak 1 (Rf 0.27) and fluticasone propionate peak
2 (Rf 0.64)
Fig. 4: Calibration curve of formoterol fumarate dihydrate (1–3.5 μg/spot)
Fig. 5: Calibration curve of fluticasone propionate (10–60 μg/spot)
Fig. 7: Residual plot of fluticasone propionate
Fig. 8: Typical densitogram of formoterol fumarate dihydrate and fluticasone propionate in the formulation
The neutral degradation of FFD and FP in combination was induced by refluxing them together with 10 ml of water at 50°C for 2 h. Samples were withdrawn (0.5 ml) at different time intervals for 2 h. 3 µL solution was applied on TLC plate in such a way that final concentration achieved was 1.8 µg/spot for FFD and 30 µg/spot for FP and densitograms were developed.
RESULTS
Optimization of chromatographic conditions
Toluene:ethyl acetate:formic acid (98%) (6:4:0.1 v/v/v/v) mixture provided best resolution with better peak shape. The Rf values were found to be 0.27 and 0.64 for FFD and FP, respectively.
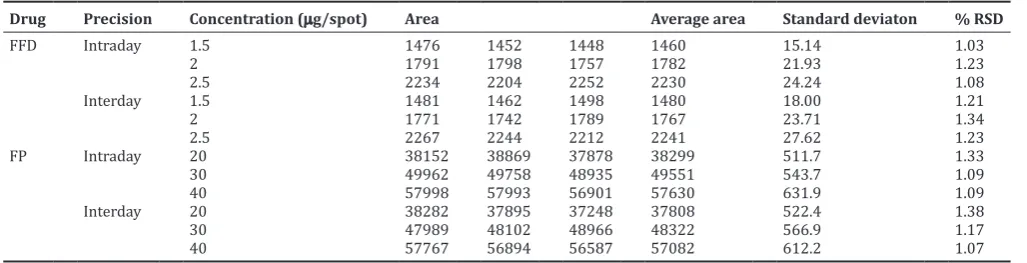
Table 2: Precision studies for FFP and FP
Drug Precision Concentration (µg/spot) Area Average area Standard deviaton % RSD
FFD Intraday 1.5 1476 1452 1448 1460 15.14 1.03
2 1791 1798 1757 1782 21.93 1.23
2.5 2234 2204 2252 2230 24.24 1.08
Interday 1.5 1481 1462 1498 1480 18.00 1.21
2 1771 1742 1789 1767 23.71 1.34
2.5 2267 2244 2212 2241 27.62 1.23
FP Intraday 20 38152 38869 37878 38299 511.7 1.33
30 49962 49758 48935 49551 543.7 1.09
40 57998 57993 56901 57630 631.9 1.09
Interday 20 38282 37895 37248 37808 522.4 1.38
30 47989 48102 48966 48322 566.9 1.17
40 57767 56894 56587 57082 612.2 1.07
FFD: Formoterol fumarate dihydrate, FP: Fluticasone propionate, RSD: Relative standard deviation
Table 1: Linearity and range for FFD and FP
Linearity and range FFD FP
Range (µg/spot) 1–3.5 10–60
Regression coefficient (r2 ) 0.998 0.999
Linearity equation y=677.6x+472.73 y=1013.3x+10059
FFD: Formoterol fumarate dihydrate, FP: Fluticasone propionate
Fig. 9: Densitogram of degradation products of formoterol fumarate dihydrate (FFD) and fluticasone propionate in 0.1N HCL at 50°C after 30 min at Rf value 0.15 (peak 1; FFD 1), 0.47 (peak 3;
FFD 2), and 0.72 (peak 5; FP 1), respectively
Fig. 10: Densitogram of degradation products of formoterol fumarate dihydrate (FFD) and fluticasone propionate (FP) in 0.1N
NaOH at 50°C after 15 min at Rf value 0.42 (peak 2; FFD 3) and 0.78 (peak 4; FP 2)
and 0.1, 0.2, 0.4, 0.6, and 0.8 µg/spot for FP were spotted. The peak was detected at 0.3 µg/spot for FFD and 0.2 µg/spot for FP with a signal-to-noise ratio of 3:1. The peak was detected with the quantifiable area at 1 µg/spot for FFD and 0.6 µg/spot for FP with a signal-to-noise ratio of 10:1.
Forced degradation studies
Acid- and base-induced degradation
To 6 mg of FFD and 100 mg of FP, 10 ml of 0.1 N HCl and 10 ml of 0.1 N NaOH were added separately and refluxed at 50°C for 1 h. Samples were withdrawn (0.5ml) at different time intervals for 1 h.
Further acidic and alkaline degradation were carried out for a combination of FFD and FP by refluxing them together with 10 ml 0.1 N HCl and 10 ml 0.1 N NaOH at 50°C for 1 h. Samples were withdrawn (0.5 ml) at different time intervals for 1 h. 3 µL solution was applied on TLC plate in such a way that final concentration achieved was 1.8 µg/spot for FFD and 30 µg/spot for FP and densitograms were developed.
Oxidative degradation
To 6 mg of FFD and 100 mg of FP, 10 ml of 3% H2O2 was added separately and refluxed at 50°C for 2 h. Samples were withdrawn (0.5 ml) at different time intervals for 2 h.
Further oxidative degradation was carried out for a combination of FFD and FP by refluxing them together with 10 ml of 3% H2O2 at 50°C for 2 h. Samples were withdrawn (0.5 ml) at different time intervals for 2 h. 3 µL solution was applied on TLC plate in such a way that final concentration achieved was 1.8 µg/spot for FFD and 30 µg/spot for FP and densitograms were developed.
Photolytic degradation
Solid forms of FFD and FP were exposed directly to sunlight during the daytime for 2 days to study their photolytic stability. Samples were weighed, dissolved and 3 µL solution was applied on TLC plate in such a way that final concentration achieved was 1.8 µg/spot for FFD and 30 µg/spot for FP and densitograms were developed.
Neutral hydrolysis
Validation of the method
Linearity (calibration curve)
Linearity was demonstrated with six different concentration levels for both FFD and FP, which were found to be linear in the range of
1–3.5 μg/spot for FFD and 10–60 μg/spot for FP. The values are given
in Table 1. Regression coefficient and concentration of the drugs correlated well. The calibration curves are shown in Figs. 4 and 5. The residual plots are shown in Figs. 6 and 7.
Precision
The values of intraday and interday precision are given against sample application and scanning of peak area and results are expressed in terms of percentage relative standard deviation (RSD). The measurement of peak areas at three different concentration levels showed a low value of percentage RSD (<2) for intra- and inter-day variation, which suggested that the method was precise (Table 2).
Repeatability
The percentage RSD for repeatability of the drugs was found to be <2 (i.e., 1.05 for FFD and 1.17 for FP). Hence, it was concluded that the proposed method for estimation of FFD and FP was repeatable in nature; the data for the same are shown in Table 3.
Table 3: Repeatability study for FFD and FP (n=6)
Drug Concentration
(µg/spot) Peak area Average area % RSD Formoterol
fumarate dihydrate
2 1763 1773.33 1.05
2 1748
2 1768
2 1774
2 1802
2 1785
Fluticasone
propionate 3030 4836949435 48707.16 1.17
30 47885
30 48598
30 48687
30 49269
FFD: Formoterol fumarate dihydrate, FP: Fluticasone propionate, RSD: Relative standard deviation
Table 4: Recovery studies for FFD and FP by HPTLC method (n=3)
Label claim
(µg/capsule) % Level of spiked standard drug Formulation Pure drug Total amount (μg)Conc. added Average arean*=3 Amount recovered (µg) % Recovery Mean (%)recovery
FFD 6 µg 80 0.6 0.5 1.1 1212 1.09 99.09 99.13
100 0.6 0.6 1.2 1279 1.189 99.08
120 0.6 0.7 1.3 1348 1.29 99.23
FP 100 µg 80 10 8 18 28136 17.83 99.05 99.22
100 10 10 20 30195 19.87 99.35
120 10 12 22 32196 21.84 99.27
FFD: Formoterol fumarate dihydrate, FP: Fluticasone propionate, RSD: Relative standard deviation, HPTLC: High-performance thin-layer chromatography
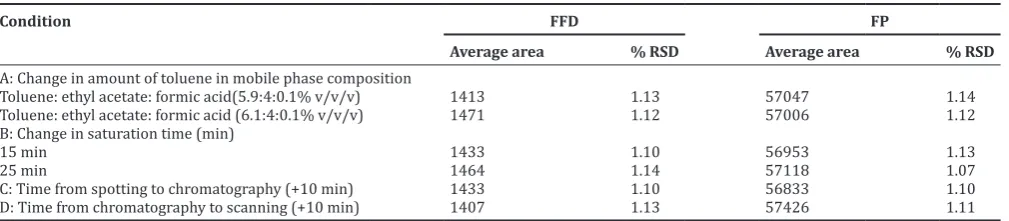
Table 5: Results of robustness evaluation of FFD and FP (n=3)
Condition FFD FP
Average area % RSD Average area % RSD
A: Change in amount of toluene in mobile phase composition
Toluene: ethyl acetate: formic acid(5.9:4:0.1% v/v/v) 1413 1.13 57047 1.14
Toluene: ethyl acetate: formic acid (6.1:4:0.1% v/v/v) 1471 1.12 57006 1.12
B: Change in saturation time (min)
15 min 1433 1.10 56953 1.13
25 min 1464 1.14 57118 1.07
C: Time from spotting to chromatography (+10 min) 1433 1.10 56833 1.10
D: Time from chromatography to scanning (+10 min) 1407 1.13 57426 1.11
FFD: Formoterol fumarate dihydrate, FP: Fluticasone propionate, RSD: Relative standard deviation
Fig. 12: Densitogram of degradation products of formoterol fumarate dihydrate (FFD) and fluticasone propionate (FP) after
exposure of solid drugs direct to sunlight during daytime for 2 days at Rf value 0.48 (peak 2; FFD 4) and 0.85 (peak 4; FP 4) Fig. 11: Densitogram of degradation products of formoterol fumarate dihydrate (FFD) and fluticasone propionate (FP) in 3% H2O2 at 50°C after 1 h at Rf value 0.50 (peak 2; FFD 4) for FFD and
0.72 (peak 4; FP 1), 0.84 (peak 5; FP 3) for FP Accuracy
three different levels 80, 100, and 120%. The percent mean recoveries were found to be 99.13% for FFD and 99.22% for FP (Table 4).
Specificity
The peak purity of FFD and FP was assessed by comparing their respective densitograms at peak start, peak apex, and peak end positions of the spot, i.e., r (start, middle) = (0.25–0.27) and r (middle, end) = (0.27–0.29) for FFD and r (start, middle) = (0.57–0.65) and r (middle, end) = (0.65–0.68) for FP. The chromatogram of capsule sample showed peaks at Rf values of 0.27 and 0.64 for FFD and FP, respectively (Fig. 8), indicating that there is no interference of the excipients present in the capsule formulation indicating the specificity of the method.
Robustness
The percentage RSD of the peak areas was calculated for change in the amount of toluene in mobile phase composition, change in time from spotting to chromatography and time from chromatography to scanning, change in saturation time and change in solvent run distance (Table 5).
Limits of detection and quantitation
The LOD is the smallest concentration of the analyte that gives a measurable response (signal to noise ratio of 3:1). The LOD was found to be 0.3 µg/spot for FFD and 0.2 µg/spot for FP. LOQ is the smallest concentration of the analyte, which gives the response that can be
accurately quantified (signal to noise ratio of 10:1). The LOQ was 1 µg/spot for FFD and 0.6 µg/spot for FP, which indicates that the proposed method was sensitive enough to detect the drugs at very low concentration level (Table 6).
Forced degradation studies
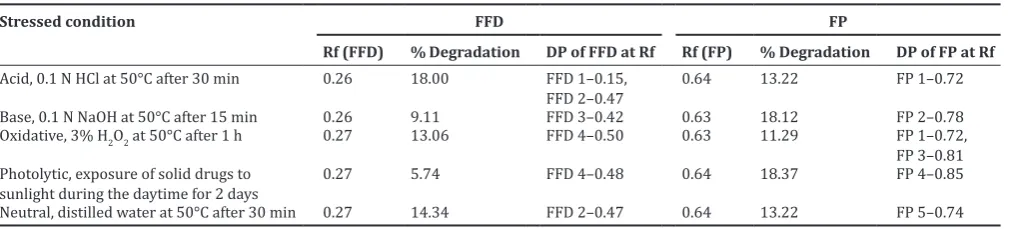
Selectivity of the method was demonstrated by enhancing degradation of FFD and FP under various stressed conditions (acid, base hydrolysis, oxidation, neutral, and photochemical), to show that FFD and FP were separated from their possible degradation products. The number of degradation products with their Rf was calculated and listed in Table 7.
Acid-induced degradation
The densitograms for acid degraded FFD and FP showed additional peaks at Rf 0.15, 0.47 and 0.72, respectively. The rate of degradation for FFD (18.00%) was more as compared to FP (13.22%) in acid-induced degradation (Fig. 9).
Base-induced degradation
The degradation in 10 ml of 0.1 N NaOH at 50°C was so fast that around 18.12% of FP was degraded in 15 min, forming one degradation product at Rf 0.78 and 9.11% of FFD was degraded with one degradation product at Rf value 0.42 (Fig. 10).
Oxidative degradation
The drugs were found to be susceptible to oxidative degradation. The densitogram of hydrogen peroxide-induced degradation showed the additional peaks at Rf value 0.50 for FFD and 0.72 and 0.84 for FP, respectively. The percent of degradation was found to be 13.06% for FFD and 11.29% for FP (Fig. 11).
Photolytic degradation
FP and FFD were found to undergo photolytic degradation after exposure of solid drugs direct to sunlight during the daytime for 2 days. Degradation of FFD was observed (5.74%) with degradation product at Rf value 0.48 and 18.37% degradation was observed for FP with an additional peak at Rf value 0.85 (Fig. 12).
Neutral degradation
The FFD and FP showed two additional peaks when treated in water at 50°C for 30 min. Peaks of degraded products were found at Rf value 0.47 for FFD and 0.74 for FP (Fig. 13).
DISCUSSION
The proposed stability indicating HPTLC method provides precise, accurate, and reproducible quantitative analysis for simultaneous estimation of FFD and FP in bulk drug and pharmaceutical dosage form. The method was validated as per the ICH guidelines. The linearity was
found to be in the range of 1–3.5 μg/spot and 10–60 μg/spot for FFD
and FP, respectively. Percentage RSD of intraday and interday precision was found to be <2% making the method more precise. Degradation study revealed that FFD was most prone to degradation under acid (18%, 30 min) stress followed by the stress conditions such as neutral Fig. 13: Densitogram of degradation products of formoterol
fumarate dihydrate (FFD) and fluticasone propionate (FP) in neutral hydrolysis after 30 min at Rf value 0.47 (peak 2; FFD 2)
and 0.74 (peak 4; FP 5)
Table 6: Results of LOD and LOQ
Drug LOD (µg/spot) LOQ (µg/spot)
FFD 0.3 1
FP 0.2 0.6
FFD: Formoterol fumarate dihydrate, FP: Fluticasone propionate, LOD: Limit of detection, LOQ: Limit of quantification
Table 7: Summary of degradation studies for FFD and FP
Stressed condition FFD FP
Rf (FFD) % Degradation DP of FFD at Rf Rf (FP) % Degradation DP of FP at Rf
Acid, 0.1 N HCl at 50°C after 30 min 0.26 18.00 FFD 1–0.15,
FFD 2–0.47 0.64 13.22 FP 1–0.72
Base, 0.1 N NaOH at 50°C after 15 min 0.26 9.11 FFD 3–0.42 0.63 18.12 FP 2–0.78
Oxidative, 3% H2O2 at 50°C after 1 h 0.27 13.06 FFD 4–0.50 0.63 11.29 FP 1–0.72,
FP 3–0.81 Photolytic, exposure of solid drugs to
sunlight during the daytime for 2 days 0.27 5.74 FFD 4–0.48 0.64 18.37 FP 4–0.85
Neutral, distilled water at 50°C after 30 min 0.27 14.34 FFD 2–0.47 0.64 13.22 FP 5–0.74
(14.3%, 30 min), base (9.11%, 15 min), oxidative (13.06%, 1 h), and photolytic (5.74%, 2 days). FP showed more degradation in basic (18.12, 15 min) and photolytic (18.3%, 24 h) conditions.
CONCLUSION
The developed method was able to separate the drugs from its degradants and impurities. It can be successfully applied as stability indicating method for combination of FFD and FP. Thus, the reported method is of considerable importance and has sound industrial applicability for quality control and stability analysis of FFD and FP from bulk drug and pharmaceutical dosage form.
ACKNOWLEDGMENTS
Authors are thankful to Vamsi Laboratories Pvt. Ltd. Solapur, Maharashtra, India, for providing gift samples of formoterol fumarate dihydrate and fluticasone propionate.
AUTHORS’ CONTRIBUTIONS
Rajashi B. Pharate - Department of Quality Assurance, Bharati Vidyapeeth University, Poona College of Pharmacy, Pune - 411038, Maharashtra, India. Suneela S Dhaneshwar - Amity Institute of Pharmacy, Amity University Uttar Pradesh, Lucknow, Uttar Pradesh, India.
CONFLICTS OF INTEREST
The authors declare that they have no conflicts of interest.
REFERENCES
1. Scichilone N, Rossi A, Melani A. Revising old principles of inhaled treatment in new fixed combinations for asthma. Pulm Pharmacol Ther 2015;33:32-8.
2. Available from: htpp://www.drugbank.com.
3. Available from: htpp://www.en.wikipedia.org/wiki/Formoterol
FumarateDihydrate.
4. Available from: htpp://www.en.wikipedia.org/wiki/Fluticasone
Propionate.
5. The Indian Pharmacopoeia. The Indian Pharmacopoeia Commission.
6th ed., Vol. 2, Ghaziabad: The Indian Pharmacopoeia; 2010. p. 1382-4,
1386-7.
6. British Pharmacopoeia Commission. British Pharmacopoeia. Vol. 2. London: Her Majestry’s Stationary Office; 2013. p. 974-6, 984-6. 7. United States Pharmacopoeia Convention. United States Pharmacopoeia
30. National Formulary 25. Vol. 2. Rockville, USA: United States Pharmacopoeia Convention; 2013. p. 3653-7, 3669-70.
8. Council of Europe. European Pharmacopoeia 7.2. European Directorate for the Quality of Medicine and Healthcare. Vol. 2. Strasbourg: Council of Europe; 2010. p. 2059-2060, 2067-69.
9. Malik K, Kumar D. Simultaneous quantitative determination of formoterol fumarate and fluticasone propionate by validated reversed-phase HPLC method in metered dose inhaler. Pharm Sinica 2011;2: 77-84.
10. Raval PP, Dave JB. Estimation of fluticasone propionate in nasal preparation and in combination with formoterol furamate in inhalation preparation. World J Pharm Pharm Sci 2014;3:1148-60.
11. Assi KH, Tarsin W, Chrystyn H. High performance liquid chromatography assay method for simultaneous quantitation of formoterol and budesonide in symbicort turbuhaler. J Pharm Biomed Anal 2006;41:325-8.
12. Akapo SO, Asif M. Validation of a RP-HPLC method for the assay of formoterol and its related substances in formoterol fumarate dihydrate drug substance. J Pharm Biomed Anal 2003;33:935-45.
13. Shah BD, Yadav YC. Analytical method development and method
validation of tiotropium bromide and formoterol fumarate metered dose inhaler by using RP-HPLC method. Asian J Biochem Pharm Res 2011;1:145-58.
14. Kale NR, Pingle AP. Development and validation of stability indicating RP-HPLC method for simultaneous estimation of formoterol fumarate and budesonide in metered dose inhaler formulation. World J Pharm Res 2014;3:1386-99.
15. Patil AT, Patil SD. Sensitive LC method for simultaneous determination of ciclesonide and formoterol fumarate in dry powder inhaler. J Liq Chromatogr Relat Technol 2011;34:1568-77.
16. Srinivasaro K, Gorule V. Validated method development for estimation of formoterol fumarate and mometasone furoate in metered dose inhalation form by high performance liquid chomatography. J Anal Bioanal Tech 2012;3:1-4.
17. Gujrati PZ, Thula KC. Stability indicating HPLC method for simultaneous estimation of mometasone furoate and formoterol fumarate in combined dosage form. Pharmacophore 2014;5:219-30. 18. Samir A, Salem H. simultaneous determination of salmeterol xinafoate
and fluticasone propioanate in bulk powder and seritide diskus by HPLC. Pharm Anal Acta 2012;3:1-7.
19. Parmar VK, Patel HN. Sensitive and robust methods for simultaneous determination of beclomethasone dipropionate and formoterol fumarate dihydrate in rotacaps. J Chom Sci 2014;52:1255-66.
20. Dave HN, Makwana AG. Validated HPTLC method for the determination of two novel steroids in bulk and pressurized metered dose preparations. Int J Appl Sci Eng 2011;9:177-85.
21. Kondawar MS, Shah RR. UV spectrophotometric method for simultaneous estimation of salmeterol xinafoate and fluticasone propionate in bulk and dosage form. Int J Pharm Tech Res 2011;3:1801-6. 22. Zanwar AS, Sen DB. Spectroscopic method for simultaneous estimation of mometasone furoate and formoterol in rotocaps. Indo Am J Pharm Res 2014;4:5928-33.
23. Prasad AV. Simultaneous spectrophotometric determination of formoterol fumarate and budesonide in their combined dosage form. Indian J Chem Technol 2006;13:81-3.
24. Mohd G, Appala S. Development and validation of spectrometric methods for estimation of formoterol bulk drug and its dosage form. Int J Pharm Pharm Sci 2011;3:306-9.
25. Samir A, Salem H. New developed spectrophotometric method for simultaneous estimation of salmeterol xinafoate and fluticasone propionate in bulk powder and seritide diskus inhalation. Bull Faculty Pharm 2012;50:121-6.
26. Kasaye L, Hymete A, Mohamed AM. HPTLC-densitometric method for simultaneous determination of salmeterol xinafoate and fluticasone propionate in dry powder inhalers. Saudi Pharm J 2010;18:153-9. 27. Gowekar NM, Wadher SJ. Simultaneous estimation of formoterol
fumarate dihydrate and fluticasone propionate in dry powder inhalation formulation by HPTLC. Pharma Chem 2016;8:27-32.
28. International Conference on Harmonization. Q2B. Validation of Analytical Procedure: Methodology. Geneva: International Conference on Harmonization; 1996.
29. ICH Harmonized Tripartite Guideline. Validation of Analytical Procedure: Text and Methodology Q2 (R1). Geneva: International Conference on Harmonization; 2005.
30. International Conference on Harmonisation (ICH) Guidelines. Q1A (R2) for Stability Testing of New Drug Substances and Products. Geneva, Switzerland: International Conference on Harmonization; 2003.
31. International Conference on Harmonization (ICH) Guidelines. Q1B for Stability Testing: Photo-stability Testing of New Drug Substances and Products. Geneva, Switzerland: International Conference on Harmonization; 1996.
32. Shinde CC, Chopade S, Dhaneshwar SS. Development and validation of HPTLC method for estimation of voglibose in pharmaceutical dosage forms. Int J Pharm Pharm Sci 2015;7:288-93.