Well-re
s
olved hypocenter di
s
tribution u
s
ing the double-difference relocation
method in the region of the 2007 Chuet
s
u-oki Earthquake
Yohei Yukutake, Tetsuya Takeda, and Kazushige Obara
National Research Institute for Earth Science and Disaster Prevention, Tennodai, 3-1, Tsukuba, Ibaraki 305-0006, Japan
(Received November 30, 2007; Revised March 18, 2008; Accepted March 24, 2008; Online published November 18, 2008)
The 2007 Chuetsu-oki Earthquake (Mj =6.8) occurred in the easternmargin of the Japan Sea where high
strain rates have been observed andmany large earthquakes have occurred. Themain shock was located near the Western Nagaoka Basin active fault system dipping in the westward direction. We estimated the well-resolved hypocenter location around themain shock rupture zone fromthe differential arrival times obtained by bothmanual picking and waveformcross-correlation analysis. Fromthe relocated aftershock distributions, we successfully resolved the detailed fault structures activated by themain shock. The estimated faultmodel resolves four individual fault segments. The faultmodel suggests that themain shock predominantly ruptured the southeastward dipping fault planes. On the other hand, the aftershocks around the hypocenter of themain shock occurred on both the northwestward and southeastward dipping fault planes. Both fault planes around the hypocenter of themain shockmay have been nearly coincidentally ruptured during themain shock.
Key words:The 2007 Chuetsu-oki earthquake, aftershocks, hypoDD, fault structure.
1.
Introduction
The 2007 Chuetsu-oki Earthquake occurred at 10:13 AM (JST=UT+9 h) on July 16, 2007 with a Japan Meteoro-logical Agency (JMA)magnitude (Mj) of 6.8 (Fig. 1). The
moment tensor solution of themain shock determined by a broadband waveforminversion of the National Research Institute for Earth Science and Disaster Prevention (NIED) F-net was a reverse fault type with theP-axis in the WNW-ESE direction (Matsumotoet al., 2007). The P-axis direc-tion was consistent with the tectonicmaximumcompressive stress direction in and around the Mid Niigata area (Tow-nend and Zoback, 2006). The largest aftershock (Mj=5.8)
occurred near the hypocenter of themain shock 4.5 h af-ter the main shock occurred. The aftershock activity was lower than that recorded for previous intraplate earthquakes such as the 1995 Hyogo-ken Nanbu Earthquake (Mj=7.3),
2000 Western Tottori Earthquake (Mj=7.3), and 2004 Mid
Niigata Earthquake (Mj=6.8) (JMA, 2007).
The 2007 Chuetsu-oki Earthquake occurred in the Niigata-Kobe Tectonic Zone where high strain rates have been observed fromGPS data analyses (Sagiyaet al., 2000). The source region of themain shock was also located in the easternmargin of the Japan Sea, which is a region ofmany active faults and folds comprising a series of anticline struc-tures and reverse faults (Okamuraet al., 1998). Many large earthquakes have occurred along this active fault zone, such as the 1828 Echigo-Sanjo Earthquake (M=6.9), 1964 Ni-igata Earthquake (Mj=7.5), and 2004 Mid Niigata
Earth-quake. The Western Nagaoka Basin active fault systemhas westward dipping faults (Research Group for Active Faults
Copyright cThe Society of Geomagnetismand Earth, Planetary and Space Sci-ences (SGEPSS); The Seismological Society of Japan; The Volcanological Society of Japan; The Geodetic Society of Japan; The Japanese Society for Planetary Sci-ences; TERRAPUB.
of Japan, 1991) and is located approximately 10 km south-east of the epicenter of themain shock (Fig. 1). Fromthe aftershock distribution determined by the NIED Hi-net rou-tine analysis, we could roughly discriminate a southeast dipping alignment. However, it was difficult to reveal the fine structure of the main shock fromthe routinely deter-mined hypocenters.
The purposes of this paper are to clarify the fault geom e-try ruptured during themain shock and to discuss the rela-tion between the faults of themain shock and the surround-ing active faults. First, we determined the initial hypocen-tral locations by employing the one-dimensional velocity structure and station corrections derived fromthe aftershock data of the 2004 Mid Niigata Earthquake (Shibutaniet al., 2005). Next, we relocated these hypocenter locations with the help of the double-difference relocation algorithm (hy-poDD) (Waldhauser and Ellsworth, 2000) using the differ-ential arrival time obtained by both manual picking and waveformcross-correlation analysis.
2.
Data and Method
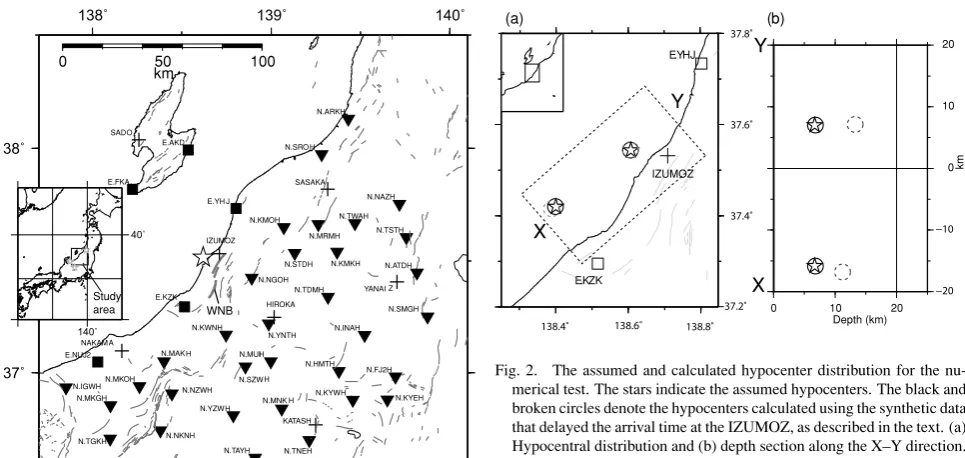
We used 50 permanent online stations operated by the NIED Hi-net, JMA, and Earthquake Research Institute of the University of Tokyo (ERI) (Fig. 1). We used the dates of 1,399 earthquakes that occurred in and around the source region in the period between January 1, 2004 and July 18, 2007. Themagnitudes of these earthquakes were greater than or equal to 0.2. Wemanually pickedP- andS-arrival times,Ppolarities, and themaximumamplitude.
2.1 Initial hypocenter location
The initial hypocentral locations of the earthquakes used for the hypoDD relocation were determined by applying a maximumlikelihood estimation algorithm(hypomh) (Hi-rata and Matsu’ura, 1987). It is difficult to adequately
0 50 100
Fig. 1. Map showing the location of the stations (triangles: NIED stations, squares: ERI stations, crosses: JMA stations) used in this study. The star denotes the epicenter of themain shock to be relocated in this study. In the insetmap, the study area is shown by a rectangle with respect to the greater parts of Japan Island. The stars in the insetmap denote the epicenters of the intermediate-depth earthquakes that occurred in the depth range of 150–120-km, which are used to estimate the travel time residual at each station. The gray lines show the surface trace of the active fault (Research Group for Active Faults of Japan, 1991). WNB indicates the surface trace of the Western Nagaoka Basin active fault system.
mine the absolute hypocenter locations by employing only the one-dimensional velocity structure because of the thick marine sedimentary layers with a low velocity at depths of up to 5 kmin the Niigata basin (e.g. Takedaet al., 2004). Thus, in addition to the one-dimensional velocity model, we employed station corrections for theP- andS-waves that were derived fromthe aftershock data of the 2004 Mid Ni-igata Prefecture Earthquake using a joint hypocenter deter-minationmethod (Kisslinget al., 1994) estimated by Shibu-taniet al.(2005). These station corrections were coincident with the average travel time residual at each station for the three intermediate-depth earthquakes that occurred in the 150–250 kmdepth range around the study area (Fig. 1). Since the ray paths to each station fromthese interm ediate-earthquakes and the 2004 Mid Niigata Prefecture Earth-quake area are different except at the near surface area, this result suggests that the station corrections reflect the three-dimensional velocity structure variations at the near surface area. As a result of employing the one-dimensional struc-ture and station corrections in the hypomh algorithm, the hypocenters shifted upward by approximately 10 kmfrom the corresponding hypocenters determined by the Hi-net routine analysis. The rootmean square (RMS) of the travel time residuals decreased from603ms to 399ms.
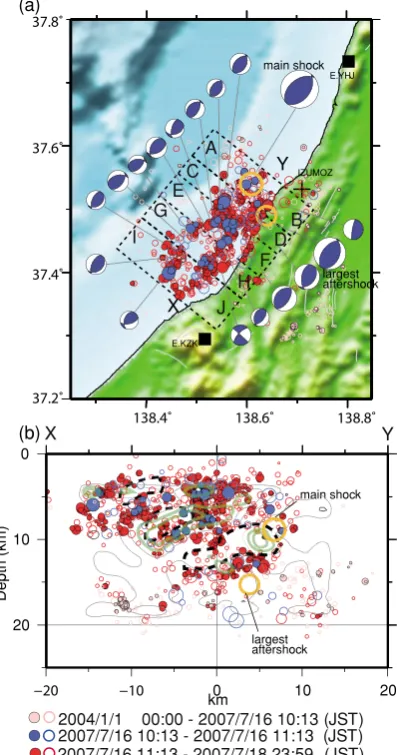
The source region is barely beyond the station network, as shown in Fig. 1. In order to examine the effect of station coverage on the absolute earthquake location, we carried out a numerical test using the station distribution shown in Fig. 1. We assumed two hypocenters in the source region, as
X
Fig. 2. The assumed and calculated hypocenter distribution for the
nu-merical test. The stars indicate the assumed hypocenters. The black and broken circles denote the hypocenters calculated using the synthetic data that delayed the arrival time at the IZUMOZ, as described in the text. (a) Hypocentral distribution and (b) depth section along the X–Y direction.
indicated by the stars in Fig. 2. We calculated the theoretical arrival time at each station using the velocity structure esti-mated by Shibutaniet al.(2005). Then, the randomnoises within ±30 ms and ±50 ms were added for the P- and S-arrival times, respectively. We located the hypocenters based on these synthetic data using the hypomh algorithm and the same velocity structure. As a result, we were able to determine the locations and origin times within±0.2 km and 5ms, respectively, fromthe assumed hypocenters. This result suggests that we can constrain the absolute earth-quake locations and origin times fromthis station coverage if we apply the appropriate velocity structure. In order to examine the effect of the heterogeneity of the velocity struc-ture, we purposely delayed the arrival times of synthetic data at the IZUMOZ station for 0.8 s and 1.6 s for theP -andS-arrival times, respectively. Fromthe station correc-tion estimated by Shibutaniet al.(2005) and the travel time residual for intermediate-depth earthquakes, it is found that this station has a large positive travel time residual. From these synthetic data, the depths of the hypocenters were de-termined to be 2–6 kmdeeper than those of the assumed hypocenters, as indicated by the broken circles in Fig. 2. An appropriate station correction compensates for such a travel time residual caused by the heterogeneous velocity structure at the near surface area. The decreasing RMS of travel time residuals on the application of the station cor-rectionmentioned above suggests that the effect of the het-erogeneous velocity structure at the near surface area was appropriately corrected.
2.2 Hypocenter relocation
times. We used only the double-difference data with a nor-malized cross-correlation coefficient greater than or equal to 0.85. After applying this threshold, we obtained a data set of accurate differential arrival times that contained 8,533 P-wave observations and 12,891S-wave observations. Dur-ing the iterations of the hypoDD algorithm, the events were deleted if they lost connection with the other events or if they were located above the ground surface. A total of 48% of the 1,216 events were successfully relocated, including both themanually picked and cross-correlation data. After the hypoDD procedure, the RMS of the double-difference time residual decreased from294ms to 186ms and from 184ms to 7ms for themanually and cross-correlation data, respectively.
In order to assess the uncertainty of the hypocenter loca-tion, we applied the bootstrap resamplingmethod (Shearer, 1997) to all relocated events. The synthetic data set was cal-culated by assigning the predicted travel times at the final location with the randomly resampled residuals. We then relocated all of the events using the synthetic data set to determine a shift in the location fromthe final hypocenter. This process was repeated 200 times. The relative location error of each hypocenter is defined as the standard deviation (2σ) for the location shifts fromthe final hypocenters. The relative location errors were less than 0.43 km, 0.45 km, and 1.4 kmin the EW, NS, and vertical directions, respectively, for 90% of all the relocated events. On the other hand, the relative location errors were less than 0.055 km, 0.056 km, and 0.24 kmin the EW, NS, and vertical directions, respec-tively, for 90% of the events that were relocated using both themanually picked and cross-correlation data.
3.
Re
s
ult
s
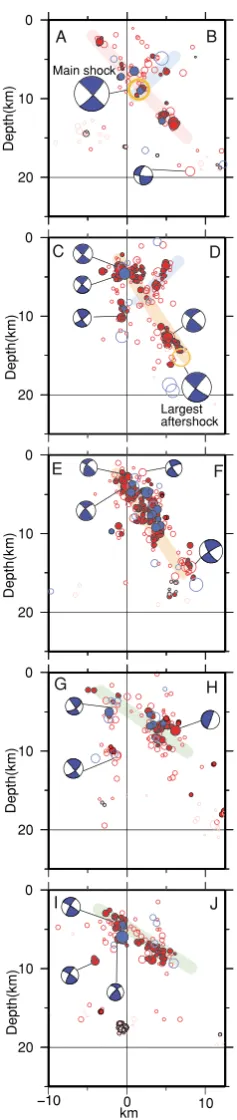
Figure 3 shows the distribution of the selected events with relative errors of less than 1.5 kmin the EW, NS, and vertical directions. A total of 91% of the relocated events were selected. The hypocenters relocated by both them an-ually picked and cross-correlation data and only them anu-ally picked data are denoted by the solid and open circles, respectively. The corresponding moment tensor solutions estimated fromthe NIED F-net broadband waveformdata (Matsumoto et al., 2007) are also shown in Fig. 3. The aftershocks extended for approximately 25 km in the di-rection of N38◦E-S38◦W. The trend of aftershock epicenter distributions in themap view is almost consistent with the strikes of the nodal planes of themoment tensor solutions. The aftershock depth distribution along the X–Y cross sec-tion in Fig. 3 is deeper (down to approximately 20 km) at the northeast part, while it is shallower at the southwest part. The largest aftershock occurred at the deepest point. The upper limit of the aftershock depth distributions is ap-proximately 3 km. We can observe the sparse aftershock distributions along the X–Y cross section (surrounded by the broken ellipsoids). The ordinary seismic activity before themain shock, illustrated by the light red color in Fig. 3, mainly distributes in the 15- to 20-kmdepth range around the lower limit of the aftershock depth distributions.
Figure 4 shows the cross-sectional view perpendicular to the X–Y direction in Fig. 3. The aftershock distribution is predominantly southeastward dipping. The dip angles
E.KZK
E.YHJ
IZUMOZ
0
10
20
0 10 20
km
X Y
Depth (km)
A
B C
D E
F G
H I
J
2004/1/1 00:00 - 2007/7/16 10:13 (JST)
2007/7/16 11:13 - 2007/7/18 23:59 (JST) 2007/7/16 10:13 - 2007/7/16 11:13 (JST) (a)
(b)
main shock
largest aftershock
main shock largest aftershock
X
Y
Fig. 3. (a) Map of the relocated earthquake hypocenters determined by the double-difference earthquake algorithm. (b) Depth section of the relocated earthquakes along the strike of the nodal planes for themain shockmoment tensor (X–Y direction in Fig. 3(a)). The orange circles indicate the locations of themain shock and largest aftershock. The light red, blue, and red circles indicate the locations of the earthquakes that occurred in the period betweenmidnight, January 1, 2004 (JST) and 10:13 AM, July 16, 2007 (JST), 10:13 AM, July 16, 2007 (JST) and 11:13 AM, July 16, 2007 (within an hour after themain shock) (JST), and 11:13 AM, July 16, 2007 (JST) and 11:59 PM, July 18, 2007 (JST), respectively. The events relocated by both themanually picked and cross-correlation data are indicated by solid circles, and those relocated by only themanually picked data are indicated by open circles. The correspondingmoment tensor solutions (Matsumotoet al., 2007) are also shown. The contour lines along the X–Y cross section indicate the slip distribution that was estimated by Aoiet al.(2008) assuming the southeastward dipping fault plane. The large slip areas exceeding a dislocation of 1.5mare indicated by green transparent lines.
0
10
20
0 10
km 0
10
20 0
10
20 0
10
20 0
10
20
Depth(km)
Depth(km)
Depth(km)
Depth(km)
Depth(km)
A B
C D
E F
G H
I J
Main shockk
Largest aftershock
Fig. 4. Depth section of the relocated earthquakes. Each section corre-sponds to the rectangular area drawn in Fig. 3 (the perpendicular di-rection of the nodal plane of themain shockmoment tensor solution). The correspondingmoment tensor solutions are also shown. Red, blue, orange, and green lines indicate the aftershock alignments. The signif-icance of the circles of each color is described in the caption of Fig. 3. The spacing of each section along the X–Y direction in Fig. 3 was cho-sen to fit offsets in the aftershock distribution.
angle of 30◦, as illustrated by the green line along the cross sections of G–H and I–J in Fig. 4.
Within an hour after the occurrence of themain shock, aftershocks occurred across the entire aftershock region, as
indicated by the blue circles in Figs. 3 and 4. However, a small number of aftershocks occurred around the largest af-tershock hypocenter (X–Y cross section in Fig. 3 or A–B, C–D, and E–F cross sections in Fig. 4). The aftershocks in this area were activated after the largest aftershock. These aftershocks are associated with the largest aftershock. In the northeast part of the aftershock area, aftershocks occurred within an hour after themain shock on both the southeast-ward and northwestsoutheast-ward dipping aftershock alignments in the area above the 10-kmdepth (A–B and C–D cross sec-tions in Fig. 4).
4.
Di
s
cu
ss
ion
We havemodeled the fault structure based on the relo-cated aftershocks, as shown in Fig. 5. We can identify four individual faults that are consistent with the aftershock dis-tributions andmoment tensor solutions. This fault model suggests that the main shock predominantly ruptured the southeastward dipping fault planes. The dip angle of the southeast dipping fault plane is significantly lower than that in the northern part. This result suggests that themain shock fault has segments between the northern and southern parts of the aftershock region. Around the hypocenter of the main shock, aftershocks occurred on both the fault planes within an hour after themain shock. The maximal after-shock in this area isM4.9 (on the northwest dipping align-ment at a 5-kmdepth along the A–B cross section in Fig. 4) whose fault size is smaller than the northwest dipping fault in our model. The conjugate fault planes dipping north-westward and southeastwardmay be nearly coincidentally ruptured during themain shock. The deep part of the West-ern Nagaoka Basin active fault system dipping westward (Fig. 1)may be connected with the northwestward dipping fault plane.
The sparse aftershock distributions along the X–Y cross section (Fig. 3) are almost consistent with the large slip area during themain shock wherein a large slip exceeding a dis-location of 1.5mwas detected by an inversion of strongm o-tion data (Aoiet al., 2008) whose fault geometry is agree-ment with the aftershock distribution. It is possible that the stress accumulated on themain shock fault was largely
20 15 10 5
0 E.KZK
IZUMOZ
138.3 138.4
138.5 138.6
138.7 138.8
Depth (km)
N
37.2 37.3
37.4 37.5
37.6 37.7
37.8 WNB
leased due to the large slip. The aftershock distributions occurring within an hour after themain shock suggest that the rupture during themain shock spread across the entire aftershock region, except in the area around the largest af-tershock.
The hypocentral depth of the events relocated in our anal-ysis is approximately 10 kmshallower than that of the cor-responding events determined by the Hi-net routine analy-sis. This result is consistent with the sourcemodel derived fromthe crustal deformation detected using synthetic aper-ture radar (SAR) interferometry (Ozawa, 2008) wherein the upper end of the slip area on the main shock fault model is at a depth of 2.5 km. The optimal centroid depth of the moment tensor solutions (Matsumoto et al., 2007) is also consistent with the depth of our result. The average differ-ence between the depths of corresponding events is 2.2 km. These results support the validity of our analysis.
5.
Conclu
s
ion
s
We obtained highly accurate hypocenters with the double-difference earthquake relocation algorithm using both themanually picked and cross-correlation data. From the relocated aftershock distribution, we successfully re-solved the detailed fault structures that are consistent with the aftershock distributions andmoment tensor solutions. From the fault model, we conclude that the main shock predominantly ruptured the southeastward dipping fault planes. Around the main shock hypocenter, the conju-gate fault planes dipping northwestward and southeastward might be nearly coincidentally ruptured during the main shock.
Acknowledgments. We are grateful to F. Waldhauser for the hy-poDD programcode. We thank Dr. Takuo Shibutani for provid-ing us with the one-dimensional velocity structure and station cor-rection derived fromthe aftershock data of the 2004 Mid Niigata Earthquake. We also thank the Japan Meteorological Agency and Earthquake Research Institute of the University of Tokyo for al-lowing us to use the waveform data. We are grateful to Terry Webb, an anonymous reviewer, who greatly helped us to improve thismanuscript, and Kiyoshi Yomogida for editing it. The ma-jority of the figures were created using Generic Mapping Tools (GMT) (Wessel and Smith, 1995).
References
Aoi, S., H. Sekiguchi, N. Morikawa, and T. Kunugi, Source process of the 2007 Niigata-ken Chuetsu-oki earthquake derived fromnear-fault strongmotion data,Earth Planets Space,60, this issue, 1131–1135, 2008.
Hirata, N. and M. Matsu’ura, Maximum-likelihood estimation of hypocen-ter with origin time eliminated using nonlinear inversion technique, Phys. Earth Planet. Inter.,47, 50–61, 1987.
Japan Meteorological Agency, http://www.jishin.go.jp/main/chousa/07jul chuetsu oki, 2007.
Kissling, E., W. L. Ellsworth, D. Eberhart-Phillips, and U. Kradolfer, Ini-tial referencemodels in local earthquake tomography,J. Geophys. Res., 99, 19635–19646, 1994.
Matsumoto, T., H. Matsubayashi, and T. Kazakami, F-net Moment Tensor Solution on The Niigataken Chuetsu-oki Earthquake in 2007,Seismol. Soc. Jpn. Programme. Abstr. Fall Meeting, 2007 (in Japanese). Okamura, Y., S. Kuramoto, and M. Sato, Active structures and their
re-lation to earthquakes along the easternmargin of the Japan Sea,Bull. Geol. Surv.,49, 1–18, 1998 (in Japanese with English abstract). Ozawa, T., Coseismic deformatoin of the 2007 Chuetsu-oki earthquake
derived fromPALSAR/InSAR and its faultmodel,Earth Planets Space, 60, this issue, 1099–1104, 2008.
Research Group for Active Faults of Japan,Active Faults in Japan,revised edition, 437 pp., University of Tokyo Press, Tokyo, 1991 (in Japanese). Sagiya, T., S. Miyazaki, and T. Tada, Continuous GPS array and present-day crustal deformation of Japan,Pure Appl. Geophys.,157, 2303– 2322, 2000.
Shearer, P., Improving local earthquake locations using the L1 normand waveformcross correlation: Application to the Whittier Narrows, Cali-fornia, aftershock sequence,J. Geophys. Res.,102, 8269–8283, 1997. Shibutani, T., Y. Iio, S. Matsumoto, H. Katao, T. Matsushima, S. Ohmi,
F. Takeuchi, K. Uehira, K. Nishigami, B. Enescu, I. Hirose, Y. Kano, Y. Kohno, M. Korenaga, Y. Mamada, M. Miyazawa, T. Ueno, H. Wada, and Y. Yukutake, Aftershock distribution of the 2004 Mid Niigata Pre-fecture Earthquake derived froma combined analysis of temporary on-line observations and permanent observations,Earth Planets Space,57, 545–549, 2005.
Takeda, T., H. Sato, T. Iwasaki, N. Matsuta, S. Sakai, T. Iidaka, and A. Kato, Crustal structure in the northern Fossa Magna region, central Japan, fromrefraction/wide-angle reflection data,Earth Planets Space, 56, 1239–1299, 2004.
Townend, J. and M. D. Zoback, Stress, strain, andmountain building in central Japan,J. Geophys. Res.,111, doi:10.1029/2005JB003759, 2006. Waldhauser, F. and W. L. Ellsworth, A double-difference earthquake loca-tion algorithm: Method and application to the Northern Hayward fault, Bull. Seismol. Soc. Am.,90, 1352–1368, 2000.
Wessel, P. and W. H. F. Smith, New version of the genericmapping tools released,Eos Trans. AGU,76, 329, 1995.