STABILITY-INDICATING REVERSE-PHASE HIGH- PERFORMANCE LIQUID CHROMATOGRAPHIC
METHOD DEVELOPMENT FOR SIMULTANEOUS ESTIMATION OF SOFOSBUVIR AND
DACLATASVIR IN PURE AND PHARMACEUTICAL FORMULATION
SWETHA A
1, RAMYA KUBER B
2*
1Department of Pharmaceutical analysis, Institute of Pharmaceutical Technology, Sri Padmavati Mahila Visvavidyalayam, Tirupati,
Andhra Pradesh, India. 2Department of Pharmacognosy, Institute of Pharmaceutical Technology, Sri Padmavati Mahila Visvavidyalayam,
Tirupati, Andhra Pradesh, India. Email: [email protected] Received: 06 May 2019, Revised and Accepted: 11 June 2019 ABSTRACT
Objective: The objective of the study was to develop a novel, simple, sensitive, accurate, precise, and stability-indicating reverse-phase (RP) liquid chromatographic method for simultaneous estimation of sofosbuvir and daclatasvir in pure and pharmaceutical formulation.
Methods: In the present work, chromatographic separation was done using stationary-phase discovery column (250 mm×4.6 mm; 5 µm particle size) and mobile phase consisting of 0.1N potassium dihydrogen orthophosphate buffer:acetonitrile (55:45, v/v), with the flow rate of 1 ml/min, and the detection of column effluents was achieved with photodiode array at 260 nm.
Results: The retention time of sofosbuvir and daclatasvir was found to be 2.32 min and 3.06 min, respectively. Stability-indicating studies were conducted according to the guidelines of International Conference on Harmonization (ICH) Q1A R2, and validation of the method was done as per the ICH guidelines Q2R1. The linearity of the method was in the concentration range of 100–600 µg/ml and 15–90 µg/ml for sofosbuvir and daclatasvir, respectively. The correlation coefficients were found to be 0.9996 and 0.9996 for sofosbuvir and daclatasvir, respectively. The limit of detection and limit of quantification were found to be 0.19 µg/ml and 0.59 µg/ml for sofosbuvir and 0.02 µg/ml and 0.05 µg/ml for daclatasvir, respectively. Conclusion: The stability-indicating RP high-performance liquid chromatographic (RP-HPLC) method was novel, simple, precise, accurate, and sensitive for simultaneous estimation of sofosbuvir and daclatasvir in pure and pharmaceutical formulations. Hence, the developed method was adopted for qualitative and quantitative analysis of sofosbuvir and daclatasvir in pure and pharmaceutical formulations.
Keywords: Sofosbuvir, Daclatasvir, Reverse-phase high-performance liquid chromatographic, Stability indicating, Validation, International Conference on Harmonization.
INTRODUCTION
Hepatitis is a kind of liver disease, and various forms of liver diseases are hepatitis A virus, hepatitis B virus, hepatitis C virus (HCV), hepatitis D virus, hepatitis E virus, and liver cirrhosis [1,2]. Sofosbuvir (GS-7977/PSI-7977) is a nucleotide HCV NS5B polymerase inhibitor. It is a prodrug of 2-deoxy-2-fluoro-2-C-methyluridine, which is converted to its active form within hepatocytes. Oral sofosbuvir was well tolerated and demonstrated significant advance in the treatment of patients with chronic hepatitis C genotypes (GT) 2–3 infection. Sofosbuvir chemically called as (S)-isopropyl-2-{[(S)-{[(2R,3R,4R,5R)- 5-{2,4-dioxo-3,4-dihydropyrimidin-1(2H)-yl)-4-fluoro-3-hydroxy-4-methyltetrahydrofuran-2-yl) methoxy–(phenoxy) phosphoryl amino) propanoate [3-5]. Daclatasvir is the first HCV NS5A replication complex inhibitor and has potent antiviral effect and clinical efficacy across multiple HCV GT 1–5. Daclatasvir was administered as a part of triple therapy in combination with other directly acting antiviral drugs to increase antiviral activity and to decrease the drug resistance. Daclatasvir is chemically called as methyl N-[(2S)-1-[(2S)-2-[5-[4-[4-[2-[(2S)-1-[(2S)-1-(2S)-2-(methoxy carbonyl amino)-3-methyl butanoyl] pyrrolidin-2-yl]-1H-imidazol-4-yl]-4-biphenylyl]-1H-imidazol-2-yl] pyrrolidin-1-yl]-3-methyl-1-oxobutan-2-yl]carbamate. Daclatasvir and Sofosbuvir combination had shown 90% SVR (Sustained virological response) rates for 12 weeks in patients without cirrhosis [6-9].
Literature survey revealed that spectrophotometric methods [10-16], spectrofluorimetry [17], high-performance liquid chromatographic
(HPLC) methods [18-25], ultra-performance liquid chromatography (UPLC) methods [26,27], and UPLC-tandem mass spectrometer [28] have been reported for simultaneous estimation of sofosbuvir and daclatasvir alone or in combination with other drugs. From literature, it was confirmed that two HPLC methods were reported for simultaneous estimation of sofosbuvir and daclatasvir, but no forced degradation studies were performed in one method [24]. Another method, i.e., separation of sofosbuvir and daclatasvir, was very slow [25]. Hence, an attempt was made to develop a simple, rapid, precise, accurate stability-indicating reverse-phase HPLC (RP-HPLC) method for simultaneous estimation of sofosbuvir and daclatasvir in pure and pharmaceutical formulation. The method was validated as per the International Conference on Harmonization (ICH) guidelines [29], while forced degradation studies were conducted according to the ICH guidelines [Figs. 1 and 2] [30].
METHODS
Selection of wavelength
Sofosbuvir and daclatasvir solutions in diluent were scanned in the range of 200–400 nm, individually to scan ultraviolet (UV) spectrum. The overlain UV spectra of sofosbuvir and daclatasvir had shown 260 nm as a suitable wavelength for performing current RP-HPLC method, and both drugs show appropriate absorption at this wavelength.
Chromatographic conditions
The chromatographic separation of sofosbuvir and daclatasvir was achieved with stationary-phase discovery column (250 mm×4.6 mm, © 2019 The Authors. Published by Innovare Academic Sciences Pvt Ltd. This is an open access article under the CC BY license (http://creativecommons. org/licenses/by/4. 0/) DOI: http://dx.doi.org/10.22159/ajpcr.2019.v12i8.33961
5 µ) and mobile phase consisting of 0.1 N potassium dihydrogen orthophosphate buffer and acetonitrile (55:45, v/v). The flow rate was 1 ml/min. Mobile phase was degassed using an ultrasonic water bath for 10 min, and then, vacuum was filtered through a 0.45 µ membrane filter. The column effluents were detected at a wavelength of 260 nm using photodiode array (PDA) as a detector.
Preparation of 0.1N potassium dihydrogen orthophosphate buffer (pH-4.8)
1.36 g of potassium dihydrogen orthophosphate was accurately weighed and dissolved in 900 ml of water, 1 ml of triethylamine was added, and then, pH was adjusted to 4.8 with dilute orthophosphoric acid solution. Finally, buffer was degassed using an ultrasonic water bath for 10 min and filtered through the 0.45 µ membrane filter.
Preparation of standard solution
40 mg of sofosbuvir and 6 mg of daclatasvir standard were accurately weighed and transferred into 10 ml calibrated volumetric flasks. 7 ml of diluent was added and sonicated to remove dissolved gases for 5 min, and final volume was made up to the mark with diluent and working standard solutions were also prepared. 1 ml from above two stock solutions was pipetted out in 10 ml volumetric flasks, and volume was made up to mark with diluent.
Sample preparation
10 tablets were weighed and powdered, and the average weight of total tablets was calculated. Powder equivalent to sofosbuvir 400 mg and daclatasvir 60 mg was transferred into 100 ml volumetric flask, 50 ml diluent was added and sonicated to dissolve gases for 25 min and
filtered using 0.22 µ membrane filters to get clear solution, and final volume was made up with diluent. After suitable dilution, above stock solution of the sample was used for routine analysis.
Method validation
The method was validated as per the ICH guidelines for validation of analytical procedures. Validation parameters include system suitability, linearity, limit of detection (LOD), limit of quantification (LOQ), accuracy, precision, robustness, and specificity.
System suitability
System suitability tests were performed to ensure that system is working properly. System suitability parameters, including tailing factor, plate count, retention time, and resolution, were analyzed using the proposed HPLC method. System suitability was evaluated by injecting six replicates of standard mixture solution.
Linearity
Linearity of the proposed method was evaluated by constructing calibration curve between concentrations against corresponding peak area using the least square method. The slope and correlation coefficient (r2) values were calculated for both sofosbuvir and daclatasvir.
Precision
Precision of the developed method was estimated by six replicate injections of sample solution at working concentration, on the same day (intra-day precision) and on the 2nd day (inter-day precision) to ensure
repeatability of the analytical method.
Accuracy (recovery)
Accuracy of the developed method was estimated by spiking the analyte sample solution with standard solution at 50%, 100%, and 150% levels. Percentage recovery and percent relative standard deviation (% RSD) were calculated to determine the accuracy.
Specificity
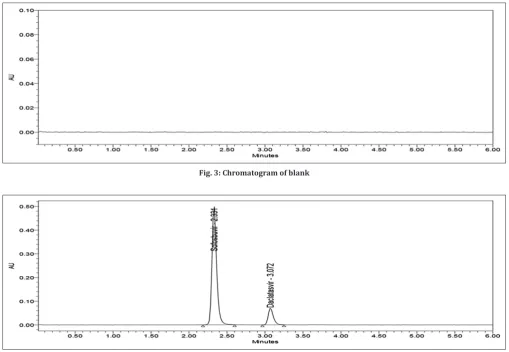
Specificity of the proposed method was carried out by comparing chromatograms of blank, standard solution, and sample solution at working concentration. The chromatograms reveal no peak at retention time of sofosbuvir and daclatasvir, and there was a good correlation between standard and sample. It was observed no interference of excipients in blank with drug. Hence, it can be concluded that the proposed method is said to be specific.
LOD and LOQ
LOD and LOQ were estimated based on the standard deviation of the response and slope of calibration curve of sofosbuvir and daclatasvir. The following formula is used to calculate LOD and LOQ.
• LOD=3.3σ/s • LOQ=10σ/s
• σ is standard deviation of response • s is slope of calibration curve.
Robustness
Robustness of the developed was estimated by subjecting minor changes in chromatographic conditions, such as flow rate change (±0.1 ml), temperature change (±5°C), and mobile-phase change (±10%). There was no marked change in the present developed method, which indicates reliability of the method. The data are given in Tables 1 and 2.
Stability-indicating studies
Stability-indicating studies were conducted at different stress conditions, to demonstrate intrinsic stability of drug substance and to aid in establishing recommended storage conditions. Stability-indicating studies include acid hydrolysis, base hydrolysis, peroxide hydrolysis, neutral hydrolysis, thermal degradation, and photodegradation.
Acid hydrolysis
1 ml of standard solution of sofosbuvir 400 µg/ml and daclatasvir 60 µg/ml and 1 ml of 1N HCl had been taken in 10 ml volumetric flask Fig. 1: Structure of sofosbuvir [5]
and refluxed at 60°C for 30 min. The solution was neutralized with sufficient volume of 1N NaOH. The flask was diluted up to 10 ml with
diluent. The resultant solution had been filtered using 0.22 μ syringe
filter, and the respective chromatograms were recorded by injecting the solution into HPLC system.
Base hydrolysis
1 ml of standard solution of sofosbuvir 400 µg/ml and daclatasvir 60 µg/ml and 1 ml of 1N NaOH had been taken in 10 ml volumetric flask and refluxed at 60°C for 30 min. The solution was neutralized with sufficient volume of 1N HCl. The flask was diluted up to 10 ml with
diluent. The resultant solution had been filtered using 0.22 μ syringe
filters, and the respective chromatograms were recorded by injecting the solution into HPLC system.
Peroxide hydrolysis
1 ml of standard solution of sofosbuvir 400 µg/ml and daclatasvir 60 µg/ml and 1 ml of 20% H2O2 had been taken in 10 ml volumetric
flask and refluxed at 60°C for 30 min. The solution was diluted up to
10 ml with diluent. The resultant solution had been filtered using 0.22 μ
syringe filters, and the respective chromatograms were recorded by injecting the solution into HPLC system.
Thermal degradation
1 ml of standard solution of sofosbuvir 400 µg/ml and daclatasvir 60 µg/ml had been taken in 10 ml volumetric flask and placed in an oven at 105°C for 6 h. The flask was diluted up to 10 ml with diluent.
The resultant solution had been filtered using 0.22 μ syringe filters, and
the respective chromatograms were recorded by injecting the solution into HPLC system.
Photodegradation
1 ml of standard solution of sofosbuvir 400 µg/ml and daclatasvir 60 µg/ml had been taken in 10 ml volumetric flask and kept in UV chamber at 200 Wh/m2. The resultant solution was diluted up to 10 ml
with diluent and filtered using 0.22 μ syringe filters, and the respective
chromatograms were recorded by injecting the solution into HPLC system.
Neutral degradation
1 ml of standard solution of sofosbuvir 400 µg/ml and daclatasvir 60 µg/ml and 1 ml of water had been taken in 10 ml volumetric flask and refluxed at 60°C for 30 min. The resultant solution was diluted up
to 10 ml with diluent and filtered using 0.22 μ syringe filters, and the
respective chromatograms were recorded by injecting the solution into HPLC system.
RESULTS AND DISCUSSION Method development
To develop an optimized method for the estimation of sofosbuvir and daclatasvir simultaneously, several trails were conducted. The development trails were conducted based on the chemical nature of sofosbuvir and daclatasvir. During optimization of the method, selection of column has been done based on reasonable retention time, number of theoretical plates, tailing factor, peak shape. Mobile phase was selected based on polarity of functional groups present in sofosbuvir and daclatasvir. By analyzing the above factors, chromatographic separation was done on discovery column (250 mm×4.6 mm, 5 µ particle size) using mobile phase of buffer:acetonitrile (65:35 v/v), flow rate of 1 ml/min was favorable for good separation and injection volume 10 µL, and the column eluents were detected with a PDA detector at 260 nm. Sofosbuvir and daclatasvir were eluted at retention time of 2.32 min
Fig. 3: Chromatogram of blank
and 3.06 min, respectively. The optimized chromatographic conditions are shown in Table 3, and the typical HPLC chromatograms of blank, standard, and sample are represented in Figs. 3-5.
Method validation System suitability
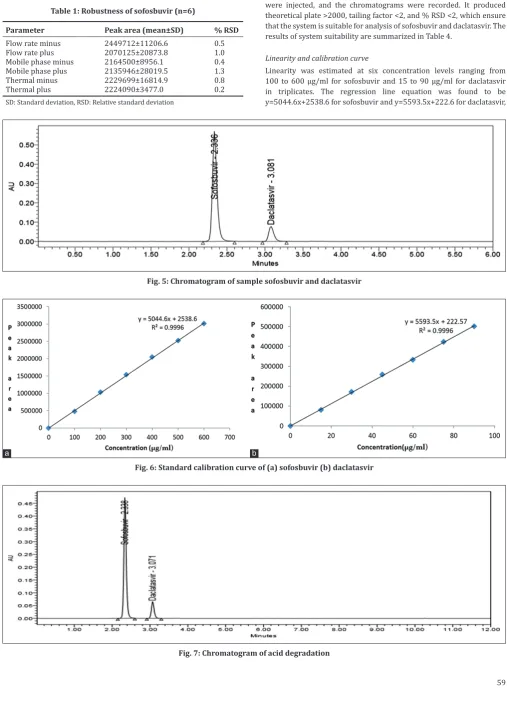
Six replicate injections of sofosbuvir and daclatasvir standard solution were injected, and the chromatograms were recorded. It produced theoretical plate >2000, tailing factor <2, and % RSD <2, which ensure that the system is suitable for analysis of sofosbuvir and daclatasvir. The results of system suitability are summarized in Table 4.
Linearity and calibration curve
Linearity was estimated at six concentration levels ranging from 100 to 600 µg/ml for sofosbuvir and 15 to 90 µg/ml for daclatasvir in triplicates. The regression line equation was found to be
y=5044.6x+2538.6 for sofosbuvir and y=5593.5x+222.6 for daclatasvir,
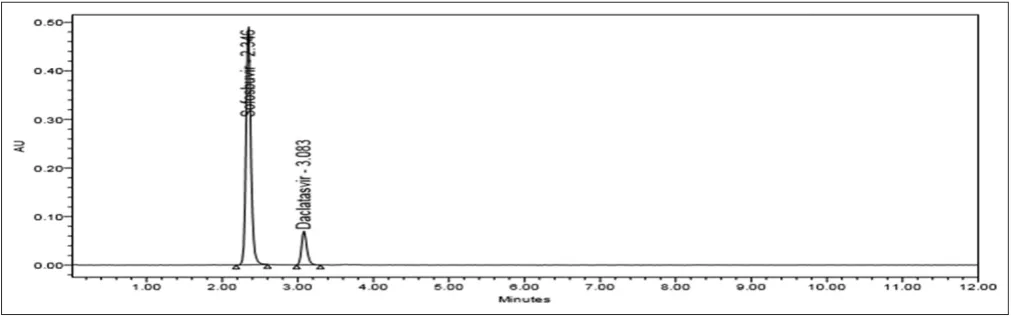
Fig. 5: Chromatogram of sample sofosbuvir and daclatasvir
Fig. 7: Chromatogram of acid degradation Table 1: Robustness of sofosbuvir (n=6)
Parameter Peak area (mean±SD) % RSD
Flow rate minus 2449712±11206.6 0.5
Flow rate plus 2070125±20873.8 1.0
Mobile phase minus 2164500±8956.1 0.4
Mobile phase plus 2135946±28019.5 1.3
Thermal minus 2229699±16814.9 0.8
Thermal plus 2224090±3477.0 0.2
SD: Standard deviation, RSD: Relative standard deviation
Fig. 6: Standard calibration curve of (a) sofosbuvir (b) daclatasvir
Acceptance criteria: %RSD should be <2.
Accuracy
The accuracy of the method was determined by calculating the mean percentage recovery of each component in the sample mixture at three distinct levels in triplicates. The % recovery of sofosbuvir was found to be in the range of 99.4–99.9% and for daclatasvir 98.8–100.6%. This indicates that recovery values are within acceptable limits, confirming the accuracy of the developed method.
Acceptance criteria: 98–102%
The results are tabulated in Tables 9 and 10.
LOD and LOQ
LOD and LOQ were found to be 0.19 and 0.59 µg/ml for sofosbuvir and 0.02 and 0.05 µg/ml for daclatasvir, respectively.
Fig. 8: Chromatogram of base degradation
Table 2: Robustness of daclatasvir (n=6)
Parameter Peak area (mean±SD) % RSD
Flow rate minus 372837±852.6 0.2
Flow rate plus 320314±3874.2 1.2
Mobile phase minus 330986±3123.4 0.9
Mobile phase plus 337958±1294.2 0.4
Thermal minus 346640±3621.7 1.0
Thermal plus 338941±1877.6 0.6
SD: Standard deviation, RSD: Relative standard deviation
Table 3: Optimized chromatographic conditions for estimation of sofosbuvir and daclatasvir
Parameter Condition
Mobile phase Buffer:acetonitrile (55:45, v/v) Diluent Water:acetonitrile (50:50, v/v)
Column Discovary (250 mm×4.6 mm, 5 µ paricle size)
Detector PDA
Table 4: System suitability of developed method
Parameters Sofosbuvir Daclatasvir Acceptance criteria Retention time (min) 2.343 3.079
Theoretical plates 6939.8 9786.5 >2000
Tailing factor 1.21 1.288 <2
Resolution 6.1 6.1 >2
Table 5: Linearity and range of sofosbuvir (n=3)
S. No. Concentration
(µg/ml) Peak area (mean±SD)
1. 100 477193±1921.5
n is number of determination. SD: Standard deviation
Table 6: Linearity and range of daclatasvir (n=3)
S. No. Concentration
(µg/ml) Peak area (mean±SD)
1. 15 80708±181.2
n is number of determination. SD: Standard deviation
which meet the acceptance criteria. The regression data for calibration curve had shown a good relationship over respected concentration range for sofosbuvir and daclatasvir. Therefore, the proposed method is found to be linear. The results are presented in Tables 5 and 6, and the data are shown in Fig. 6.
Precision
Stability-indicating studies
Stability-indicating studies were performed to know the stability of drug substance under specified stress conditions. Stability-indicating studies were performed under different stress conditions (acid/base/neutral hydrolysis, dry heat, oxidation, and photolysis). Under each condition,
both working standard solution and blank were subjected to stress conditions. The degradation conditions were optimized by optimizing the concentration of degrading reagent and time of exposure. The percentage assay of sofosbuvir and daclatasvir was decreased under all these stress conditions, but there was no predictable degradation peak Fig. 9: Chromatogram of oxidative degradation
Fig. 10: Chromatogram of thermal degradation
Table 7: Intra-day and inter-day precision for sofosbuvir (n=6)
Drug Concentration
(µg/ml) Intra-day precisionmean±SD % RSD Inter-day precisionmean±SD % RSD
Sofosbuvir 400 2022909±9780.9 0.5 2057580±15714.2 0.8
n is number of determination. SD: Standard deviation, RSD: Relative standard deviation
Table 8: Intra-day and inter-day precision for daclatasvir (n=6)
Drug Concentration
(µg/ml) Intra-day precisionMean±SD % RSD Inter-day precisionMean±SD % RSD
Daclatasvir 60 333806±2733.3 0.8 335196±2736.4 0.8
n is number of determination. SD: Standard deviation, RSD: Relative standard deviation
Table 9: Accuracy of the developed method for sofosbuvir (n=3)
Drug
name Level of addition (%) Amount added (mg) Drug found (mg/ml) mean±SD % Recovery mean±SD Average % recovery mean±SD
Sofosbuvir 50 200 198.8±1.15 99.4±0.57 99.6±0.57
100 400 397.5±2.65 99.4±0.66
150 600 599.7±2.65 99.9±0.44
Fig. 11: Chromatogram of photodegradation
Fig. 12: Chromatogram of neutral degradation
observed at these degradation conditions, which is shown in Figs. 7-12. The results of stress degradation studies are given in Tables 11 and 12.
CONCLUSION
The proposed RP-HPLC-PDA method for the estimation of sofosbuvir and daclatasvir in bulk and pharmaceutical dosage was simple, accurate, precise, and reliable method. The present analytical method has been validated completely according to the Q2B ICH guidelines, and the statistical analysis also proved that method was linear, accurate, precise, and specific for analysis of sofosbuvir and daclatasvir in the pharmaceutical dosage form. The forced degradation studies conducted under different stress conditions demonstrated the degradation
behavior of sofosbuvir and daclatasvir and stability-indicating property of the current analytical method, and it was proved that the present analytical method can be effectively resolute degradation peak from analytic peak. In the present developed method, PDA detector was used to confirm the peak purity. Therefore, the present RP-HPLC-PDA method was found to be stability indicating and can be used for quantification of sofosbuvir and daclatasvir in bulk and pharmaceutical dosage form.
ACKNOWLEDGMENT
The authors would like to thankful to BMR Chemicals and Entrepreneur Pvt. Ltd, Hyderabad, for providing drug samples, to carryout research work.
Table 10: Accuracy of the developed method for daclatasvir (n=3)
Drug
name Level of addition (%) Amount added (mg) Drug found (mg/ml) mean±SD % recovery mean±SD Average % recovery mean±SD
Daclatasvir 50 30 29.6±0.25 98.8±0.78 99.49±0.94
100 60 59.4±0.17 99.1±0.26
150 90 90.5±0.24 100.6±0.27
n is number of determinations. SD: Standard deviation
Table 11: Stability-indicating data of sofosbuvir
Degradation parameter Peak area of sample Peak area of standard % Assay % Degradation
Acid degradation 1931668 2024221 95.33 4.67
Alkali degradation 1968587 2024221 97.15 2.85
Oxidative degradation 1989549 2024221 98.19 1.81
Dry heat degradation 2006587 2024221 99.03 0.97
Photo degradation 2008725 2024221 99.14 0.86
AUTHOR CONTRIBUTION
The first author Swetha Addanki had done all steps in the present research work, and the second author was a mentor of the study.
CONFLICT OF INTERESTS
Authors confirmed that there was no conflict of interest to publish the present article.
REFERENCES
1. Phuong HL, Quang VT, Trung QV. A systemic review of hepatitis virus studies: A case of health economic evaluation analysis. Int J Pharm Pharm Sci 2017;9:114-20.
2. Prasanthi P, Vinitha V, Rambabu G. A review on anti-HCV agents targeting active site and allosteric sites of non-structural protein 5B [NS5B]. Int J Pharm Pharm Sci 2016;8:1-18.
3. Stedman C. Sofosbuvir, a NS5B polymerase inhibitor in the treatment of hepatitis C: A review of its clinical potential. Therap Adv Gastroenterol 2014;7:131-40.
4. Jacobson IM, Gordon SC, Kowdley KV, Yoshida EM, Rodriguez-Torres M, Sulkowski MS, et al. Sofosbuvir for hepatitis C genotype 2 or 3 in patients without treatment options. N Engl J Med 2013;368:1867-77.
5. Santosh VG, Pooja RA. Development and validation of stability indicating UV spectroscopic method for estimation of sofosbuvir. Int J Pharm Biol Sci 2018;8:404-13.
6. Alavian SM, Rezaee-Zavareh MS. Daclatasvir-based treatment regimens for hepatitis C virus infection: A systematic review and meta-analysis. Hepat Mon 2016;16:e41077.
7. Stanislas P. Daclatasvir, an efficient inhibitor of the hepatitis C virus replication complex protein NS5A: Review of virological data, treatment rationale and clinical trials. Clin Invest 2013;3:191-207. 8. Deepa C, Sumalatha R. High performance liquid chromatographic
method for the determination of daclatasvir in pharmaceutical dosage forms. Indo Am J Pharm Sci 2017;4:1431-7.
9. Nelson DR, Cooper JN, Lalezari JP, Lawitz E, Pockros PJ, Gitlin N,
et al. All-oral 12-week treatment with daclatasvir plus sofosbuvir in
patients with hepatitis C virus genotype 3 infection: ALLY-3 phase III study. Hepatology 2015;61:1127-35.
10. Santosh VG, Pooja RA. Development and validation of stability indicating UV spectroscopic method for estimation of sofosbuvir. Int J Pharm Biol Sci 2018;8:404-13.
11. Omprakash GB, Vivek GM, Sachin BG, Wale RR, Madhuri VP. Development, validation and stability study of UV Spectrophotometric method for determination of sofosbuvir in bulk and pharmaceutical dosage form. J Pharm Res 2017;11:847-9.
12. Hassouna ME, Mohamed MA. Novel and facile spectrophotometric techniques for the determination of sofosbuvir and ledipasvir in their tablet dosage form. J Anal Pharm Res 2016;7:92-9.
13. Jyothi BJ, Padmaja G. UV Spectrophotometric method for estimation of new drug, daclatasvir hydrochloride. Int Res J Pharm 2016;7:1-3. 14. Khushboo SB, Paresh UP. Development and validation of Q-Absorbance
ratio method for simultaneous estimation of sofosbuvir and daclatasvir dihydrochloride in solid dosage form. World J Pharm Pharm Sci 2018;7:730-40.
15. Chakravarthy VA, Sailaja BB, Praveen KA. Method development and
validation of ultraviolet-visible spectroscopic method for the estimation of hepatitis-C drugs daclatasvir and sofosbuvir in active pharmaceutical ingredient form. Asian J Pharm Clin Res 2016;9:61-6.
16. Amira SE, Shereen MA, Abdalla S, Magda EM. The development of a new validated HPLC and Spectrophotometric methods for the simultaneous determination of daclatasvir and sofosbuvir: Antiviral drugs. J Pharm Pharmacol Res 2017;1:28-42.
17. Gamal ER, Belal F. Stability indicating 1st derivative synchronous
spectrofluorimetric method for determination of newly approved antiviral drug daclatasvir in presence of its oxidative and photolytic degradation products: Application to tablet dosage form. Pharm Anal Acta 2018;9:1-7.
18. Sandhya RJ, Devanna J. A new RP-HPLC method development and validation for simultaneous estimation of sofosbuvir and velpatasvir in pharmaceutical dosage form. Int J Eng Tech Sci Res 2017;4:145-52. 19. Rao SN, Rajashekar V, Deeptishalini M. New analytical method
development and validation for the simultaneous estimation of velpatasvir and sofosbuvir in pharmaceutical dosage forms. Int J Pharm Ind Res 2018;8:123-8.
20. Hassouna ME, Abdelrahman MM, Mohamed MA. Assay and dissolution methods development and validation for simultaneous determination of sofosbuvir and ledipasvir by RP-HPLC method in tablet dosage forms. J Forensic Sci Crim Invest 2017;1:1-11.
21. Chakravarthy VA, Sailaja BB. Method development and validation of assay and dissolution methods for the estimation of daclatasvir in tablet dosage forms by reverse phase HPLC. Eur J Pharm Med Res 2016;3:356-64.
22. Deepa C, Sumalatha R. High performance liquid chromatographic method for the determination of daclatasvir in pharmaceutical dosage forms. Indo Am J Pharm Sci 2017;4:1431-7.
23. Hanaa S, Gamal HR, Othman MA. Stability indating HPLC method development and validation for determination of daclatasvir in pure and tablet dosage forms. Indo Am J Pharm Sci 2016;3:1565-72.
24. Benzil D, Ramachandraiah C, Devanna N. Analytical method development and validation for the simultaneous estimation of sofosbuvir and daclatasvir drug products by RP-HPLC method. Indo Am J Pharm Res 2017;7:480-7.
25. Magdyatef W, Mostafa SM, Sobhy ME, Elgawish MS. Development and validation of a new, simple-HPLC method for simultaneous determination of sofosbuvir, daclatasvir and ribavirin in tablet dosage form. IOSR J Pharm Biol Sci 2017;12:60-8.
26. Geetha SA, Rajitha G. Development and validation of stability indicating UPLC method for simultaneous estimation of sofosbuvir and velpatasvir in tablet dosage form. Int J Pharm Sci Res 2018;9:4764-9. 27. Naser FA, Hemdan A, Maya SE. Development of a robust UPLC
method for simultaneous determination of a novel combination of sofosbuvir and daclatasvir in human plasma: Clinical application to therapeutic drug monitoring. Int J Anal Chem 2018;1-9.
28. Notari S, Tempestilli M, Fabbri G, Libertone R, Antinori A, Ammassari A, et al. UPLC-MS/MS method for the simultaneous quantification of sofosbuvir, sofosbuvir metabolite (GS-331007) and daclatasvir in plasma of HIV/HCV co-infected patients. J Chromatogr B Analyt Technol Biomed Life Sci 2018;1073:183-90.
29. International Conference on Harmonisation. Guidelines for Validation of Analytical Procedures, Q2 (R1). Geneva: ICH; 2005.
30. International Conference on Harmonisation. Guideline on Stability Testing of New Drug Substances and Products Text and Methodology, Q1A (R2). Geneva: ICH; 2003.
Table 12: Stability-indicating data of daclatasvir
Degradation parameter Peak area of sample Peak area of standard % Assay % Degradation
Acid degradation 320127 335125 95.43 4.57
Alkali degradation 325462 335125 97.02 2.98
Oxidative degradation 329195 335125 98.13 1.87
Dry heat degradation 332481 335125 99.11 0.89
Photo degradation 333432 335125 99.4 0.6
![Fig. 1: Structure of sofosbuvir [5]](https://thumb-us.123doks.com/thumbv2/123dok_us/970162.1119132/2.595.46.289.377.752/fig-structure-of-sofosbuvir.webp)